Envisioning the Future of Buffalo’s East Side

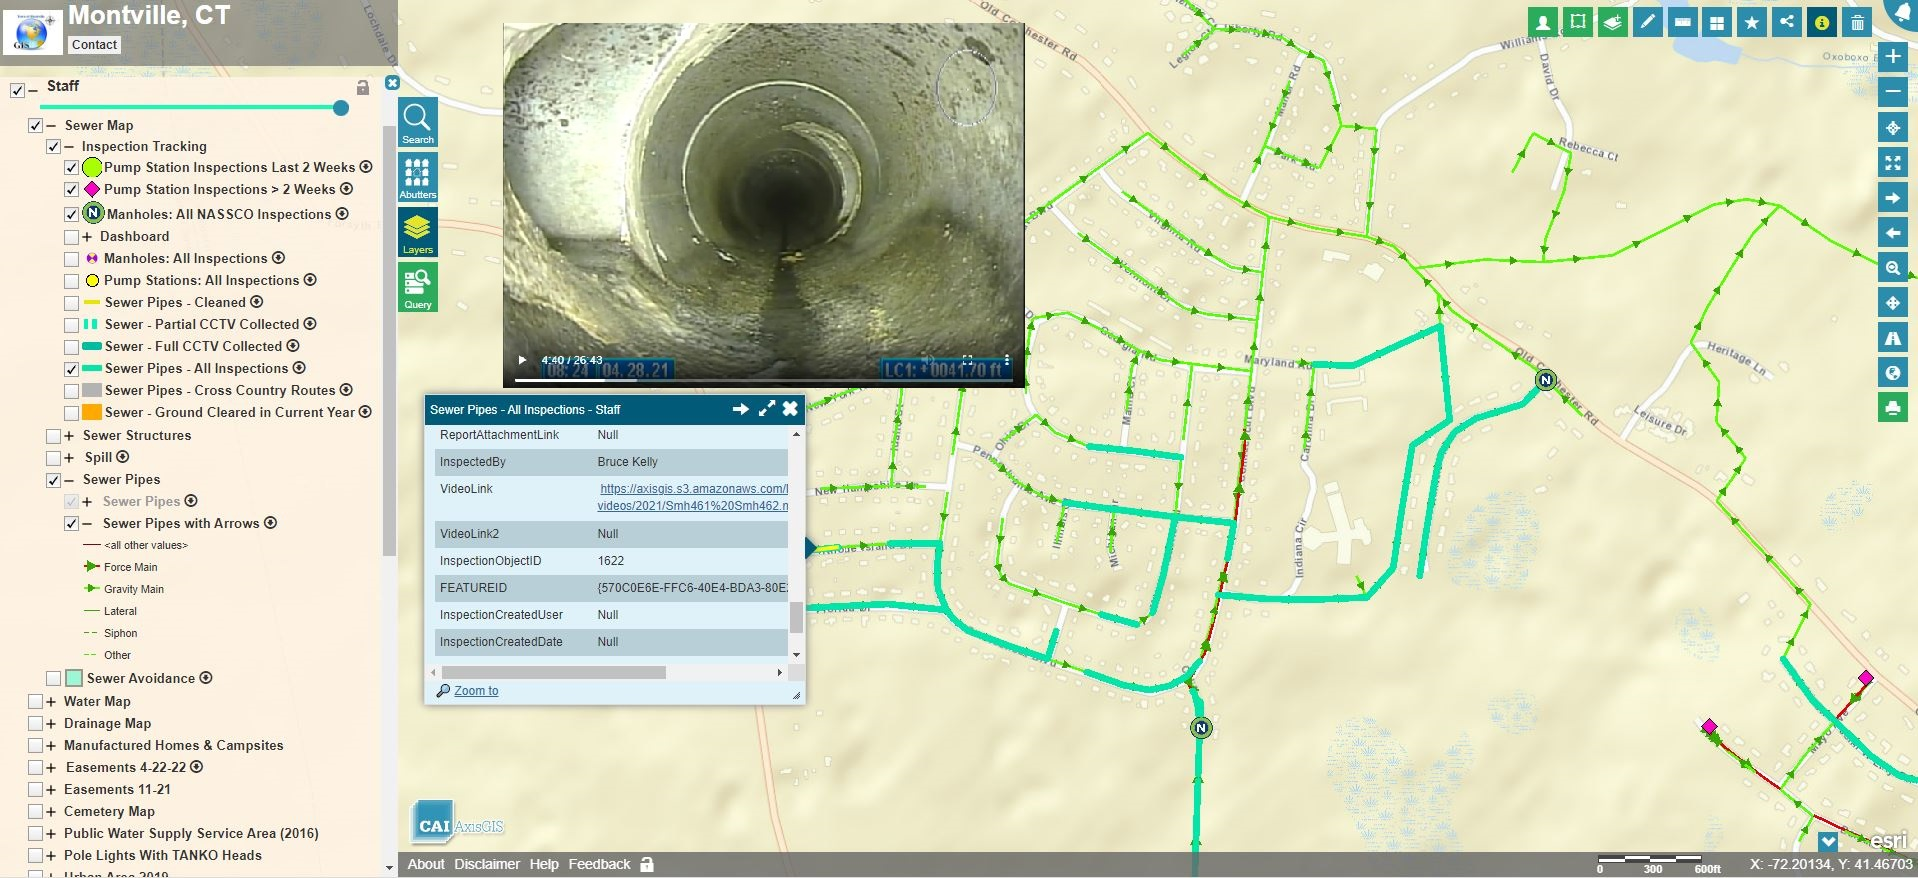
AGOL viewer, data HUB, and other geospatial tools used in helping develop WITHIN East Side Plan

Community focused GIS projects are always a favorite of mine to write about.  Highlighting how geospatial tools can be used by community groups – including nonprofits which are often project sponsors – to better help visualize and understand the vast array of environmental, regulatory, business and public health, and cultural data which impacts their daily lives.  One such project located in Buffalo’s east side was brought to my attention in a recent communication with Lisa Matthies-Wiza, Director of Geographic Information Services at Erie County.  

WITHIN East Side

The WITHIN East Side project is one of many projects of LISC Western New York (WNY) and its larger parent organization LISC New York.  program.   WITHIN East Side  focuses on simplifying the neighborhood planning and community development process, and ensures development is driven by resident leaders and community groups.  As an open, inclusive, community-driven initiative, WITHIN East Side brings together neighborhood voices, trusted partners, and supportive funders in an effort to better the wellbeing of residents using their own visions. Together with LISC NY, the WITHIN East Side stakeholders collaboratively identify projects that sustain the positive momentum happening in local neighborhoods.

In early 2020, LISC NY began planning with community partners in three geographic focus areas in the East Side under the WITHIN East Side program.  The East Side of Buffalo, which is the heart of Buffalo’s Black community was chosen as it is purposeful to build upon and lift up the long-time visions of residents and community leaders in neighborhoods most impacted by historic disinvestment, environmental, structural, and systemic racism.  The additional impact of the racist mass shooting on May 14, 2022, that killed 10 people, at a local supermarket within the planning area, furthered the importance of amplifying the community’s voice and vision for the future.

The project was designed as a two-pronged approach–integrating economic development and quality-of-life planning.  Closely intertwined, both  economic development and quality-of-life planning require understanding community history and dynamics, collaboratively identifying projects, building relationships with diverse stakeholders, and turning community priorities into progress.

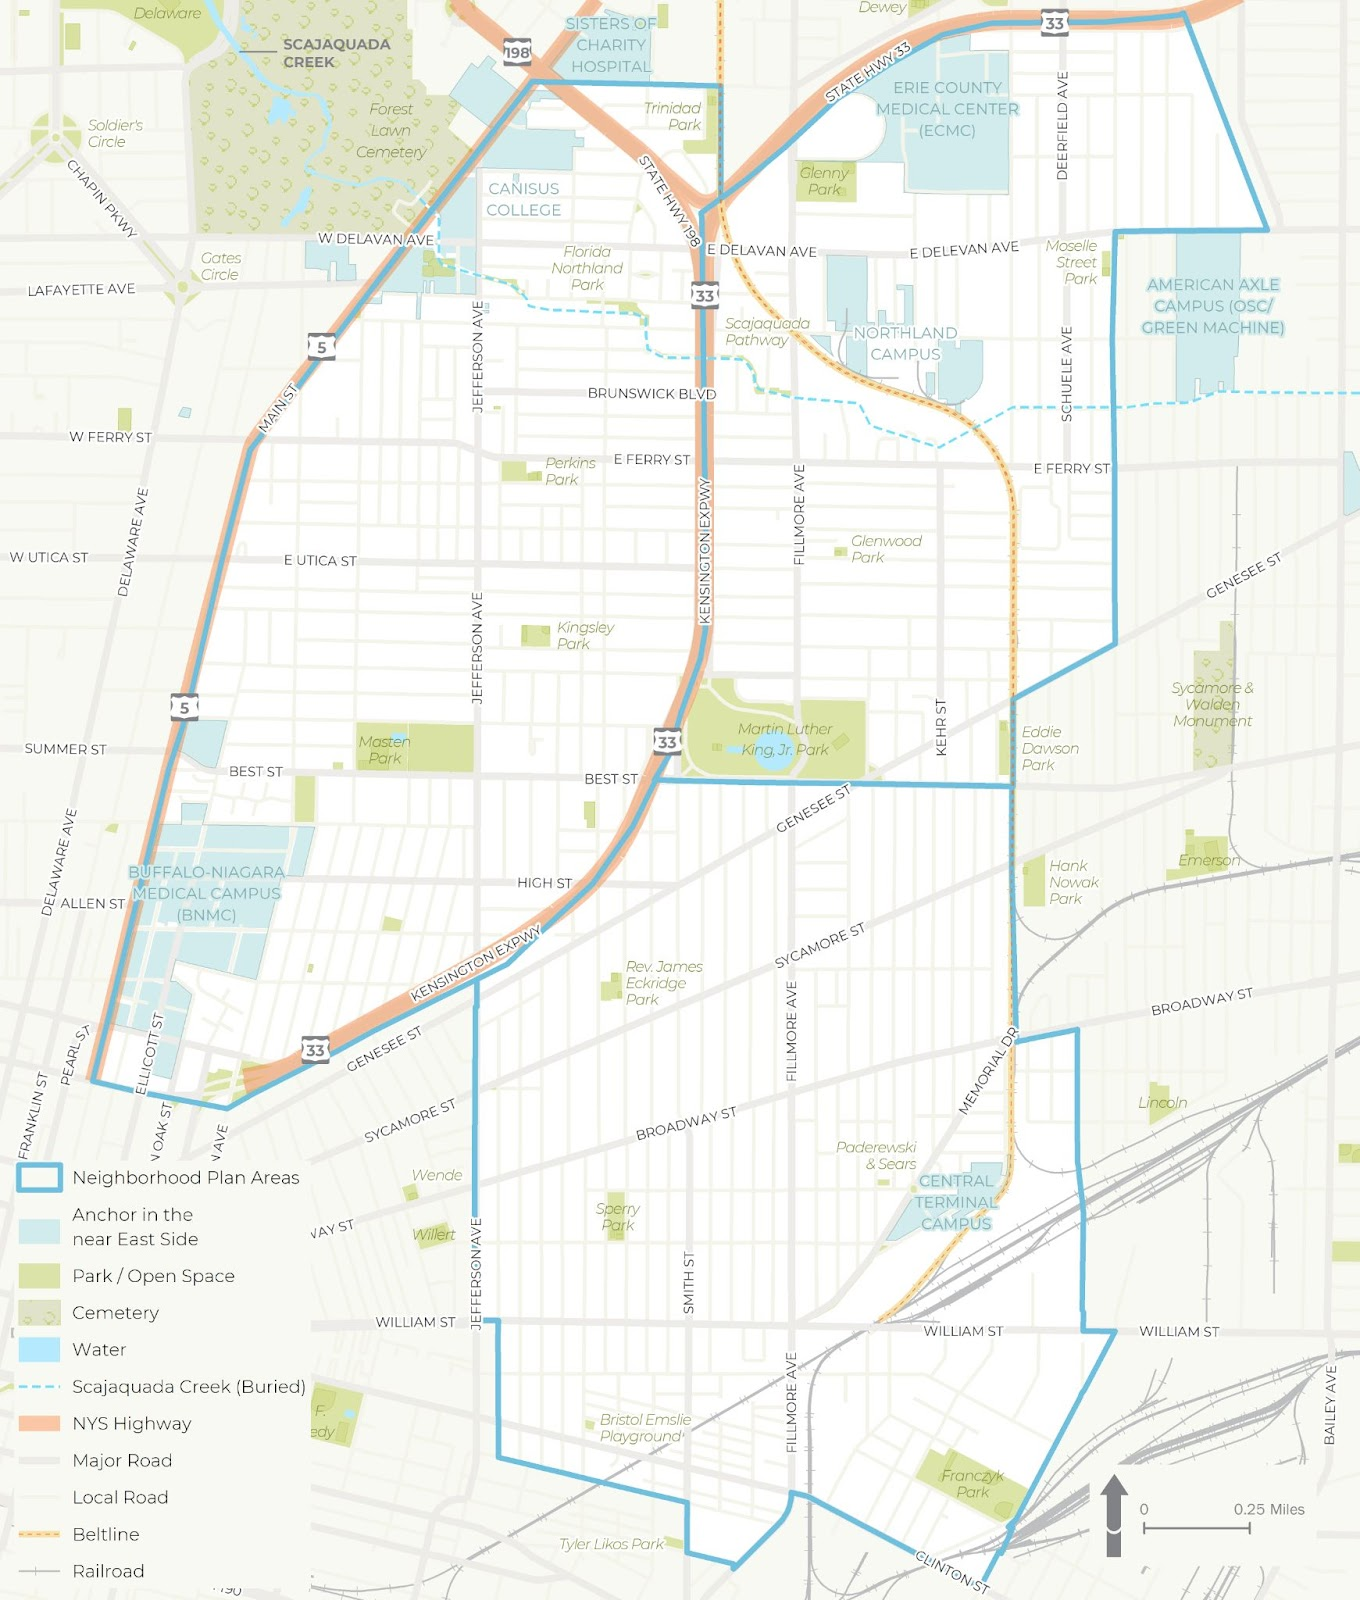
The WITHIN East Side project was broken into three distinct study areas – each of which was studied in more detail for a wide range of demographic, cultural and economic development issues

Background

LISC NY contracted with Prospect Hill Consulting (PHC), a local minority and women owned consulting firm which had responded to a formal Request for Proposals (RFP) which was issued in January 2021.  GIS mapping and analysis was a requirement and the LISC NY team knew GIS services were important to supporting the overall East Side project.  PHC was selected to perform elements A (GIS Mapping [including an online mapping tool request and a data HUB) and B (Scenario Planning).   While LISC NY had a vision of what the final plan might look like,  PHC was instrumental in assisting LISC NY in developing maps and visualizations used in the final plan and in community engagement sessions throughout the process.

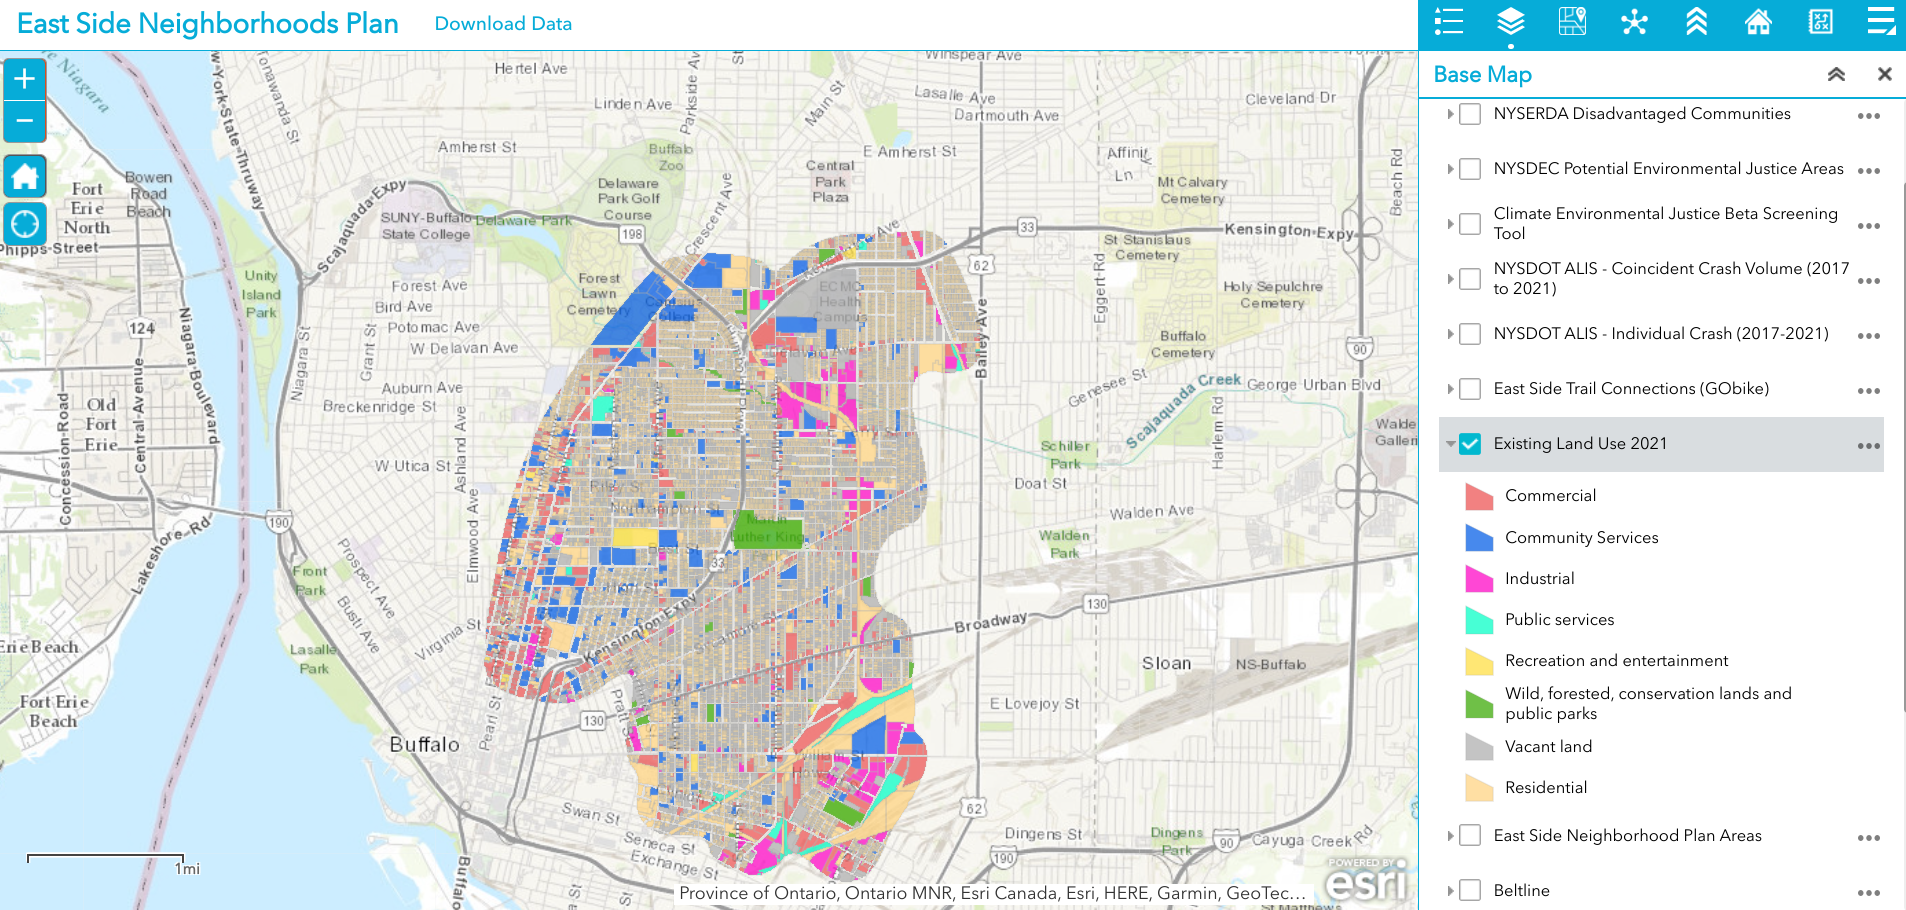
Existing 2021 land use is just one of dozens of data layers in the WITHIN East Side AGOL viewer. The rich database consists of local, regional, state and federal datasets.

Leading geospatial development of the East Side project from PHC was Jenny Magovero, President and Co-founder. Ms. Mogavero has been working in the GIS field for 23 years covering geospatial applications in community planning and environmental sciences as well as work in data visualization and  project management.  Mogavero created all of the maps in the East Side plan using the ArcGIS client as well as for spatial analysis and modeling.  The project web map is ArcGIS Online based with the data stored in a Hub Site (to allow for data sharing) and was designed about halfway through the GIS mapping and analysis task to support the WITHIN planning process itself.

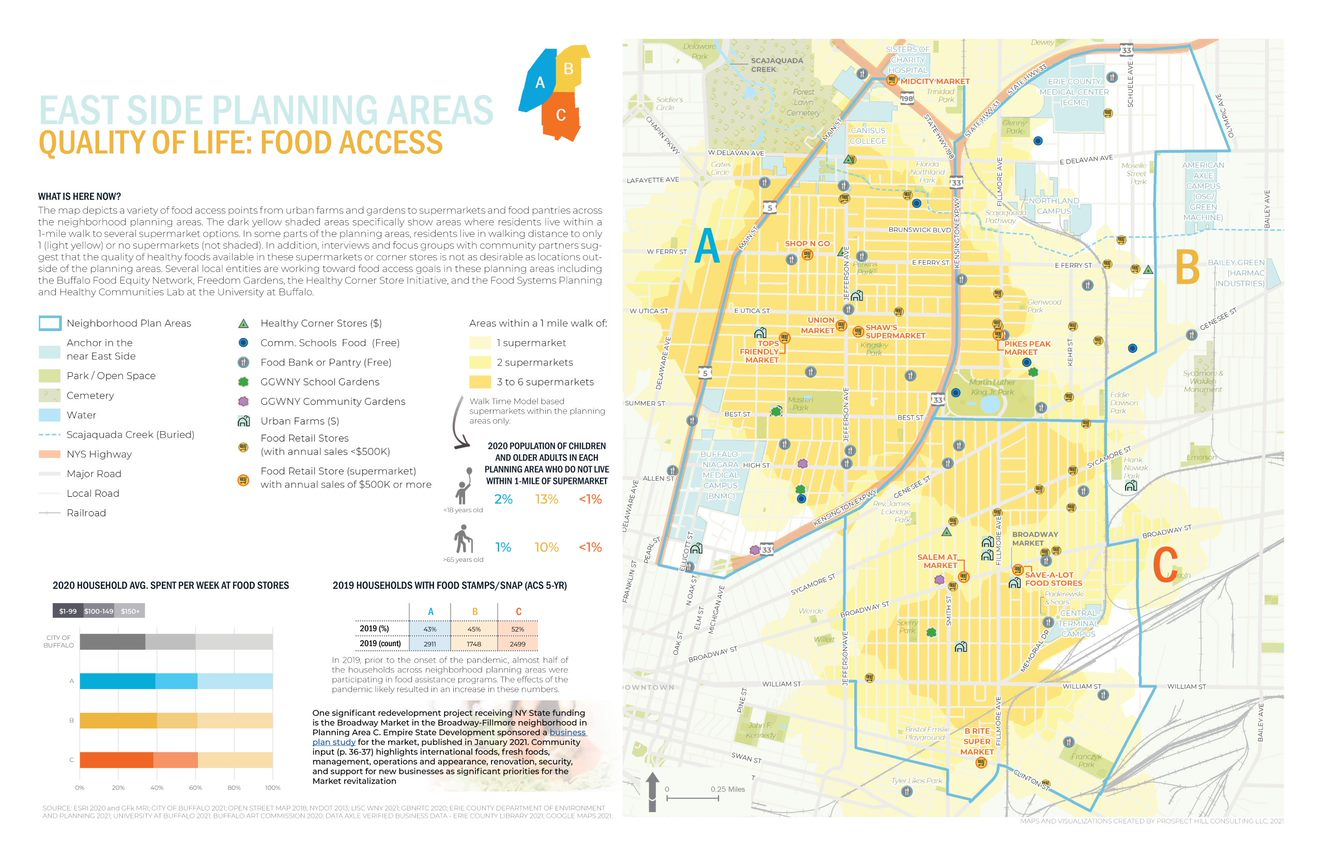
One of the many excellent graphics iWITHIN East Side report. The map on the right identities areas within the study area where supermarkets are located – a significant issue for residents with limited transportation options.

LISC NY wanted to be as transparent as possible and allow stakeholders (i.e. the community/public, organizations, etc.) to work with the data and download and use it if they needed.  To this end, the AGOL interactive map was used in community outreach and meetings early in the project and as new data came online (i.e., stakeholders requested to see additional themes) PHC continued to update the AGOL viewer. PHC designed the AGOL viewer to serve as a communication medium that allowed LISC NY to show project progress, survey the community on what themes needed to be covered and/or identify gaps, and to act as a platform to continue engagement with the community in the future. 

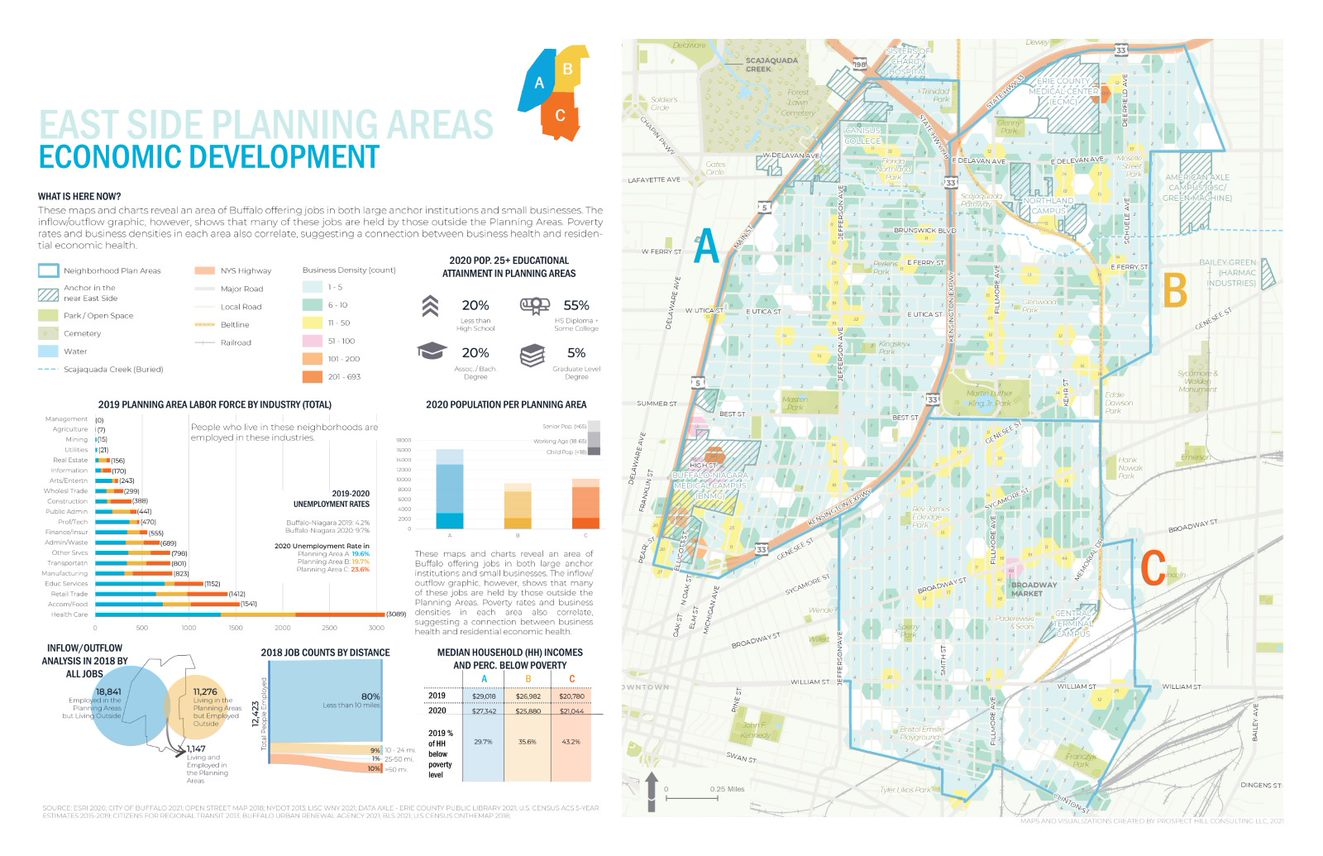
Economic Development issues are paramount in the study such as the role of small businesses, inflow of non-residents that work – but do not live – in the area, as well as the concentration(s) and accessibility of employment opportunities.

Data collection and development was specific to the mapping and analysis that the LISC NY team needed for the WITHIN plan itself.  As LISC NY has significant business relationships within the greater Buffalo community, they were able to collect a lot of data from local, state and NGOs. In addition, PHC collected publicly available data from the City of Buffalo, Erie County (parcels, land use, etc.), New York State  (NYSDEC, NYSDOT, etc.) and federal datasets (EPA, Census, etc.).  Additionally, PHC developed data from reports or datasets that were anecdotally described by stakeholders (like the air quality buffer, buried portions of the Scajaquada Creek, key intersections, etc.).  Project data was also obtained from utilities, Google, OpenStreetMaps, and ESRI.  

Most of the project data is made available through the LISC WNY Open Data Hub which was also designed and continues to be supported by PHC.  (Some providers did not want their data to be shared so it is only available for viewing in the application.)   

No AGOL account is necessary to access the HUB and tags help users to easily jump to specific themes of data presented in the final plan for download.

PHC used a bevy of GIS,  statistical packages, and desktop publishing software tools to generate the maps and graphics in the report including: 

  1. ArcGIS Online to collect stats for the neighborhood that were ACS 5yr census based (https://doc.arcgis.com/en/arcgis-online/analyze/enrich-layer.htm)
  2. Geospatial processing tools to buffer, clip, summarize, and run overlay analyses
  3. Spatial Analyst tools to develop walkshed layers (from points provided by Walkscore)
  4. Tableau Desktop and Excel to conduct data exploration to emphasize trends (or data insights) with graphs/visualization on  map layouts
  5. Adobe InDesign for page layouts and other graphics to be consistent with the LISC NY brand book (design guide) including colors, fonts, and logos.
  6. ESRI’s Hexagon sampling tool to visualize parcel data classes (i.e. land use, vacant parcel density, ownership) at the scale of the plan areas. 

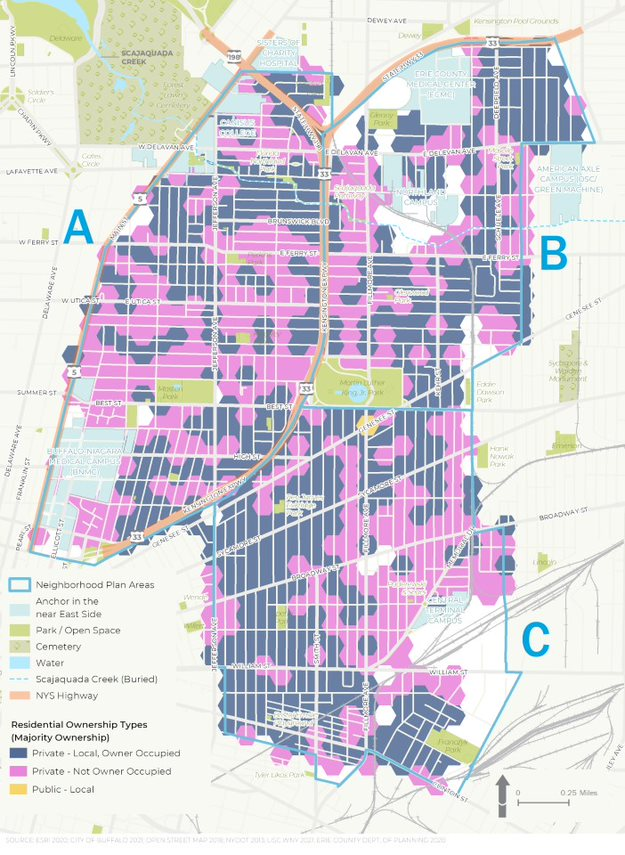
Residential ownership type is an important variable in urban studies. Data presented in the figure above suggests there continue to be many opportunities in increasing owner occupied properties in the study area

Summary

While consulting architecture and engineering companies continue to expand their geospatial offerings to governments and regional programs in 2022, particularly in the infrastructure and public works space, planning firms such as PHC serve in a unique space focusing on efforts which include applying geospatial tools as part of important community-based projects which often include significant public input and involvement.  Tools such as AGOL provide a great  framework in which to engage the public with regard to adding and removing data content and visualizing potential scenario outcomes.  A particularly useful tool given the enormity of the data used in the WITHIN East Side plan.

Reflecting on PHC’s involvement in the study, Jenny Mogavero notes:

“LISC NY is an integral part of, and key economic engine within the Western New York region.  Prospect Hill was honored to partner with the LISC NY to use GIS data, visualization tools and spatial analysis methods to not only present the existing conditions of our city’s East Side neighborhoods, but also reveal the deeper insights that occur when we overlap data-driven stories across multiple thematic lanes.  We were thrilled that our work supported the teams’ consensus building goals to develop a vision of a prosperous future for an important part of our City.”

Tyra Johnson Hux, WNY Director of Operations, also reflects on PHC’s work and the use of geospatial tools in the project adding:

“WITHIN East Side amplifies the visions of residents and community leaders in neighborhoods impacted by historic disinvestment, environmental, structural, & systemic racism. Showing their stories through, not only their own words, but also data was critical to helping our stakeholders generate a bold, authentic and comprehensive vision with an emphasis on implementation.  PHC supported the WITHIN East Side Plan by working with the project team to identify, collect and normalize relevant GIS data from neighborhood, government, academic and other partners. Additionally, they worked with us to analyze and visualize the community experience through maps and infographics.  The online interactive map and data warehouse they developed made it possible to share data in a way that breaks down silos, facilitate  strategic planning and continue community conversations.”

Contact

Jenny Mogavero, GISP
Prospect Hill Consulting LLC | Principal
716.432.9053 | www.prospecthill.co
jmogavero@prospecthill.co

Lashay Young, Director
External Affairs for LISC NY
https://www.lisc.org/
LYoung@lisc.org

GeoSpatial Business Spotlight: CAI Technologies

Location:              Littleton, New Hampshire 

Website:               www.cai-tech.com

Employees:          25

Established:        1985

Background

CAI Technologies has been providing GIS services to local and regional governments since 1989, making it one of the oldest and most experienced companies in the marketplace.  Since it was founded in 1985 as Cartographic Associates, Inc, CAI Technologies has been a recognized leader in local government parcel data development. Instrumental in developing the original parcel fabric, including record research and compilation for more than 270 municipalities, CAI continues to support parcel mapping development and annual maintenance needs for over 650 local governments.

Other strategic CAI corporate business functions focus on geospatial technologies including enterprise geodatabase design, GPS field data collection/mapping, and implementation services for critical utility infrastructure.  Focusing on water, sewer, and drainage infrastructure, CAI Technologies develops user tools which make system mapping, implementation, and ongoing maintenance cost-effective.  Additionally, the company provides a full scope of development services including requirements analysis, functional design, development, installation, training, and support.

CAI has a significant New York State customer base as the company currently supports the business needs of clients through implementing industry leading geospatial solutions.

Illustrative Projects

East Hampton, NY ArcGIS Enterprise Support

Since 2015 CAI has supported the Town of East Hampton by providing staff and expertise for managing and upgrading their ArcGIS Enterprise. With each upgrade, CAI provides the Town with a detailed plan including scope and pricing to support each task. Plans are designed to include processes to minimize downtime, identify fall back procedures, and provide time for end user acceptance testing.

Upgrades initially focused on ArcGIS Server and migration of existing SQL back office and SDE database onto one hardware appliance.  Next, CAI implemented Portal for ArcGIS to support Active Directory based logins with a federated ArcGIS Server. Once Portal was configured including the web adaptor, roles and permissions, CAI configured Web App Builder in the new Portal environment and migrated existing web applications.  “CAI has worked on a number of projects for us over the years and we continue to go back to them because of their excellent service,” notes Bob Masin, GIS Manager, Town of East Hampton, “they work collaboratively with us to fit our needs, are responsive, and always go the extra mile to make sure the job is done right and to our satisfaction” 

As new versions of existing software and add-on features become available, CAI coordinates implementation with the Town to ensure they are maximizing their return on investment. Most recently, CAI federated ArcGIS Server and Portal as part of an upgrade to Enterprise 10.9.1

Bedford, New York 

The Town of Bedford for many years maintained tax parcel data in various formats. A Town wide parcel layer existed in shapefile format with a majority of the tax maps generated from AutoCAD.   Some of the most current maps however only existed in PDF format. As a result, not all data sets were updated consistently each year which resulted in an inaccurate parcel dataset.

To meet the needs of the Assessor’s Office it was clear that the tax maps required updating and the resulting parcel data needed to be linked to the RPS assessment database. Using the existing source files, CAI digitized all of the existing lines and annotations into an ESRI geodatabase. Going as far back as 2011, deeds and plans were reviewed and parcels were recompiled in order to update the maps. Using additional information provided by the Assessor’s Office, CAI created GIS layers for condos and easements. Once updates were completed, CAI configured a Data Driven Pages map document file in order to print new tax maps from the GIS data.

CAI assisted the Town of Bedford in converting both existing digital datasets and hardcopy maps, including condos and easements, into a ESRI Geodatabase. This will support future tax map maintenance functions and serve as the foundation of the town’s AxisGIS public facing application. https://www.axisgis.com/BedfordNY

Capitol Region Council of Governments, CT

CAI Technologies Receive Special Achievement in GIS Award

The Capitol Region Council of Governments, CT (CRCOG) and CAI Technologies were selected to receive a Special Achievement in GIS (SAG) Award from ESRI. This award is given to users around the world to recognize outstanding work with GIS technology. The CRCOG/CAI Regional Parcel Viewer and Regional GIS Portal web application stood out from more than 100,000 other applicants.

CROG is the voluntary Council of Governments organization supporting 38 municipalities in the Metropolitan Hartford CT area including the City of Hartford. It is the largest of the nine regional planning organizations in Connecticut. CRCOG provides services to member towns to promote efficient transportation, public safety, responsible land use, preservation of natural resources and economic development as well as supporting shared service initiatives between member communities.

The project is a self-hosted and self-maintained Regional GIS Portal and Parcel Viewer to serve CRCOG member municipalities as well as to provide a flexible infrastructure for internal and external users. Features include automating the collection and linking of parcel and computer-aided mass appraisal (CAMA) data for each community hosted as a 38 community fabric of parcels, providing productivity tools including generation of abutter lists and labels, and providing contextual data from local, State and Federal partners such as infrastructure, environmental conditions, natural resources, census information, and political geographies. Project tasks also included streamlining and automating the update of CAMA data to the site. CRCOG GIS staff are now able to add town-specific data layers without incurring additional costs.

The CRCOG parcel viewer exemplifies the cost-efficiencies of shared services providing parcel data viewing and related mapping functions to 38 municipalities in the metro-Hartford area

The portal provides  the region with an invaluable repository of property information to support local and regional planning and development while also allowing CRCOG to implement an ArcGIS Platform which will be expanded to serve other needs of the COG organization and member communities.  The portal  continues to be a collaborative effort between CRCOG and ESRI Business Partner CAI Technologies and can  serve as a model for other regional planning agencies to follow.

The portal site can be visited at https://crcog.org/regional-gis/

Utility Mapping and Inspection Tracking Using GIS

CAI provides mapping services for their clients Water, Sewer and Stormwater systems.  Working with client staff, CAI performs Global Positioning Systems (GPS) data collection of the system point features and at the same time provides connectivity of the utility pipe network.

Working recently for the Windham Water Works and Windham Water Pollution Control Authority in Windham, CT, CAI performed sub foot data collection and mapping for over 130 miles of Water system and 47 miles of Sewer system. Taking advantage of the already in place AxisGIS service CAI hosts for the Town of Windham, the utility systems are made available to each utility in a secure staff only accessible AxisGIS Editor service. Each utility now maintains their data using AxisGIS Editor and Field Maps for ArcGIS.

CAI also integrated the water utility’s customer database with the GIS, thereby allowing easy field access to the water service connection tie cards. Recently CAI configured ESRI’s Lead Service Line Inventory solution to support inspections required to meet the Environmental Protections Agency’s (EPA) Lead and Copper Rule Revisions.

With many aging sewer systems present in the Northeast, CAI works with clients to record and display their Manhole and Pipe inspections using GIS. Typical pipe inspections include capturing CCTV video. The camera operator records information relative to pipe condition, material, diameter and lateral locations. CAI is able to glean this information from the inspection software database in an automated fashion to update feature attributes, create GIS features representing sewer lateral connections and symbolize lines based on their condition. The CCTV video is linked to the corresponding pipe segment for easy retrieval in the field or office using AxisGIS or ArcGIS Online (AGOL).

The AxisGIS  platform provides an excellent framework to integrate and mash together several different types of infrastructure data types including geometry, reports, and video inspections.

For those communities that are a permitted Municipal Separate Storm Sewer System (MS4), CAI provides system mapping and application development to support annual reporting requirements. To support outfall and ditch inspection workflows, CAI has configured a suite of AGOL Applications and Dashboards. Using Field Maps for ArcGIS, clients can record inspections while in the field and progress is shown using Dashboards configured in AGOL. As a result of significant EPA updates to the current MS4 General Permit, CAI has updated Outfall Inspection applications to support capturing test results required of any dry weather inspection where flow is present.

Dashboards are useful for managers responsible for monitoring and maintaining infrastructure systems. Displayed information aids in both communicating and managing field crews. Long term benefits assist in preparing annual and capital budgets.

Contact:

Aaron Weston
Business Development Manager
CAI Technologies
www.cai-tech.com
800.322.4540 x28
direct 603.761.6241
aweston@cai-tech.com

Warren County GIS: A Showcase of Geospatial Content for County and Local Government

Program’s modest beginning started in the late 1990s with AutoCAD files and a copy of ArcInfo

Now spending a significant amount of time upstate New York in Essex County, we now find ourselves looking for different routes to take back and forth from southeast New York State instead of the “go-to” I87/Northway option every time.  Just to mix things up – the four-plus hour drive going the normal route can get to be a bit monotonous.

So it was in September I came south out of Ticonderoga headed to Hague (yes, named after The Hague in the Netherlands) on the northern end of Lake George – an area I had never been to.  And it did not disappoint.  Though ultimately to State Route 8 (aka Graphite Mountain Road) to a new Adirondacks trailhead:  Swede Mountain Firetower.  Even though the round-trip hike isn’t that long and relatively easy, it was getting late and I didn’t even get out of the car while in the trailhead parking lot.  Instead, making a note to print out a trail map when I got home.  A couple days later and not having a clue what trail maps were actually available, I Googled “Swede Mountain Firetower trail map” and a candidate list of URLs and image options were immediately returned.  Randomly selecting the one below,  the cartography caught my eye and I quickly looked for the map’s author.  There on the bottom left:  Warren County GIS.  

It was quickly then off to the Warren County GIS website.  Which became the genesis of this article.

Warren County GIS

Just by coincidence, this article coincides with the release of the new Warren County GIS Hub as announced by long-time county GIS Administrator, Sara Frankenfeld.  Overseeing a countywide GIS program judiciously developed over the course of more than two decades – from the days of ARC/INFO coverages to 2022 mobile field apps and interactive online viewing applications.  Also available through the program and Hub is a rich repository of dozens of hardcopy maps available for download covering areas such as countywide outdoor recreation, history, demographics, municipalities, planning and the environment and much more.   An amazing amount of content bundled into three main categories:  Web Maps and Apps | Maps for Print | Download Data.

Background

Originally from the northside of San Francisco Bay in Marin County and earning a degree in Geography from Northern Arizona University, Frankenfeld came to the east coast to initially start work with Dutchess County.  After a short stint with NYSDEC she ultimately made her way to Warren County in 1999 where she got started with a copy of ARC/INFO on a standalone computer in the county building basement.   The county had created a new GIS position in the Planning Department to help convert the tax maps to AutoCAD and then over a period of time converting from AutoCAD to ARC/INFO and then later to geodatabase. 

Over the next four years, she was successful in winning over several other departments on the value and usefulness of GIS technology which she accomplished by focusing on easy, visible “wins” such getting people to use the newly available digital tax parcel data (linked to the RPS data) as quickly as possible and making hardcopy maps.  Lots of maps.  The visibility of the Warren County program also expanded by her working with municipal government zoning administrators and assessors and providing access to the new digital parcel data and including zoning maps,  wetlands data, and FEMA floodplain maps.  A New York State Archives and Administration (SARA) grant enabled the development of a parcel viewer app sby AppliedGIS – where she would later go to work for several years – called the Spatial Data Viewer.  The groundwork was also laid for the implementation of ArcIMS and Imagemate Online.  Somehow she also found time to include outreach programs to local schools and GIS Day.  

After a period in the private sector with (then) AppliedGIS/Fountains Spatial, she returned to Warren County in 2013 where she remains today.  

Today’s Environment

In 2022, the Warren County GIS program is built totally around the ArcGIS Online (AGOL) environment.   Frankenfeld states AGOL has “totally transformed the workplace” and furthers her two main goals of (1) improving public access to data and (2) streamlining/improving processes for county departments and organizations the GIS program supports.  She, along with GIS Specialist Amanda Beck, have embraced StoryMaps, Dashboards, Hubs and Survey123 in ways to make it easy for non-tech users to create and maintain data and access it.  While many of the combo Survey123/dashboard applications are internal facing, others, like the Lake George Milfoil Harvesting real-time app is available to the public.  And so is the Capital Improvement Project Planning viewerBoth respond to GIS requests from local municipalities, local organizations including  the Adirondack/Glens Falls Transportation Council (AGFTC), Lake George Park Commission and the Lake Champlain Lake George Regional Planning Board – all of which have tech support contracts the County.  Projects range from data compilation to hardcopy map preparation to creating and supporting online apps.  Usually these three organizations know exactly what they want, but GIS staff we do often try to suggest ways to streamline or improve their requests.  For example, County GIS staff helped AGFTC come up with a method to inventory sidewalk/crosswalk/curb ramps for ADA transition plans that proved really popular and resulted in a training session for all the Metropolitan Planning Organizations (MPO) in the state.

Dashboard for Adirondack/Glens Falls Transportation Council’s Transportation Improvement Program projects.

Having transitioned to ArcGIS Pro to support data editing, cartography and more complex analysis, Warren County GIS staff do a majority of their work in AGOL which includes the mobile pieces Field Maps and Survey123.  They still collect GPS data as needed (usually related to recreation or e911) and support field operations, such as collecting milfoil harvest or infrastructure data, for other users.  They also have Trimble boosters and cell phones which can be checked out to both county staff and municipalities for field data collection along with field worker licenses.   While there are still a few remaining ArcGIS desktop users, most users are using AGOL with named users in Planning, Soil and Water, Public Affairs, the Sheriff’s Department, Office of Emergency Services, Public Works, and Parks and Recreation.  Address and road centerlines are uploaded to the state twice a year and parcel data once a year.  A large current project Sara and Amanda are currently working on is building additional GIS capacity and functionality in County Department of Public Works.

Except for Queensbury which has its own full-time GIS staff person, Warren County GIS supports all municipalities in the County.  At the beginning of the program, Sara had  set up each municipality with desktop GIS as well as providing training and support.  In hindsight and it comes as no surprise this desktop support  was the most time consuming element of her job in the early years.  With the advent of online GIS, County staff has transitioned most of the towns off of desktop GIS, although there are a small number of towns which still use the desktop client.  Most local communities across the County now utilize new AGOL applications.   “We often will take the initiative with projects for the towns that relate to work the County Planning Department is doing such as the Warrensburg buildout analysis“, notes Frankenfeld, “as well advocating the adoption of Field Maps for maintaining water and sewer data.”

New GIS Hub

As noted previously, the new Warren County GIS Hub contains three main areas of content:  Web Maps and Apps | Maps for Print | Download Data.  Each area is then broken down further thematically into categories such as recreation, environment, transportation and infrastructure, planning and zoning, history, citizen reports and more.  With an established user community in County government, most of the time departments and organizations now approach GIS staff directly with applications to develop to support their business needs such as the Safe Pace, Opioid Dashboard, Storm Reporter, TIP viewer, etc).  Other projects have been initiated by GIS staff themselves such as the covid hub and election polling locator.   GIS staff work frequently  with other Planning Department and and apply grant funding to create projects such as History Mapper and the letterboxing challenges (Letterboxing Trail and Historians’ Challenge).

Geospatial viewers are excellent for publishing public transportation systems content. In addition to making time tables and schedules available, ones such as the GGFT also include important public sites such as health care facilities.

Today the COVID Hub is the most popular app though much simplified from early COVID and no longer maintained by the GIS team.   It’s had around 1.5 million views  since its inception in April 2020 – not bad for a county with a population of 64,000   The next most popular is the parcel viewer app (Community Map), which gets about 12k views a month.  After that, the First Wilderness website (about 7k views a month) and the Recreation Mapper which gets a couple hundred views a day, higher in the summer.  Warren County’s primary industry is tourism and is an outdoor recreation destination, so trail maps and recreational resources are popular content and Sara and Amanda spend a substantial amount of time creating and maintaining recreation data and providing access to it.

Warren County GIS provides technical support to the Lake Champlain Lake George Regional Planning Board which extends beyond the Warren County footprint. This viewer contains both American Community Survey and 2020 Census data for areas in the five north country counties covered by the Regional Planning Board

Though the application was closed in August, another public facing app focused on the American Recovery Plan Act (ARPA).  Survey123 was customized to create an application for those organizations interested in applying for ARPA funding.  The applications were made available to committee members for review through a Dashboard, and scoring was completed using another Survey123 form.

American Recovery Plan Act (ARPA) grant monies provides funding for investment in a wide ranges of community programs and services including geospatial efforts in the rehabilitation and mapping of infrastructure systems.

Sara’s Law

There probably aren’t many geospatial professionals working today across the Empire State that are familiar with Sara’s own little piece of New York State GIS history.  The year was 2002 and it was during her first stint with Warren County.  While using a GPS unit to map the locations of fire hydrants in the North Creek area, she was “challenged” by the professional surveying community of mapping features in a manner/way she was not qualified to do so.   Her post to New York State GIS listserve at the time describing the events read:

“In January, I(Sara) was contacted by an investigator from the New York State Education Department’s Office of Professional Discipline.  They had received a complaint from a surveyor stating that I was surveying without a license.  I was using a Trimble Pathfinder Pro XR GPS unit to collect fire hydrant locations and then plot them on a reference map.  Two investigators met with myself, our planning director, and our county attorney.  The investigators were unfamiliar with GPS and GIS and were basically on a fact-finding mission.  The investigation has progressed, and today we met with the two investigators, an attorney from the Office for Professional Discipline and a surveyor from the New York State Board of Licensed Engineers and Land Surveyors.  The state’s attorney told us at the beginning of the meeting that after reviewing the facts in the case, they do feel that we are guilty of practicing surveying without a license.  She then gave our county attorney a chance to state our case, which I thought he did very well. We were informed that the board will make a decision within the next week.”

At the time, it WAS a really big deal in the statewide geospatial and surveying communities – particularly New York State Association of Professional Land Surveyors (NYSAPLS) and the subject of much discussion and debate.  Significant in that it marked, for the first time, the visible intersection of emerging GIS/geospatial technologies and the professional discipline of surveying – and by extension, engineering in New York State.    While legislation (A01927 & S04396) was proposed in the 2007/2008 timeframe looking to “enhance the definition of land surveying with current standards and tools, i.e., GPS”, nothing was ultimately passed.  And along the way over the course of several years, the discussion and the proposed legislation became known as “Sara’s Law”.  

Little did she know the backpack GPS unit she was using in 2001 in North Creek would one day be the beginning of bringing these different, but similar geospatial technologies together as they are today.   Sara’s place in NYS GIS lore is secure.  

Summary

In addition to the broad presence the Warren County GIS program has throughout county government, it also represents the great relationship and guidance county geospatial programs can provide and offer to local governments.   Local governments that often have both limited financial and technical resources can benefit greatly from county GIS which have technical expertise and infrastructure in place.  A model that can be replicated in other areas across New York State.   

Contact

Sara Frankenfeld
GIS Administrator
Warren County GIS
Warren County Municipal Building
Lake George, NY 12845
frankenfelds@warrencountyny.gov
518-761-6410

GeoSpatial Business Spotlight: H2M

Location:        Corporate Office in Melville, New York /  10 Other locations 

Website:          www.h2m.com

Employees:    372 in Melville / 110+ in satellite offices

Established:   1933

H2M is a multi-disciplined professional consulting and design firm focusing in the fields of architecture, engineering, and environmental sciences. From treatment facilities to public safety buildings, land surveying and road reconstruction, and from site assessment to remediation, H2M has helped design and build throughout many communities across New York State since 1933.

Geospatial Support in Water Supply Systems

H2M has built its engineering practice around its service to water clients working directly with municipal water suppliers and private water utilities. The company’s work in this space has grown significantly over the past five years and is built on decades of combined municipal and private A/E experience. Recent work has focused on supporting public and private water systems to comply with new U.S. Environmental Protection Agency (EPA) Revisions to the Lead and Copper Rules which require an initial inventory by October 16, 2024. One of the rule’s requirements mandates the inventory must be made publicly available online for systems serving a population of more than 50,000 people.

H2M’s primary water-related consulting includes, but is not limited to, comprehensive and cost effective water engineering, water quality analysis, distribution system mapping, water storage tank inspections, water quality testing services, lead service line (LSL) inventory, leak distribution analysis, main break mapping, hydraulic (pipe) modeling, and a full suite of online and mobile mapping applications utilizing industry leading GIS software solutions. Fully integrated GIS applications include access to maintenance logs, field notes, spur maps, tap cards, valve sketches, as-build drawings, and photos.

The scanning and indexing of historical hardcopy records of water system features adds great context and valuable information to new GIS-based applications

Complaint tracking, customer notification, and work order management functions are also supported by H2M as many infrastructure GIS systems are integrated with Enterprise Asset Management (EAM) programs such as Cartegraph, IBM Maximo, Cityworks, Tyler, AssetWorks, Infor, and Lucity. These systems often consume published GIS map services, ensuring dynamic connectivity for real-time data analysis and review.

In the realm of field data collection, mapping and viewing software is augmented by powerful mobile apps. ESRI’s suite of mobile software products includes Field Maps, Survey 123, Workforce, and QuickCapture. These mobile apps can be augmented by connecting to external GNSS devices for real-time coordinate correction and higher accuracy data collection.

H2M’s work in the water system space includes the delivery of dashboards to which have become increasingly popular among administrators and decision makers providing a direct and “live” link to water system databases. Such dashboards access to pie charts, spreadsheets, photos, and mapping/viewing windows

Illustrative Projects:

Greenlawn Water District

H2M assisted the Greenlawn Water District in meeting new EPA lead service line inventory requirements by accurately geocoding each of their 12,017 service accounts and creating a data schema that complies with New York State Department of Health requirements. H2M reviewed multiple sources of information to determine service material including approximately 12,000 tap cards, dozens of hardcopy record replacement maps, and municipal records that include date of construction. Based on this information, H2M created an inspection map in ArcGIS Online which allows the District to determine areas with unknown service material and suspected lead which requires further investigation. H2M deployed Esri Field Maps as well as a Survey123 inspection form for the District to record their field inspections. This allows the District to easily document field inspections with notes and pictures, which are tied directly to the core GIS inventory data. Furthermore, H2M created multiple dashboards in ArcGIS Online that provide a dynamic snapshot of known and unknown service line material. This enables the District to quickly see the quantity of accounts that require further investigation and action, should replacement be required.

Online map viewers are easily configured to visually classify the types of water system materials owned by both the water district and by property owners

Village of Garden City Water Department

H2M was tasked to perform the Village-wide Lead Service Line (LSL) inventory and to develop a searchable, map-based data repository within its existing ArcGIS Online environment. As part of this work, H2M’s geospatial team reviewed several thousand individual records provided by the Village, including Excel spreadsheets, Building permits, plumbing permits, and nearly 1500 engineering plans. Information pertaining to water service material was transposed from the source materials to the GIS data. Source documents were also attached to the GIS data to facilitate simplified, map-based retrieval in the future. In addition to scanned documents, H2M incorporated information from engineer field observations, customer reports, and date of construction, as documented by the Nassau County assessor’s office.

Every street-side and customer-side water service within the Village is mapped and catalogued by its documented material and status.

Veolia North America (formerly SUEZ Water New Jersey

Veolia owns, operates, and maintains a network of hundreds of miles of transmission and distribution infrastructure serving more than a million residents in numerous municipalities/institutions throughout the State. In advance of the proposed State of New Jersey lead service line regulations, Veolia launched a comprehensive lead service line replacement (LSLR) program in 2019. Veolia sought assistance from H2M architects + engineers (H2M) as Construction Administrator and Construction Observer to support the regulatory compliance goals and ensure detailed records of field activity, including digital mapping in a GIS framework.

The initial scope of the 2021 LSLR program was characterized by the performance of dig-and-determine for1,900 services and the replacement of approximately 1,200 (lead and non-lead) lines within the Veolia Hackensack Public Water System Identification (PWSID), which has since been expanded to 4,600 dig and determines and 2,500 replacements.

The most challenging portion of compliance for Veolia and H2M was in the identification, cataloging, mapping,and replacement of lead service lines in systems. Service line inventories must result in the categorization of services as either: LSL, brass with suspected leaded gooseneck requiring replacement, galvanized requiring replacement, or non-lead.  Particularly vital to the success of this effort was the creation and maintenance of a set of standards intended to document compliance with the updated federal Lead and Copper Rule and ensure continuity of critical infrastructure data for future operations. To accomplish this, H2M utilized a novel, tablet-based data collection tool to document each crew’s daily activities and ensure immediate QA/QC access to the Veolia leadership team.

H2M’s work has ensured Veolia remains EPA compliant and ahead of the new requirements schedule.

 Hicksville Water District

Since 1996, H2M has supported the Hicksville Water District and as part of this work, a service line material inventory was created for the District utilizing Geographic Information Systems (GIS) technology. Leveraging existing District data which exists in both hardcopy and digital format (tap cards, record replacement maps and date of construction records) and combining with field collected datasets, H2M continues to assist the District in meeting EPA Lead and Copper regulations. This also includes complying with public/private water system data standards established by New York State Department of Health.

ESRI’s ArcGIS Online provides an excellent framework to establish and serve easy-to-use map viewers that will allow residents to look up service material by either address or account number. H2M’s efforts support compliance with the regulation and increased transparency for the municipality.

Water distribution systems built before the 1950s often had distribution networks that were built with lead piping

Summary:

The team of GIS professionals maintain technical fluency in the constantly-changing
GIS industry software and practices including the ESRI and AutoCAD platforms.
Software flexibility and expertise in deploying need-based solutions ensures H2M’s clients have the information they need to continue to provide the highest level of service to our communities.  A more detailed description of H2M’s capabilities and geospatial work in the water systems industry can be found in this presentation.

In addition to applying and creating solutions for the water systems sector, H2M’s geospatial team also provides client services in the following areas:

  • BIM Integration
  • Community Planning
  • Data Conversion
  • Digitization of Records
  • Environmental Data Analysis
  • Geodatabase Design
  • Geospatial Analysis
  • GPS Data Collection
  • Hydraulic Modeling
  • Mobile Application Development
  • Municipal Asset Management
  • Online Mapping
  • Raster Analysis
  • Special District Mapping
  • Wetland Delineation

H2M is an ESRI Business Partner and was recognized with their ArcGIS Online Specialty designation for the continued deployment of successful online and mobile mapping solutions.

Contact:

Christopher M. Kobos, PMP
Director of GIS Services
H2M architects + engineers
538 Broad Hollow Road, 4th Floor East, Melville, NY 11747
tel 631.756.8000 x1731 | direct 631.392.5359 | mobile 516.946.9832 | fax 631.694.4122

Summer Reading: The Drones Are Amongst Us

Transformation geospatial technology is emerging as a “must have” in government GIS programs

Last month Governor Kathy Hochul announced the completion of the Skydome facility at the Griffiss Business and Technology Park in Rome, Oneida County. Located in a former airplane hangar, the indoor facility is the largest indoor drone test facility in the nation and a major investment in New York’s Unmanned Aircraft Systems (UAS) Test Site.  This investment adds to the already impressive UAS and high-tech ecosystem in the Empire State centered along the Syracuse-Rome corridorIts no news at this point that UAS are a transformation technology in the GIS and geospatial space with cutting-edge research and development going on right here in our backyard.  The Northeast UAS Airspace Integration Research Alliance (NUAIR) website provides a great example of this growing technology space which includes government, industry and academia.

The governor’s announcement made me go back looking for my notes on the Systems and Technologies for Remote Sensing Applications Through Unmanned Aerial Systems (STRATUS) 2022 Conference held May  23-25 at SUNY ESF which I wanted to participate in and attend, but the scheduling didn’t work out.   The 2022 show was the fifth STATUS conference which brought together more than 100 professionals from across the United States and Canada.  New York’s geospatial community, including those from a host of academic institutions and local and state governments, was well represented in the nine technical sessions which included both oral and poster presentations covering topics including mapping and surveying, agriculture and forestry, flood and water quality monitoring efforts, hardware and software, and flights and operations. Great homegrown UAS research work coming out of Cornell, Rochester Institute of Technology, SUNY Binghamton, Hobart and William Smith College, and SUNY ESF.   One of the keynote speakers was Ken Stewart, Chief Executive Officer of NUAIR who I interviewed as part of a 10 Questions column last fall.  The STRATUS 2022 program guide, including abstracts and presentations can be found here

And for those coming out of college or those looking for a mid-career change – its a great job market.   If not a great job skill to augment any current geospatial position.    Commerical UAV News reports the top five drone pilot industry markets (in order) include:  mapping and modeling, thermal imaging, real estate photography and videography, inspections, and movies and television.  Another publication predicts that by the year 2025, at least 100,000 jobs will be created for drone pilots. (btw – while putting together this article, came across an update on New York State drone laws and regulations as of July 21, 2022).

Seemingly now present in every significant geospatial data collection effort at all levels of accuracy and need, drone usage will grow exponentially throughout government in the years ahead.  As governments continue to remain concerned over drone liability, privacy, and cybersecurity issues,  industry and consulting firms will continue to provide the bulk of drone and UAS operations.  This may change slowly over time, but the near future work will be supported largely by the non-government workforce.  One exception to this will be in the public safety arena where government staff will continue to be aggressively trained and licensed internally.   

In other areas it will be most likely specific drone consulting firms or engineering companies will step-in and provide drone/UAS services.  Many engineering companies have already  positioned themselves well in supporting government geospatial projects by building GIS capacity and offering a wide range of services skillsets – both on the desktop and in the field.  And drones are a perfect fit as part of their surveying and mapping consulting work particularly for smaller to mid-size governments with limited or no technical staff.      These same engineering firms now offering full service GIS programs including the managing of online products such as ArcGIS Online to data warehousing.  Particularly advantageous to local governments as datasets get larger and larger as the televising of infrastructure systems (sanitary, storm, potable water, etc), above ground 3D modeling, building information models (BIM), and high resolution imagery continue to be captured and developed in municipal governments.  Continued advancements by the major software companies such as ESRI and AutoCAD, and their business partners,  on the integration of drone generated data such as lidar only extends the ease of use and accessibility of drone/UAS technology for government organizations.

And with high accuracy mapping and surveying being one of the most common applications of drone/UAS use, particularly in context of the quality of imagery captured and increasingly larger geographic footprints of data being collected, might it lead to  the discussion as to how the emerging drone/UAS technology augments larger publicly – funded efforts such as the USGS 3D Elevation Program (3DEP)?  While the 3DEP program covers much larger geographic areas and is plane-based, is there a way to add smaller project areas which are drone/UAS  based and meeting appropriate federal lidar specifications to public data warehouses and inventories such as the U.S. Federal Mapping Coordination website?  Expand the State elevation library to include locally collected data?  There is so much elevation data being collected across the state by so many sources.

Summary

Government GIS/geospatial practitioners will do well to follow and participate in technology specific conferences and associations such as those represented at STRATUS 2022.  Many of which are becoming more accessible by being available online.   Industry specific conferences in engineering, public works, public safety – even agriculture – now serve as an excellent source of specific applied geospatial technology tools.  And drone/UAS technology is a common thread among them all. 

Coming to a geospatial application close to you soon. 

Hard Copy Maps Still Rule: NYS Agricultural Districts

The art form is still alive as counties design and create maps as part of the Agricultural District Certification process

I’ve written about agriculture in New York State before in context of the farming community continuing to evolve with the adoption of geospatial technologies. With farmland covering nearly 20% of the state’s geographic footprint, its easy to see why geospatial tools are so increasingly important in managing the state’s prime agricultural lands.  And one does not need to look far to see the advancements of new geospatial technologies in New York State agriculture, particularly with the recent Systems and Technologies for Remote Sensing Sensing Applications Through Unmanned Aerial Systems (STRATUS) conference May 23-25, 2022 at SUNY ESF in Syracuse. Several papers and even dedicated tracks of papers and presentations focusing on UAV/drone technology in agriculture.

And it’s big business, too. A November 2021 article published by NY Business Agribusiness Column: Economic Impact of Agriculture in New York State stated that “agriculture in New York State contributed $43.6 billion in total industry output, 160,100 jobs and $12.3 billion in gross domestic product across the state economy.” It’s a rather amazing article with many more figures on how agriculture impacts the statewide economy, The article is based on the work and research of Todd Schmidt, an associate professor with the Charles H. Dyson School of Applied Economics Management at Cornell University.

Which makes it all the more interesting in 2022, even with the fledgling agritech applications and the almost complete conversion and automation of our mapping, cartography, and business/financial systems, the certification of agricultural districts in the state still involves the use of an iconic piece of mapping and cartography: The hardcopy map. Yes, while the digital data/products in producing the hardcopy maps are used and repurposed in many useful and productive ways across the state, it is still the hardcopy map which is used as part of the agriculture district certification process by NYS Department of Agriculture and Markets (AgMkts).

Background

Since 1971 , the Agricultural Districts Law, Article 25AA of the Agriculture and Markets Law (AML), as administered through (AgMkts), has reflected state and county level efforts to preserve, protect and encourage the development and improvement of agricultural land for the production of food, fiber and other agricultural products. As districts are created, or modified during renewal, maps are generated, based on tax parcels included in the districts. Each county is responsible for creating maps to meet the requirements of the Agricultural Districts Mapping Program. Supporting AgMkts in this regard is Cornell University’s Institute for Resource Information Sciences (IRIS) has helped facilitate the mapping program since 1977. Its primary responsibility is to support agricultural district mapping efforts by reviewing, distributing, and archiving agricultural district maps, and to provide consultation services. Automation of the statewide district maps began in earnest In 1996 when the entire set of NYS Agricultural District maps in the collection of Cornell IRIS (formally CLEARS) was converted to digital format. This was done by shipping blueprint copies of the maps to the NYS DEC for scanning.

Article 25AA references maps several times in Section 303 as a required deliverable for certification of a district. Specifically the text includes “The district review plan shall include a description of the district, including a map delineating the exterior boundaries of the district which shall conform to tax parcel boundaries”Agricultural districts across New York State are reviewed and certified on an eight-year cycle.

The Map

It’s a real treat anymore to show up at a meeting or discussion and be given the chance to review a traditional, well designed hard copy map. Increasingly becoming rarer and rarer. And just think how much less demand there would be for hardcopy maps if it wasn’t for the ubiquitous use and sharing of the PDF file format? For so many years, the 1:24,000 map was one of the most commonly used map design and layouts following in step with the classic U.S. Geological Survey 2000-scale quadrangle grid series. And yes, it just so happens the required base map standard for the agricultural district maps, as outlined in the Agiriculture Districts Program Mapping Checklist prepared by IRIS, is 1:24,000. According to Diane Ayers, who provides staff support to the mapping program, “IRIS recommends either the NYS DOT 7 ½ minute planimetric map series (available in either raster or vector format) as the base map for individual County mapping products.

The 32-page document consists of written requirements covering topics such as, but not limited to, map content including roads, civil boundaries, and water features, as well as traditional map items such as north arrows, keys and legends, scale bars, and the bounding geographic coordinate grid.  Documentation on the source of base map data, other data layers, year of parcel data, and geographic reference information (datum, projection, etc) is also recommended.   It also includes several pages of examples covering a wide range of other hardcopy cartographic principles including annotation, color selection, and symbology.  Many items which cartographers and map makers have greater flexibility in controlling when using desktop client software vs. web mapping cartographic tools. 

Appendix 1 in the Mapping Checklist document shows examples of how to render the district boundary as the most prominent feature on the map

While counties send all review materials associated with the eight-year review, including tax parcel information, directly to AgMkts, the county produced hardcopy map and shapefiles are sent directly to Ayers.   She reviews the maps for consistency with the mapping checklist and then forwards to AgMkts and uses the shapefiles to maintain a consistent a set of statewide district maps which are available via CUGIR.  The statewide coverage she maintains based on this relationship and data exchange with the counties can be found here.

The 2022 Ontario Agriculture District Map as produced by IRIS. Shapefiles and documentation received from counties enables IRIS to maintain a statewide agricultural district coverage.

Sheri Norton is the GIS Coordinator for Ontario County, located in the Finger Lakes region renown for viticulture and other agricultural products. She has been through three district reviews including a large countywide consolidation in 2021. “Agriculture District mapping is a big effort with partnership between our Planning, Real Property and GIS Program staff”, she says, “but with my previous experience in producing the mapping products for IRIS and becoming more comfortable with ArcGIS Pro, the map series and formal reports are now easily updated for the next review cycles.  The ArcGIS client is all I use.”   Which is quite an accomplishment, as keep in mind many final cartographic products are often “touched up” before final publication with other desktop publishing software such as Adobe Illustrator. The certification also includes generating a list of all tax parcels in the district(s) based on the county assessment roll.

Sheri Norton’s 2021 Ontario County Agriculture District One map designed and produced entirely with desktop GIS software.  This same map was provided to AgMkts as part of the review and certification process

Summary

Hard copy maps are as close to GIS comfort food as we can get.   And here in New York is refreshing to see how this important piece of our cartography past is still being used in a government regulatory program.  Holding its own against all of the advancements – and acceptance of digital web mapping.  Kudos to GIS professionals across the state who are still producing hardcopy maps and helping the product remain relevant as part of the profession.

Agricultural Districts protect and promote the availability of land for farming purposes.  For informative overview of this important Empire State Program review this presentation.

Contact

Diane Ayers
Data Manager and Educator
NYS Agricultural Districts Mapping Program
Cornell IRIS
1015 Bradfield Hall
Ithaca, NY 14853
dag10@cornell.edu

Sheri Norton 
GIS Coordinator, GISP
Geographic Information Systems Program
Ontario County Information Technology Department
70 Ontario Street
Canandaigua, NY 14424
Sheri.Norton@ontariocountyny.gov

Jeff Kehoe 
Farmland Protection Specialist
Department of Agriculture and Markets | Division of Land and Water Resources
10B Airline Drive
Albany, New York 12235
jeffrey.kehoe@agriculture.ny.gov

Empire State GIS/Mapping DIYer Phenom: Andy Arthur

Self-taught hobbyist has a treasure chest of geospatial content on website

One of the benefits of writing about all-things geospatial in Empire State is sometimes I just don’t know what I’ll come across.  Looking for this thing and finding that.   Starting in earnest on an article about a certain GIS channel and a couple days later finding myself having completely jumped the rails and find myself way over there writing about Channel Z.  (Yup, that static in the attic).  Or ending up on a cool or fun website not really knowing how I got there.

Case in point:  Interactive Maps by Andy Arthur.  Empire State mapping DIYer extraordinaire.  Just a hobby.

When I first stumbled onto the site and having spent some time driving around, I realized I needed to find out who was behind it all.  It definitely isn’t the kind and feel of the traditional geospatial website I normally include or reference in my blog, but enough interesting – and yes, quite different – content to dig a little deeper.  And glad I did.  This is not a blog post to focus on a particular topic or concept, but rather just more of a pointer to the URL and let you take away from the website what you want.  

It turns out the person behind all of this is Andy Arthur, who by day, is Deputy Director of Research Services in the NYS Assembly.   “I have no formal GIS training, as things were still pretty primitive back when I was in college (SUNY Plattsburgh)  in the early 2000s especially when it came to web services, online data and open source software” says Arthur, “computers were a lot less powerful back then. I remember vaguely hearing a bit about Remote Sensing when I was involved in the Environmental Science Club in college, but it wasn’t something I ever used.

Since then and working on his own, Arthur picked up QGIS (and the accompanying PyQGIS developer tools), as he was looking for a way to make his own topographic maps because he wasn’t happy with what was available on  the Internet. He later found out he could FOIL a primative campsite shapefile from NYS DEC and get data from there to help find campsites. “I was pretty good at map and compass stuff from my years in Boy Scouts and always interested in environmental and land use issues”, he says.  Over time, he branched out into other geospatial areas including web services.  More recently He’s been focusing on more automation of processes, using Python and R statistical language to do some map plotting and a lot of Census data gathering and processing. “I like working with R as it is fast and easy to implement code in. I’ve also lately been doing a lot more with Leaflet and web services”.  Along the way he continues to use GeoPandas and Leaflet for map making. (btw as I was putting this blog piece together I found out the creator of Leaflet 11 yeas ago was  Volodymyr Agafonkin, a Ukrainian citizen who at the time was living in Kyiv.)  Content on the site is also made available in KMZ for use in Google Earth.

This is a example of how Arthur processed LIDAR data covering the Rome Sand Dunes west of the City of Rome in Oneida County. The landscape ifs a mosaic of sand dunes rising about 50 feet above low peat bogs which lie between the dunes. Processed LIDAR data renders the dunes very clearly. Arthur created this originally by writing a QGIS plugin that queries a shapefile with the LIDAR Digital Terrain Model Bare-Earthindex, then downloads the geotiffs, and finally joining them together to create the hillshade.The plugin itself is in Python and runs in QGIS, while the lidar download/processing script is in php-cli shell script.

The best place to start navigating the website is to open the table of contents link located in the upper right corner of the landing page. The table of contents page then provides additional links products and visuals Andy has created including aerial photos, charts, interactive maps (recommend starting here), and thematic maps to name just a few.   This page also provides more detail on open source components, some specifics on the use of Python and Pandas, a downloadable CSV file listing of web services (WMS, ArcGIS services, etc) used on the blog, and much more.  It’s worth noting that the website also includes non-GIS/geospatial content.

If you need some additional evidence of how much Arther has picked-up on programming, using open source components, and navigating the geospatial landscape in this space,  check out his tutorial on how to create a  Digital Surface Model GeoTIFF Using National Map Downloader, LiDAR Point Clouds and PDAL.  By example, the DSM image above is from a section of the Albany Pine Bush.  For a larger montage of the Albany Pine Bush digital surface model and samples of his code, click here for downloads.

And of course, the old stand-by hardcopy product. Here, a recently created thematic map of the City of Albany median year of housing construction map. He used the NYS Tax Parcel Centroid Points data aggregated down to the parcel level using R code and created a GeoPackage. Which was then used to create the map in QGIS. Additional layers were added for context.

There are many many more examples of geospatial products, maps, and viewers on the website.  Its a great example of how much can come out of the other end when diving into and applying geospatial tools to one’s own personal interests and way of living. 

When you have a few minutes over lunch or a cup of coffee, take a look at his site.  In communicating with Andy over the course of putting this piece together, he would be open to talking with and assisting non-profit or similar community groups on specific GIS/mapping projects.  His contact information is below. 

Contact:

Andy Arthur
www.andyarthur.org
andy@andyarthur.org

10 Questions: Neil Curri

Geospatial technologies are found in so many organizations and on so many levels.
What once was a fledging technology based on desktop client software now
encompasses web technology, mobile and handhelds, increasingly the engineering
software toolbox, and hordes of geospatial data of all types and quality. And yes, the
ageless desktop clients lives on. It’s not often to find someone who is able to navigate
the many pieces of the technology for multiple organizations.

Neil Curri, who lives in the mid-Hudson River Valley community of Lloyd, is involved in a
wide range of geospatial efforts encompassing a diverse number of organizations over
the past several years. While technically currently employed by Partridge Venture
Engineering, Neil also serves as a GIS Academic Computing Consultant at Vassar
College in Poughkeepsie and has served in local government geospatial efforts as well
as the Dutchess County Cornell Cooperative Extension.  We recently communicated to discuss his past and current GIS contributions to the profession.

eSpatiallyNewYork: Let’s go back to the beginning – when and how did you get started
with geospatial technology?

Curri: After working in IT for a few years after college, I decided to go back to school to
refocus my career on something in the environmental field. GIS seemed a logical fit. I
found an Environmental Science M.S. program that also offered a GIS certificate at the
University of New Haven. The summer before I went back to school, I got a hold of a
copy of ArcView 3.2 and made a couple of maps and a website for a local watershed
group. The environmental applications were obvious.

eSpatiallyNewYork: In your capacity at Partridge Venture Engineering (PVE), what kind
of GIS applications or tools do you use?

Curri: Mostly ArcGIS Pro (and ArcMap for legacy projects – still transitioning…), some
GPS, and some limited drone work. We’ve used ArcGIS Online for a handful of projects
where a web mapping application was an appropriate deliverable for the project and
client. I’ve had to build a couple of small databases to organize environmental data
streamlined for mapping. My position is within the company’s Environmental division,
and there’s a need for map figures in every phase of a project – most of our work is site investigation and remediation. Mapping-grade GPS provides enough accuracy for ourpurposes, but we do use differential GPS and post-processing to get the best accuracy we can with our hardware. We’ll collect drone photos when existing aerials are
insufficient or outdated. I’ll either georeference them for any site figures we need, or
occasionally I’ll set up a flight plan and use drone mapping software to get a composite
aerial of a large area or use the 3D capability to estimate soil stockpile volumes or
excavation pit volumes.

eSpatiallyNewYork: You are the GIS Lab Manager at Vassar College. What does this
involve and some of your duties

Curri: My official title at Vassar is GIS Academic Computing Consultant. Duties include
mainly instructional support – advising faculty, staff, and students interested or engaged
in using GIS for teaching and research. For example, students in a Geomorphology
course were recently working on a GIS lab exercise that involves mapping changes in
glacial lake levels and creating an elevation profile to get channel dimensions and
calculate flow volume. This lab is one of several exercises for the course that were
originally written for ArcMap, which I migrated to ArcGIS Pro. I also work with the
college’s IT department staff to maintain GIS hardware, software, and licensing. CIS are
technically the “lab managers”, but we work together to keep things running and provide
capacity as GIS use grows on campus. With an enrollment of about 2,400 students,
Vassar is a small college. But GIS use is reaching the point where I think the
administration will expand licensing campus-wide for the next academic year, which will
significantly reduce the time I spend managing ArcGIS Online accounts.

eSpatiallyNewYork: Any particular area students seem to be most interested in in
applying GIS technology and concepts?

Curri: While the two core GIS courses – Cartography and Spatial Analysis (I
occasionally adjunct instruct either of these) – are taught out of the Geography and
Earth Science department, many students who take the course are Urban Studies
majors, who are very interested in social justice issues. But there are also many
Environmental Studies students who take the courses, and they tend to be interested in
ecological research and conservation. Neither of these courses (nor both of them
together) necessarily prepare students for a career in GIS, but students who take these
courses are sought after by faculty and staff for research and other projects (like the
Poughkeepsie Natural Resource Inventory or research projects at the Collins Field
Station on Vassar Farm) and they are more likely the ones who will pursue GIS as a
career and/or go on to graduate school to study GIS or a GIS-related field.

eSpatiallyNewYork: Tell us something about Vassar GIS students/grads,
YouthMappers, and Society for Conversation GIS

Curri: Hudson Valley Mappers is the Vassar-based chapter of YouthMappers, an
international organization supported by USAID. Two former students, one of whom now
works for USAID supporting YouthMappers, began the chapter in the Fall of 2018.
Students involved in HV Mappers are passionate about using GIS as a resource for
communities, both locally and around the world. The group coordinates local community
mapping events, usually involving some field data collection and partnering with one or
more local organizations, as well as organizing mapathons in which students participate
in Humanitarian OpenStreetMap Team (HOT) mapping projects

eSpatiallyNewYork: What was your geospatial roll and contribution with the City of
Poughkeepsie Natural Resource Inventory?

Curri: I mentored several student workers who assembled the maps created for the
report and online content and I ended up editing some sections of the report with Jen
Rubbo, Director of the Environmental, who led the project. Part of the it involved
inventorying and inspecting Ash trees for impacts by Emerald Ash Borer. I worked with
students and staff using previous tree inventory data by the City’s Shade Tree
Commission as the starting point, set up an ArcGIS Collector project for the field data
collection, and helped organize the information into a public-facing web map. That data
was used by the City to identify trees that presented a potential hazard and remove
them. There’s a short video describing that part of the project on the City’s website.

eSpatiallyNewYork: You worked at Dutchess County Cornell Cooperative Extension
between 2007-2015. What is your involvement there today?

Curri: I was recently asked to serve on an advisory committee for Dutchess County Cornell Cooperative Extension’s pending update of the County’s Natural Resource
Inventory. I worked on the last revision several years ago while at CCEDC, which was
an update of the previous version conducted in 1985 by the County’s Environmental
Management Council. A former intern and a volunteer I mentored there both went on to
graduate school and made careers for themselves in GIS – one is now with the NYS
GIS Program Office and the other is on staff at CCEDC.

eSpatiallyNewYork: You currently serve as Chair of the Town of Lloyd Environmental
Conservation Committee. What’s your sense of the understanding and acceptance of
GIS concepts by citizen and community groups at this level in the Hudson River Valley?

Curri: Though I may not be totally sure, but I think most citizen and community groups
in the Hudson Valley – at least any that have an interest in environmental conservation,
planning, or community development, or anyone volunteering for a town committee or
board – have some sense of what GIS is and that it has value. But there is a lack of
capacity available to citizen and community groups, and consultants like me cost
money, and budgets are limited, so I think exposure to GIS and understanding how it is
or could be useful to them is still limited. Lloyd is one of few towns in the Hudson Valley
with some in-house capability, which predates my involvement.

eSpatiallyNewYork: Some of your community outreach work and involvement has led
to having the DEC Hudson River Estuary Program support an intern on one of their
funded projects. Tell us about how that developed.

Curri: A former student should get some credit for this. While we were finishing up the
Poughkeepsie NRI, she was taking the web mapping class, which is a half-semester
class taught occasionally taught by Prof. Mary Ann Cunningham. Mary Ann connected
her with us, and for her class project the student published the NRI layers to ArcGIS
Online and assembled them in nested web apps to combine functionality. Volunteers
working on NRI’s in two other Hudson Valley towns, Union Vale and Gardiner, saw the
Poughkeepsie online map and wanted one of their own. Interested interns came forwardand used the Poughkeepsie NRI map as a template to assemble those. Based on thesuccess of these, the DEC Hudson River Estuary Program then contacted me to inquireabout assembling maps for the Town of Gardiner’s Community Preservation Plan
(CPP). We found an interested student but it ended up being more simple for PVE to
assume the contract and hire the student. He and I are working on this project now.

eSpatiallyNewYork: What’s been your involvement in statewide GIS activities?

Curri: I’ve been a member of the NYS GIS Association for a few years, but not very
active.I used to attend NEARC regularly before my partner and I started a family five years ago. About two or three years ago, some folks from a few land trusts in the
Hudson Valley started up a local chapter of the Society for Conservation GIS. I have
missed only one or two of these meetings since then. It’s a great group of people and I’dlike to be more involved – after this semester is over!

eSpatiallyNewYork: Have a particular GIS project you worked on or produced that
would like to highlight or brag about just a bit?

I think I’ve already done some of that here, but I’ll mention getting to work with Vassar
Professor Emeritus Dan Peck on the maps for his book, Thomas Cole’s Refrain.

There’s some work for litigation projects at PVE I’d like to highlight but not permitted top
do so. Most of my projects I don’t really consider “produced” by me, as I am often
working with a subject matter expert, a geologist, a professor, or enthusiastic student, a
client, or community partner who’s more or less guiding the project, and I’m just figuring
out what geospatial product or tool fits their needs.

Contact:

Neil Curri, GISP
GIS Analyst, PVE, LLC
Vassar College Academic Computing Consultant
necurri@vassar.edu | 845-437-7708 | 845-664-2100 (mobile)

The American Recovery Plan Act (ARPA) of 2021: Where’s the GeoBeef?

There's lots of money out there. But few in the GIS community seem to be talking about it

During the waning months of my service with Westchester County last fall, I began to see references and documentation connecting geospatial technology to Coronavirus State and Local Fiscal Recovery Funds (SLFRF) program which was enabled as part of the American Rescue Plan Act (ARPA) passed earlier in 2021.  Earmarked monies for each government in New York State.  This was followed by passage of the Infrastructure Investment and Jobs Act (IIJA) passed in November 2021.   In general, SLFRF funding is more directed to local governments and IIJA funding being more focused on state government appropriations.  The progams certainly haven’t gone unnoticed by GIS software companies such as ESRI and Cartegraph which have published documentation outlining how specific categories of ARPA funding  can be used to support local government geospatial activities.  Even Autodesk, the AutoCAD giant, has recognized the relevance and importance of these landmark funding programs.

Empire State organizations such as the New York State Association of Towns (NYTOWNS), New York State Association of Counties (NYSAC) and the New York State Conference of Mayors and Municipal Officials (NYCOM) which represent the many levels of local governments across the state are also busy tracking funding allocations and keeping their own scorecards.  For example there is NYCOM’s Municipal ARPA Plans and Programs inventory, NYTOWNS procurement guide, and NYSAC’s county-level breakdown of funding   And there’s more.  The U.S Treasury Department’s Allocation for Metropolitan Cities  or the Brookings Local Government ARPA Investment Tracker.  Your county or municipality may have yet to make the connection to these geospatial opportunities.  

The Brookings ARPA Investment Tracker is one of several sites monitoring the use of grant funds. Erie County’s use of the funding is highlighted here with 92% of the funding being used for infrastructure purposes. Other New York State government interim reports can be found here.

But even with all of this publicly available information, and aggressive marketing by the vendor community, there seems to be a limited amount discussion about how these major federal grant funding programs can be woven into local geospatial initiatives.  And this is unfortunate because its very clear there ARE local activities which are “ARPA eligible” in the areas such infrastructure management, economic development, health and human services delivery, housing, transportation and community revitalization to name only a few.  So who is leading the statewide local government ARPA geospatial discussion?

Diving a little deeper, I took out attempting to survey the statewide local government geospatial community on the ARPA and IIJA programs by issuing a simple survey via the NYS GIS listserv, as well as having a link put on the NYS GIS Assocation’s website (thank you, Association webmasters).  Perhaps I would have gotten a better response to the survey offering links to both of the funding programs, but instead, wanted to capture the respondent’s immediate understanding/awareness of the programs when opening the survey.  Providing links to the programs would have defeated the purpose of the survey.   And I made it clear the survey was only for New York State local government users and/or their contractors.    That takes a lot of potential respondents off the table via the listserv and with local government representation in the Association hovering around less than 25% of the total membership, I wasn’t sure what the response would be.  Though not included in the images below, I emailed a handful of former county colleagues separately ahead of the online survey which resulted in very similar results.

The results can hardly be considered a statistically representative sample of the statewide local government GIS user community.  I received only 20 responses of which 18 provided usable data.   As such, I would submit the following pie charts can be considered illustrative or reflectiveof the current overall awareness, if not understanding, of the current ARPA funding programs.  While only a third of the respondents indicated they were even aware of the ARPA program (first pie chart),  there was barely any understanding of the funding as it relates to geospatial (second pie chart) and only one of the respondents indicated he/she had been involved in any discussions regarding the use of ARPA funding (third pie chart) in their organization.   Though to some degree many GIS practitioners across the state often hold down technical positions in department-line staff positions which are normally far removed from the grant funds discussions being held in much higher administrative offices.

Unfortunately, as historically been the case, the top level NYS government associations noted above have rarely made GIS/geospatial a visible and outward facing part of their agenda.  Even today, Its hard to find anything really meaningful for the local government GIS community when using keyword searchs such as  “GIS, geospatial, or mapping” on any of their websites.  And its highly doubtful there will be, or can be, any real meaningful advocacy through any state program offices as this political or elected official outreach framework doesn’t even exist on behalf of local government GIS programs.    As the next generation of local government GIS/geospatial programs evolve, particularly in the urban environments where the focus will be more on the public infrastructure, utilities, sustainability and climate change impacts, large scale and high resolution mapping and surveying – the collective internet of things (IoT) – discussions and geospatial strategies with most state government offices in this space will  become more distant.    Geospatial programs for different levels of government in New York State evolving in completely different directions.   Albeit for sure New York City is on a different level when is comes to infrastructure and underground mapping, but it’s Underground Infrastructure Project concept does represent an important direction of the next generation of local government GIS programs in urban areas across the state.  It’s just a matter of degree.

The list below, from an ESRI publication and is available on numerous websites, highlights the local government programs in play.  No, not necessarily direct funding to your GIS office, but does serve as a roadmap of who GIS practioners should be talking with at the local level.  EcoDev, public health, infrastructure and public works, and cooperative efforts with utilities.  And then find out who is administering your government’s ARPA funding.    You can be assured someone or some agency has dibs on the funding.  And apparently the GIS programs are only visible in the rearview mirrow. 

The four major ARPA funding program areas include:

1.  Support public health expenditures, by, for example, funding COVID-19 mitigation efforts, medical expenses, behavioral healthcare, and certain public health and safety staff
2.  Address negative economic impacts caused by the public health emergency, including economic harms to workers, households, small businesses, impacted industries, and the public sector
3.  Replace lost public sector revenue, using this funding to provide government services to the extent of the reduction in revenue experienced due to the pandemic

4.  Invest in water, sewer, and broadband infrastructure, making necessary investments to improve access to clean drinking water, support vital wastewater and stormwater infrastructure, and to expand access to broadband internet

Within these overall categories, recipients have broad flexibility to decide how best to use this funding to meet the needs of their communities

While actually securing funding is much easier said than done, often requiring great grant and proposal writing skills as well as involving many individual offices and agendas in the organization.  But the almost complete lack of even a discussion by the statewide local government GIS/geospatial community to date seems amiss.

There are so few funding opportunities such as these 2021 federal grant programs to take advantage of.  These are generational programs.  Right now the onus of finding representation and advocacy for local government GIS funding in the federal grants arena falls squarely on local government GIS leaders and their representatives.  As well as local GIS practitioners.

Right now, though, the silence is deafening.

Geospatial Student Spotlight: Matthew Ward

Academic Institution:

Hunter College                                                          New York City
Department of Geography and Environmental Science
M.S. Geoinformatics (June 2021)

Virginia Tech                                                             Blacksburg, VA
School of Public and International Affairs
B.S. Environmental Policy and Planning   (May 2010)

Research Focus:

Ward’s graduate research at Hunter College focuses on the expanding use of Augmented Reality (AR) in the geospatial disciplines  with a  particular  interest  in  supporting civic  and public engagment.   AR is an interactive experience of the real-world environment where the objects that reside in the real world are enhanced by computer-generated content and perceptual information.   His research inspired by spatial AR research and development work at companies such as Google and  ESRI.

Ward’s work was recently highlighted and included  in the 2022 NYC OpenData  Week which included  augmenting street level imagery with the NYC PLUTO database which offers over 70 data variables at the tax parcel level.  Built on the WebXR standard, the web app leverages the THREE.js graphics library with files and front-end hosted on Github and the data on a Heroku  Postgres cloud platform.  The code repository and web app is available on Github. A short demo of the application can be seen here.

Cubes represent PLUTO centroids along the street face.   The magenta cube is the one currently selected by the user and provides current PLUTO information of the selected parcel in the upper left hand corner of the screen.  Cyan cubes represent other available PLUTO centroids for query. 

Ward’s smart phone app is now available (iOS and Android) here for entire NYC footprint.    Additional documentation and instructions are available on his GitHub repository 

Selected Additional Geospatial Projects

Gerrymandering Web Map

Ward performed a series of analyses on the proposed plans by the New York State Independent Redistricting Commission (NYRIC) based on data related to the 2020 census.  Because the Commission couldn’t agree on a single draft plan, the bipartisan members drafted two plans.  Two of the analyses are shown below (References to the “Names” (Republican)”vs “Addresses” (Democrat) Plans are from the New York State Senate District plans submitted by the NYIRC.

The image above (from a web map) is a test of “roundness” (aka the Roeck test [1961]).   In general, rounder districts will have a higher Roeck score and oddly shaped or districts that are wider or longer (darker shaped districts) will receive lower scores. Although not a perfect assessment of gerrymandering, the Roeck test offers good comparison between district shapes. 

Another test done by Ward was comparing the average voter party tilt of a district to its neighboring districts (darker purple districts are more unlike their neighbors).  Metro NYC shows what could be considered large areas of voter homogeneity.

An map of an additional analysis is included with Ward’s paper (available here) summarizing this research work and findings.  The third review looked at identifying those proposed senate districts which had at least 30% minority group population (African-American, Asian, and Hispanic/Latino populations were used). Such districts are almost entirely located in New York City, with some inclusion of parts of Nassau county.  The research paper includes a comprehensive list of all data used in the gerrymandering analysis. A “live”  interactive version of the web mapping app can be accessed here.  The three different analysis for each plan (Names and Letters) can be viewed by clicking the layers button in the upper right hand corner of the viewing window.  (Designed for desktop viewers not smartphones.)

 Crime Modeling Across NYC

Ward’s graduate coursework also included developing a crime view modeling viewer (below) based on NYC OpenData reported crimes for 2019. Selected violent crime types were analyzed.  He developed an even square grid to cover the citywide footprint so as to render the spatio-temporal nature of the data.   Crimes that occur are tracked in space and time within those squares.  Data is associated with corresponding police precinct building addresses (how the data is made available through OpenData – not necessarily the exact crime location).

The data is for all of 2019 but each day of the model (365 days total) is rendering the three weeks of crime leading up to that day to predict ‘likelihood’ of crime going forward. Darker purple is an application “indicator” of where more violent crimes may occur based on the historical data.  Yellow grids meaning less likely than purple.  No color means no spatio-temporal connections in crimes or no crimes.  Click here to run the video.

Summary:

The Hunter College Masters in Geoinformatics (MSGEOi) focuses on the growing demand for emerging professionals  trained in the collection, organization, analysis, and dissemination of geospatial data.  Matthew Ward’s graduate work is illustrative of this as it intersects developing analytical methods and visualizations of large geospatial datasets. 

After school, Ward is interested in applying his work and research in the public or government space.  “I see the great power of combining open source technologies and open data portals for empowering local users with AR technology, he notes.  “For example, there are so many types of uses in helping the public visualize utilities and the public infrastructure or in environmental applications.”  

Augmented reality is no doubt a rapidly expanding and growing technology in the geospatial arena.

Contact:

Matthew Ward
Graduate Student
Hunter College, City University of New York (CUNY)
Department of Geography and Environmental Science
MATTHEW.WARD14@myhunter.cuny.edu

Dr. Sean Ahearn
Professor & Director, Center for Advanced Research of Spatial Information (CARSI)
Department of Geography and Environmental Science
sahearn@hunter.cuny.edu