Among the brownstones and sycamore trees on Carroll Street in Brooklyn, New York is the office of HabitatMap. Founded in 2007, HabitatMap is an established metro-New York City non-profit environmental health justice organization whose goal is to raise awareness about the impact the environment has on human health.
HabitatMap was created as a nonprofit by activists focusing on the impact of hazardous facilities and sites on the well-being of residents in areas adjacent Newtown Creek in Brooklyn. Today, HabitatMap’s products and services, including online mapping and social networking platforms, provide a framework for hundreds of community groups across the country to maximize the impact of community voices on government and industry, as well as strengthening ties between organizations and activists. The Founder and Executive Director of HabitatMap is Michael Heimbinder.
Utilizing Habitat’s shared advocacy and mapping platform individual and organizations can:
- Alert the public to environmental health hazards
- Hold polluters accountable for their environmental impacts
- Highlight urban infrastructures that promote healthy living
- Identify future opportunities for sustainable urban development
- Promote policies that enhance equitable access to urban resources
Just a small sample of community-based organizations in the metropolitan area which use HabitatMap includes the Upper West Side Streets Renaissance , Organization of Waterfront Neighborhoods, Sustainable South Bronx, Neighbors Allied for Good Growth, Brooklyn Compost Collective, the Bronx River Alliance, and the United Puerto Rican Organization of Sunset Park. The HabitatMap website is accessed and used worldwide.
Similar to other smaller organizations with limited infrastructure and technical staff, HabitatMap integrates Google Maps to support it’s map viewer as well as a customized toolkit to edit and add “markers”. Google products are also used as a means to publish content from their AirCasting platform.
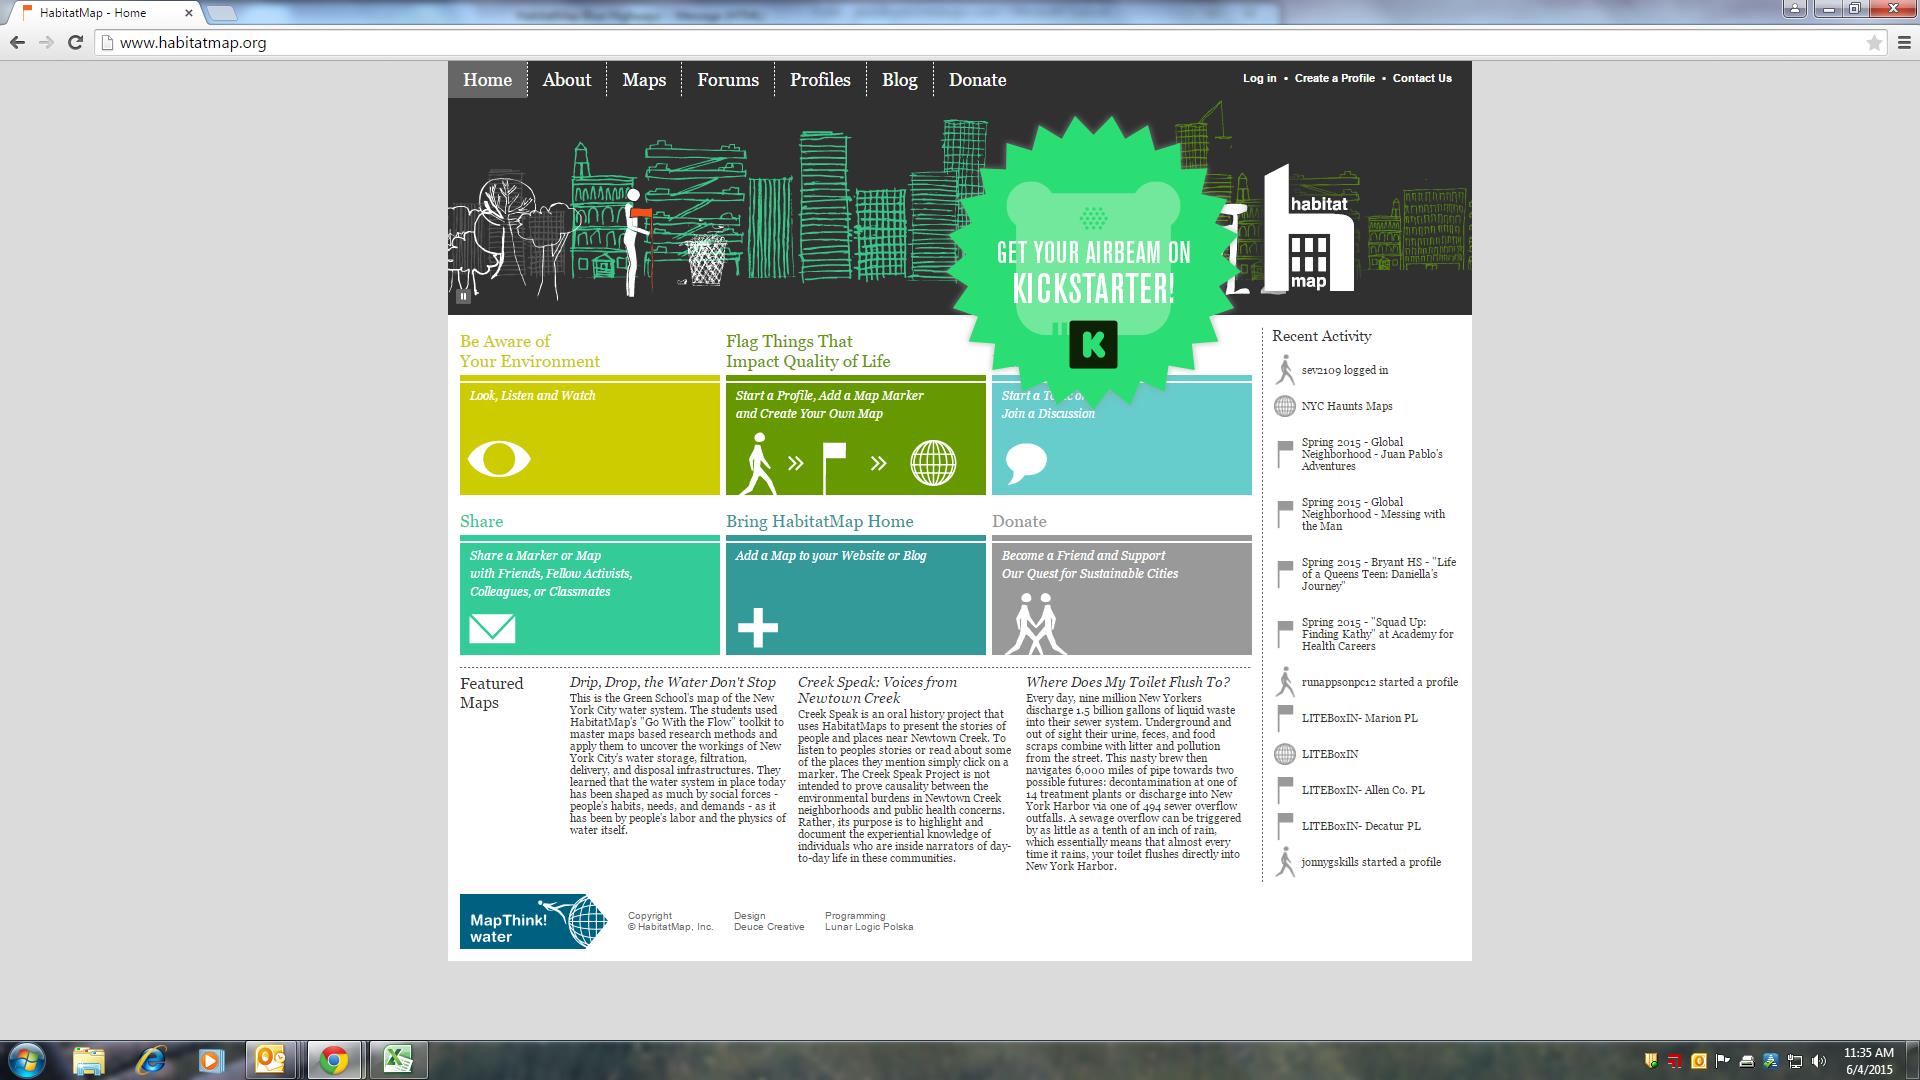
The HabitatMap homepage at http://www.habitatmap.org
HabitatMap Interactive Website
Once a personal profile is created, participants can start making maps on HabitatMap.org, mapping (aka “Add a Marker“) items of interest either by geocoding or clicking on a specific location on the map viewer – which is based on Google Maps. For example, I quickly created an account and mapped the location of a community facility in my hometown which is in need of minor repairs and perhaps retrofitted to provide space for community groups in a section of our town with limited such facilities. As tags are associated with each marker location, users can search the HabitatMap database for specific projects or areas of interest by using keywords such as water quality, recycling, fracking, community gardens, or greenways. Keyword matches are then rendered on the viewing screen.
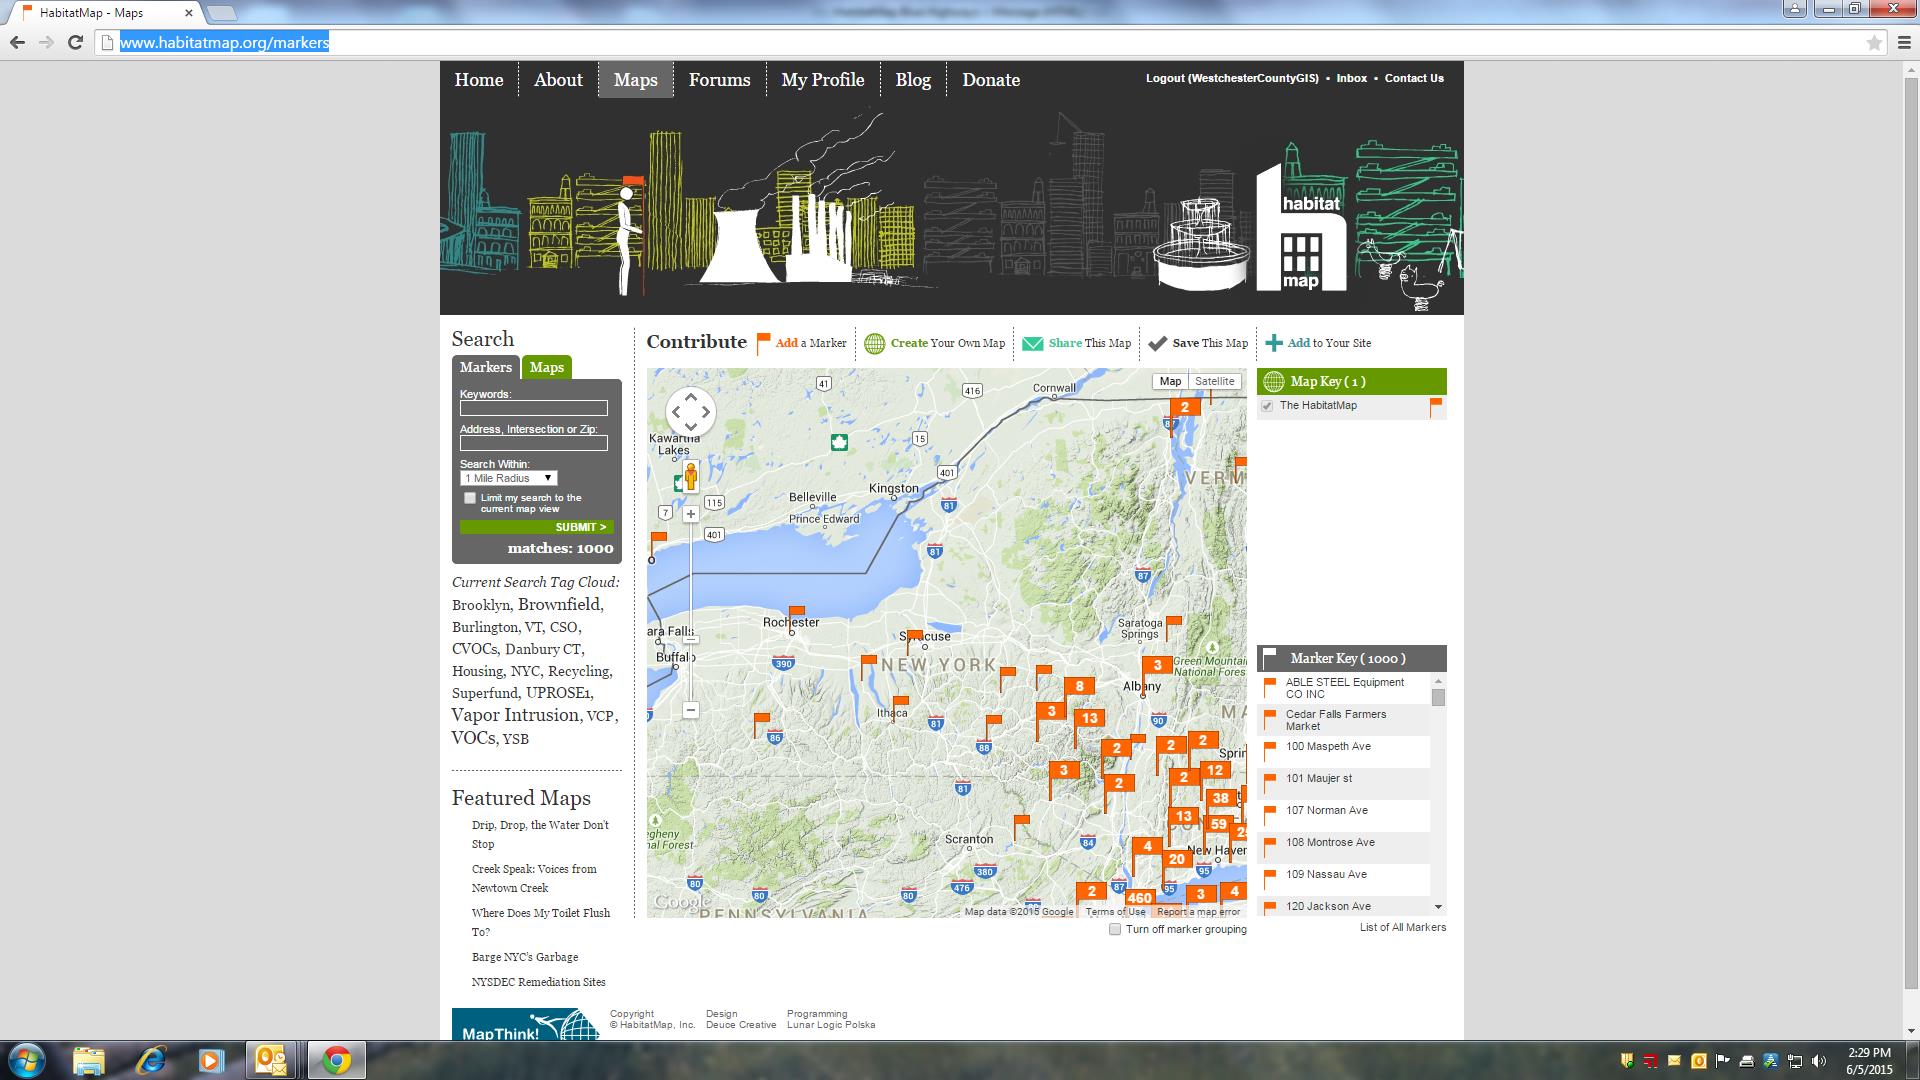
Community groups and individuals across New York State, particularly in the NYC metropolitan region, contribute to the HabitatMap by adding “markers” to identify a wide range of community-based issues and projects.
The Forums tab enables registered participants to start a discussion among other like-minded HabitatMap participants in categories such as Community Health, Water & Air Quality, Energy, Transportation, and Mapping. Participants click on the forum category that best matches their intended topic of conversation and click “Post New Topic”. The Blog tab is largely dedicated to the HabitatMap funded and developed Airbeam monitor which measures fine particulate matter (PM2.5), temperature, and relative humidity Being used by community groups and activists across the country, the AirBeam connects to the AirCasting smartphone app via Bluetooth to map, graph, and crowdsource exposure to fine particulate matter in real time.
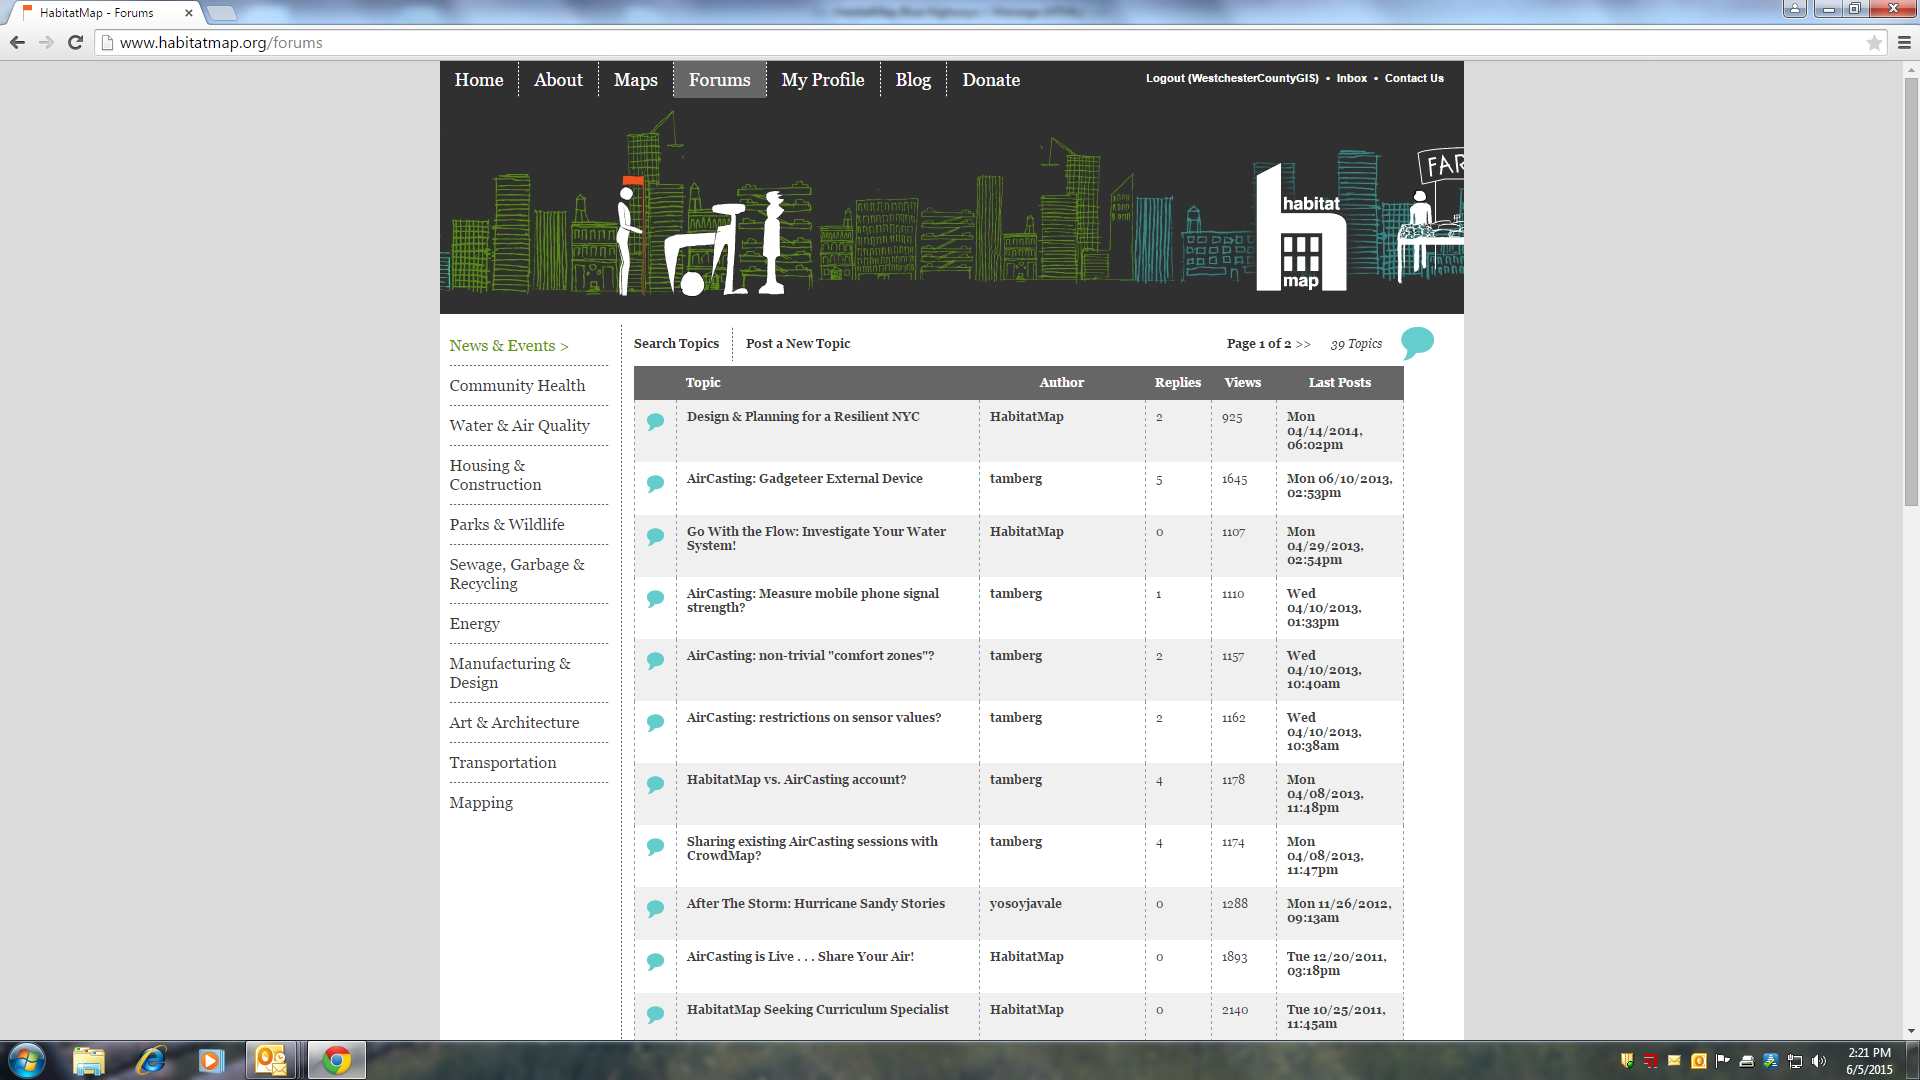
The Forums page enables participants to contribute and engage in dialog with others in topical areas such as Community Health, Mapping, Water and Air Quality, and much more.
An excellent example of HabitatMap’s primary online mapping product can be seen as part of the Creek Speak map which provides access to stories of people and places near Newtown Creek. In addition to mapping the locations of local issues and events, the HabitatMap interactive map enables users to also include and associate URLs, graphics, and similar files with each mapped location. Similar to other community organizations which partner with HabitatMap, the Creek Speak Project map’s purpose is to highlight and document the knowledge of individuals who are “inside narrators” of day-to-day life in the Newtown Creek community.
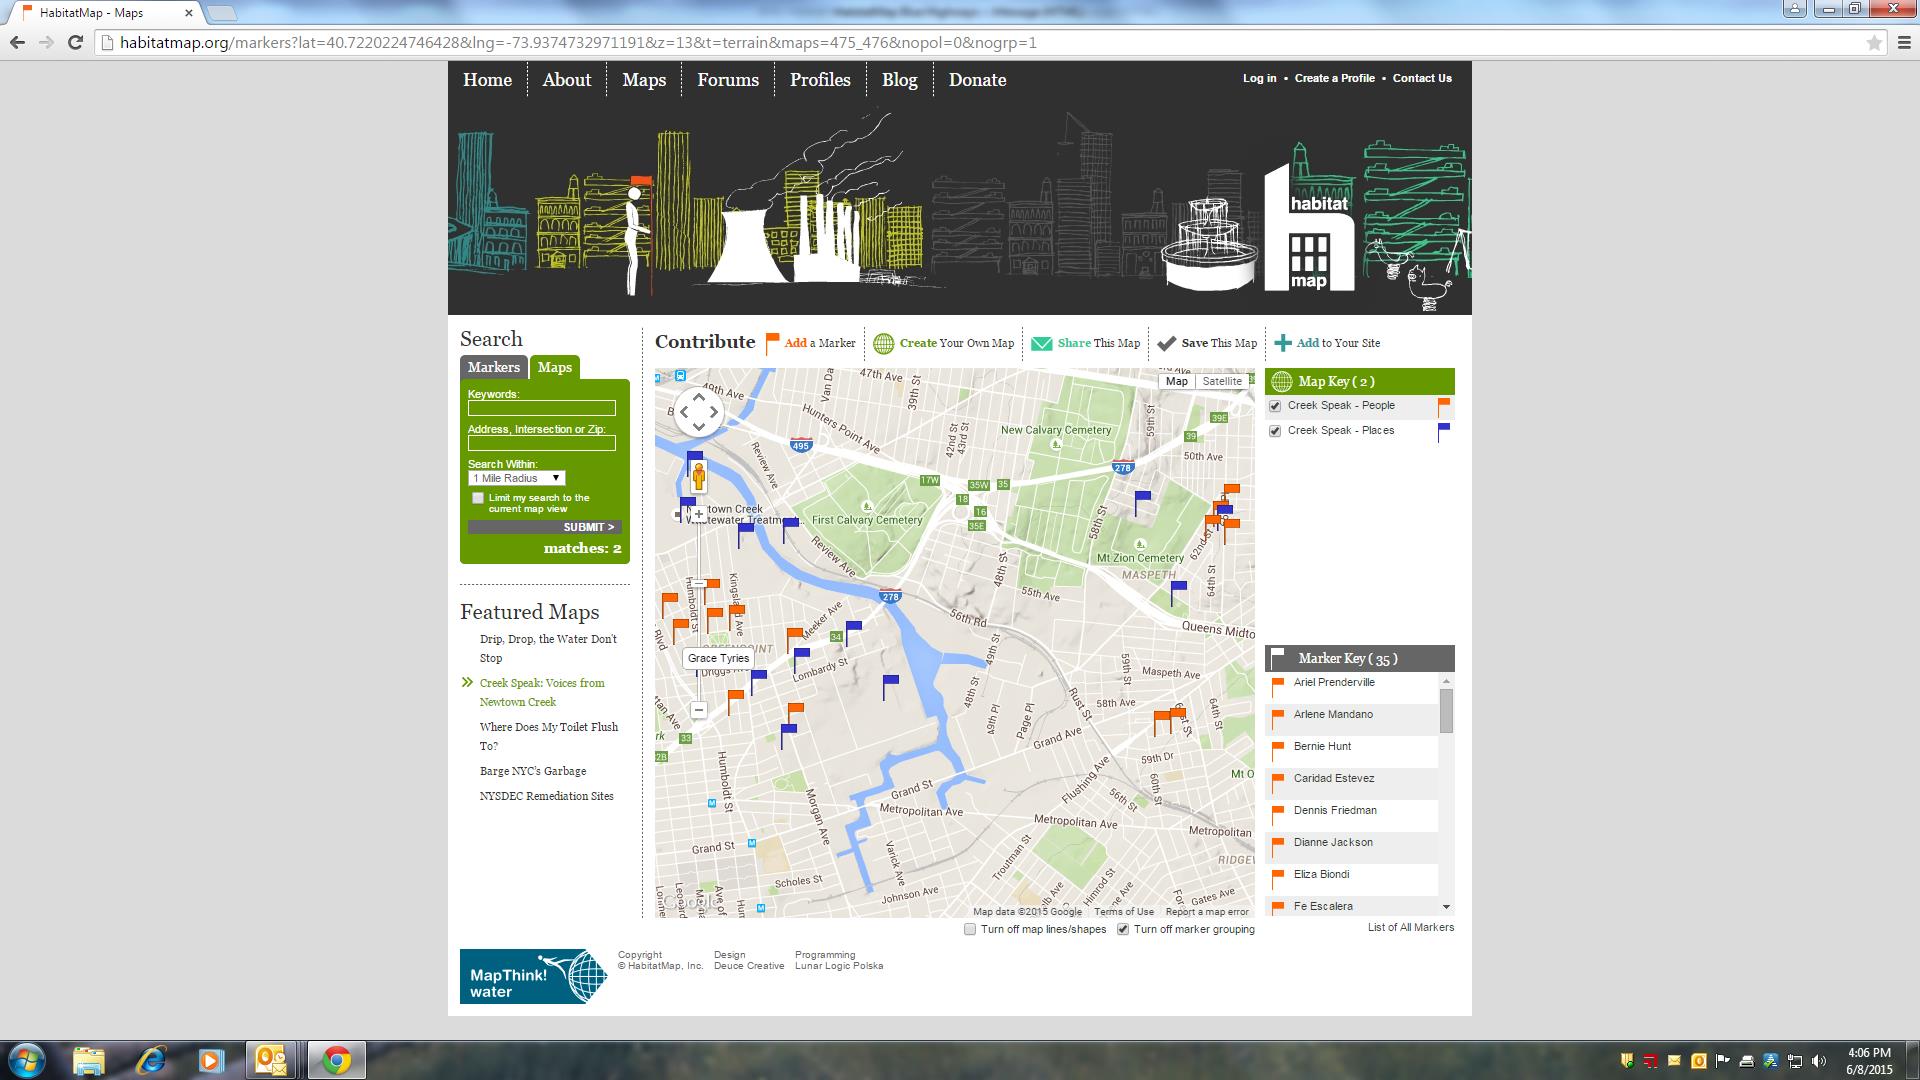
Founded in the Newtown Creek areas of Brooklyn, New York, there have been many contributions to the online HabitatMap from individuals and organizations located nearby.
.Other groups use the HabitatMap interactive map to identify locations in their community that either enhances the quality of life such as parks, scenic vistas, farmers markets, civic programs, or public parks, or those might cause for concern, such as a graffiti, unsafe properties, traffic/pedestrian issues, or illegal dumping or discharges. Users can also create individual maps highlighting a specific area of interest, embed maps on a personal or agency website or blog, invite fellow activists to contribute to maps, and discuss issues and recruit collaborators in the online forums.
Mapping & Educational Programs
One area which best exemplifies HabitatMap’s use of mapping is through its educational outreach programs. Central to this effort is MapThink, an educational toolkit series developed by HabitatMap which introduces maps-based research methods to high school students and community based organizations so that they can become active participants in their community and advocate. The MapThink Toolkit series focuses on creating planning and advocacy maps using their online tools: HabitatMap.org and AirCasting.org.
Illustrative projects in this regard include youth program workshops in Brooklyn and San Francisco during 2014. In San Francisco, HabitatMap worked with 60 seniors from the Galileo Academy of Science & Technology, a public high school that provides students with career pathways in biotechnology, environmental science, health, hospitality and tourism, computer science, and creative media technology. In Brooklyn, HabitatMap worked with UPROSE which is a grass roots, multi-ethnic, intergenerational community-based organization dedicated to environmental and social justice. UPROSE Youth Justice members were introduced to the AirCasting product which was used to map the air quality problems in their neighborhoods, which is host to multiple power plants and waste transfer stations, dozens of auto shops, and bisected by the Gowanus Expressway.
Another HabitatMap mapping effort was conducted by the students at the Green School in East Williamsburg Brooklyn. Their project, entitled “Drip, Drop, the Water Don’t Stop”, focused on the New York City water distribution system. Using Habitat’s online mapping and the “Go With the Flow” toolkit, students developed maps based on research of the NYC water storage, filtration, delivery, and disposal infrastructures. You can learn more by clicking through the project map, looking at photos, and reading student learning reflections.
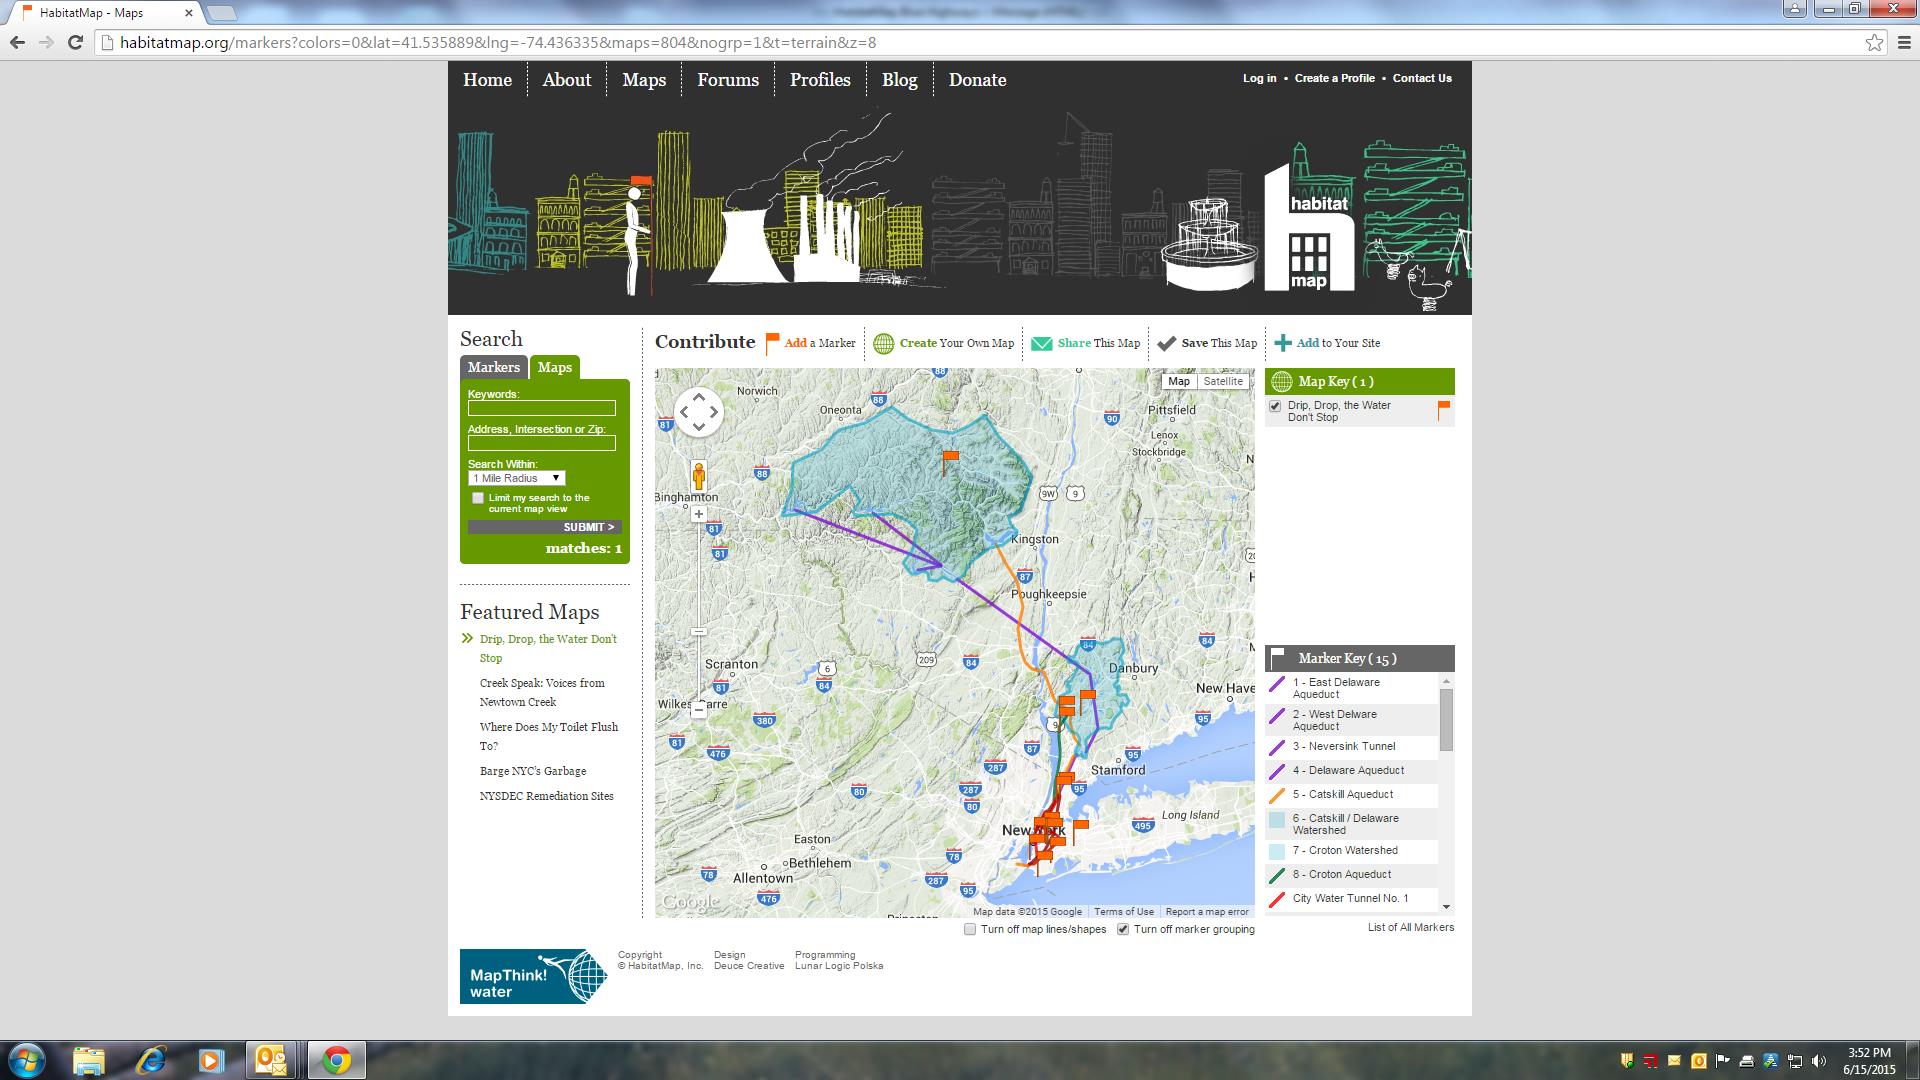
The Green School’s research project of the New York City drinking water system as rendered on the HabitatMap interactive map.
This summer, HabitatMap is working with the North Brooklyn Boat Club and the New England Interstate Water Pollution Control Commission mapping and collecting water samples in Newtown Creek with the new HabitatMap WaterSense monitor, which measures dissolved oxygen, conductivity, and temperature. The instrument connects to the AirCasting app via Bluetooth to record, map, and graph the data in real time. Made possible through funding from the Lily Auchincloss Foundation, the project was initiated to address water quality concerns in Newtown Creek, a Federal Superfund site that is inundated by over a billion gallons of raw sewage annually, the result of combined sewer overflows.
HabitatMap: Looking Forward
While boasting a diverse collection of partners and collaborators including Google Earth Outreach, New York Community Trust, Mozilla Hive NYC, Environmental Protection Agency (EPA), Carnegie Mellon CREATE lab, and the New York State Pollution Prevention Institute, among others, the likes of NYS Dept. of Environmental Conservation, Michael Heimbinde remains the only full-time staff at HabitatMap and envision’s a bright future for the nonprofit. He notes:
“We’re excited to continue growing the AirCasting community. Our ambitions for AirCasting, and it’s true potential, lie in 1) creating ultra-dense networks of AirCasters that network together multiple schools and community based organizations in a single neighborhood and 2) scaling nationally and internationally. HabitatMap, in partnership with Sonoma Technology, NYU School of Medicine, NYU Wagner, and the Newtown Creek Alliance have crafted a proposal for a community based participatory research project that would enable us to create an ultra-dense network of AirCasters in Greenpoint, Brooklyn, bring together the technical experts needed to address improving air quality in a neighborhood overburdened with pollution sources, and establish a model for expanding nationally and internationally.”
Tim Dye, Senior VP at Sonoma Technology, adds, “Our collaboration with Michael Heimbinder and HabitatMap on the development of the AirBeam sensor has been very rewarding. Together, we launched the Kids Making Sense program, which combines education and technology to empower students to drive positive change in their communities, in the U.S. and abroad.”
One community group and one map at a time. Communicating community geospatial data that matters from Brooklyn, New York. HabitatMap.
Along the Blue Highways of GIS.
Thanks for reading and see you down the road.
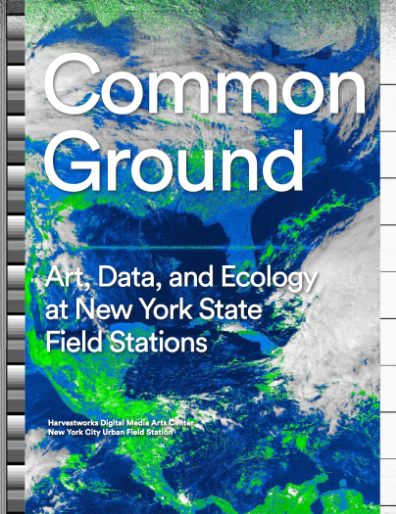 The report was published by the Harvestworks Digital Media Arts Center and
  The CEDRA Corporation offers GIS based software for mapping, civil engineering design and modeling, surveying and database maintenance applications. CEDRA’s