5 Barriers to Building GIS Programs in Small Governments in New York State

Some barriers instead might be considered missed opportunities but there continues to be specific issues which stifle geospatial growth

Over my 30+ years of managing the Westchester County GIS program, I worked extensively with local governments across the County.  Forty-three in all, ranging from Yonkers, now the third largest city in New York State to several villages which are little more than one-square mile in size such as Buchanan along the Hudson River with a population of 2,302 (2020 Census). All uniquely different in their attempts – and interests – to build geospatial capacity.  Some have been successful while many others have struggled for a myriad of reasons.  This is particularly true among the 23 villages.

Now “on the other side of the firewall” (thanks, Sue Knauss) and working for myself, I’ve been able to see and work further into the organizational framework of these smaller governments.  Confirming many of the observations I made while working with Westchester County that I believe inhibit the development of building geospatial programs at this level of government. Admittedly, the small Westchester County village just north of the Bronx is different in many ways from a small village in Chemung County and one could argue the sample size is too small to be reflective of the entire state of New York, but I would suggest these obstacles to geospatial development are conceptually very similar across the state.   Furthermore, the term “Village” is not necessarily synonymous with small government as the Village of Port Chester 2020 population here in Westchester County was 31,581 – larger than many towns across the state.  So as a point of reference for this article small governments generally mean those with a population of less than 5,000.  Plus or minus.

GIS implementation “how-to” articles, management and primer books, and cautionary experiences shared by software vendors and consultants often include recognized issues such as budget constraints, limited technical expertise, or the lack of a realistic, phased implementation plan, as major culprits in initiating geospatial efforts.   I experienced and witnessed many of these same reasons, though the following are five specific barriers which I believe have a major impact in building GIS programs in small governments across New York State. 

In no particular order:

  1.  Staff Continuity: On the urban fringes, professional staff, particularly in the front offices, turn over at an amazing rate.  Assistants to Village Administrators, Managers, and department heads/commissioners – those who are often tasked to coordinate or serve as a liaison to special projects covering several departments such as GIS implementation – are often on the move.    And it’s not just in the administrative offices where staff turnover is impactful, but also throughout key program offices and departments which touch on GIS implementation such as planning, assessment, public works, and water departments, among others.     Any successful GIS Manager will tell you one of the most important factors in building the program, or any new government initiative, is staff continuity.  Including those who are in charge of managing consultants involved in helping build the GIS program.  Losses in these areas are often a major setback and derail any progress that may have been made in the GIS effort.  In some cases, losing years of work.  It doesn’t matter how good the implementation plan was or the technology being deployed.  

2.  IT Support:  Many small governments often do not have full-time IT staff and normally contract out for this support.  And with it, much of the focus is on infrastructure items such as the network, desktop and peripheral hardware components, client software installations/upgrades and as is the case in all governments and businesses now – maintaining the firewall and supporting cyber security efforts. These contracts, which are often with smaller IT firms, rarely include the support or guidance on multi-department applications such as geospatial programs which increasingly include mobile applications and its peripheral components.  This is not to say smaller IT firms cannot support GIS, it’s just not normally in their wheelhouse.   In small governments, needed GIS support from IT resources for a “government-wide perspective” is often extremely limited.

3.  Software Application Silos:    In small governments where there is often an absence of an overarching “IT committee” and/or the like, as well as combined with the lack of full-time IT staff as noted above, it is not uncommon for individual departments to be left to themselves to make their own business software decisionsAnd as software vendors continue to push for and offer cloud-based/browser only solutions for their software products, it is even easier for individual departments and programs to go rogue and operate further in obscurity from the primary or seemingly “adopted” computing environments in the organizationIn fact, it’s not uncommon for IT support in small governments (I’ve even seen this at the City level) to not even know what browser-based business solutions some departments are using on a day-to-day basis.

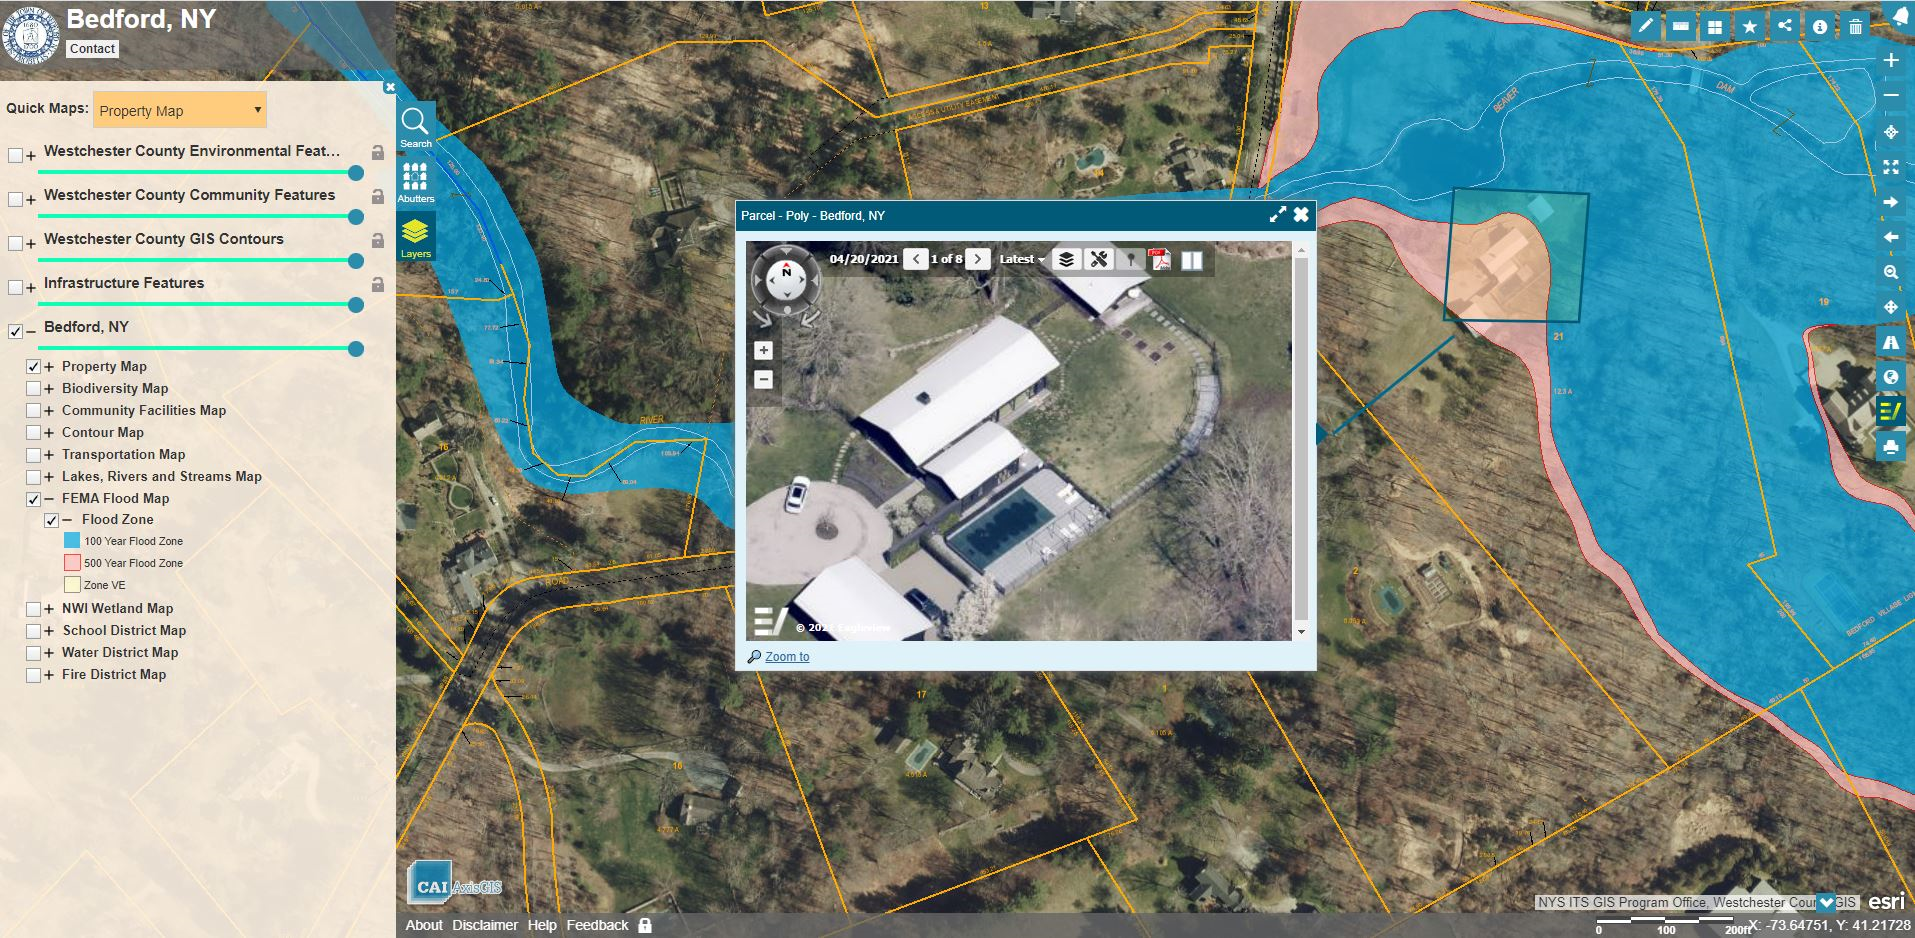
What makes this difficult in the GIS space is that practically all business software solutions now include some kind of “mapping” component –  if only to render the application data on some form of generic base map.  Most often Google Maps.   Often the user interface even includes the term “GIS” when simply viewing program data on a map – this being the extent of the “GIS” functionality.  And if and when the broader discussion of a GIS for the government is ever started, these same departments are slow, if ever, to join the effort.  Not knowing the larger intricacies and benefits of a shared, multi-department GIS program – the response is normally  “We already have a GIS“.  Little interest in the shared data model, to say the least of a common address file which most business software products normally ship  to support geocoding.  This cloud-only software application delivery model (mobile apps, too) is very common now in local government permitting, code enforcement, inspections, and even public safety disciplines to name just a few.

If it’s not broken, they are not going to try and fix it.  Let alone spend more money.  Making it very difficult to garner interest for a government-wide discussion on a unified GIS solution.  

4.  VIPs with an Attitude:    That may sound a little harsh, but the fact of the matter is that  just one dominant personality in small governments can impact the  decision making process over a wide range of internal technology issues – not just GIS.  Such individuals exist in all levels of government, but in smaller ones, where staff are few in numbers and  VIPs normally being senior staffers – frequently with decades of service – his or her opinion is often unquestioned.  Your first onsite meeting with folks who are genuinely interested in the GIS goes well – that’s why you’re there in the first place.  But during the second or third on-site meeting which is held to take a deeper dive into the concept – the VIP with an Attitude shows up out of nowhere acting like Lord Vadar.  Often packing a lightsaber.

Because of their decades of institutional knowledge, they have been ordained to know what is best for the good of the order.   Even if he or she isn’t even directly involved in geospatial.  Like a good defense lawyer, raising just an iota of doubt on what is deemed such a good idea by so many others.

Magically the VIPs have the ear of the Budget Director, Comptroller, Finance Director, fellow high ranking directors, or highest elected official.  Or the Town Board.  And so forth.  Across the municipal landscape they can be found in one of many program areas:  Public Works, Finance, Building Department, maybe a small Planning office, or even a long standing consultant who isn’t even on the payroll.  For whatever reason, he or she feels threatened by the technology which is being considered and increasingly adopted elsewhere.    Particularly if the VIP has not taken the time to understand the benefits that geospatial programs can bring.

But it’s not going to happen while they are still around and/or have something to say about it.  In my hometown, early GIS efforts were thwarted by the Receiver of Taxes.  Yes, Receiver of Taxes.  Largely because this office was responsible for “computer related” expenditures.  And nothing was going to compromise his/her annual computer software and hardware needs.  To this day, the program has never gotten on track.

There is really no good solution for the VIP with an Attitude problem in small governments. Sometimes retirement and attrition takes care of the problem though this may take years.  A change in administration sometimes helps, but in small governments new administrators rarely question long standing, senior staff members.  If anything they embrace the input and advice of VIPers.

And the beat goes on.  

5,  Consulting Engineers: Small governments often do not have a professional engineer on staff and normally contract out needed engineering services.  Engineering firms, whether small or large, which secure these services can have a profound impact on the use and development of GIS in small governments.  Though many small governments today do not see or consider their consulting engineers in this capacity.  Most aren’t even aware of the possible connection.

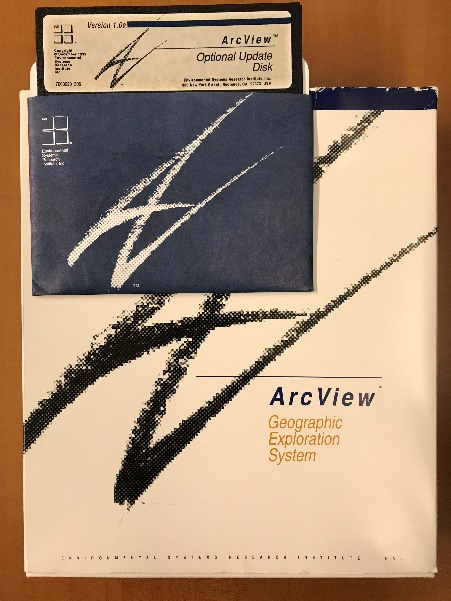
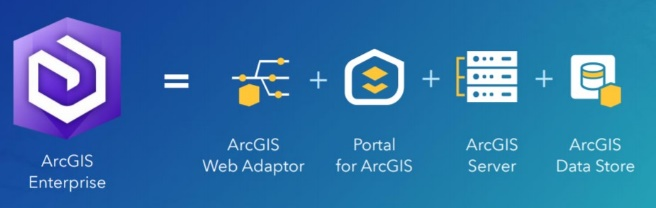
Back in the day of desktop/client GIS solutions, such support by consulting engineers was unrealistic.  But now, with easy-to-use cloud-based offerings such as ArcGIS Online, consulting engineers, along with their arsenal of AutoCAD related products and technologies, can simply envelope this “GIS service” into annual support services contracts.  At many levels of government, and particularly true in smaller ones, consulting engineers come in contact with all types of municipal geospatial data.   While infrastructure data (storm, sanitary, water distribution systems) are often the most obvious, consulting engineers duties also often include staffing local Planning Boards, serving as a liaison to utilities and a myriad of regional, state, and federal programs which include geospatial connections, as well as being involved in a host of local surveying and land/property record issues.    Depending on the in-house GIS resource capacity the consulting engineer maintains and the licensing agreement with the software vendor,  consulting engineers can offer a range of GIS capabilities to get small governments started for minimal investments. 

The reasons are many why this connection is not more common, but this “barrier” is more of a business relationship that more small governments should try and leverage with their consulting engineers.  There are positive and long term benefits for each party.   

Summary

At the end of the day, yes, the scale of small government operations and the scope of the geographical area covered may not seem to justify the investment in a comprehensive geospatial program.  Leading to a perception among the local elected officials, perhaps even department heads, that the benefits may not outweigh the costs.  Though the path I took in and out local government buildings, a basic lack of education and awareness of the geospatial benefits was still always an issue.  Particularly among the highest elected official and governing boards.  But it doesn’t stop there as I believe there still continues to be a significant lack of awareness or understanding of the broad spectrum of geospatial technologies among elected state representatives as well.    

For years, I’ve passively monitored the websites of New York State Association of Towns and New York Conference of Mayors as a source of ideas for articles for this blog.  Both organizations represent elected officials (including council members, boards, clerks and other municipal staff members as well) and are an excellent source of advocacy for small government programs and funding where geospatial technologies can be applied (i.e., transportation, infrastructure, public safety, environmental protection, etc).   Even New York State Association of Counties (NYSAC) for the most rural of our state counties serves in this capacity as well.  If one takes the time to drive around and research each of the association websites, including using key word search tools, there is little reference to GIS or geospatial technologies.  Or for that matter, little of the technologies that geospatial is wrapped into. 

These organizations would be an excellent source of geospatial awareness at their newly elected training programs or annual conferences – which are extensive.  Helping connect geospatial to the programs they fund and how the tools are applied locally.   (For this article I looked for similar training sessions for newly elected New York Assembly members but could not find any specific programs).  Perhaps an opportunity for organizations like the NYS GIS Association or our emerging academic programs to provide training session/seminars to these associations.

There will continue to be exceptions, but until the opportunities and awareness of geospatial technologies are better understood, small government GIS programs in New York State will continue to struggle.

GeoSpatial Business Spotlight: CAI Technologies

Location:              Littleton, New Hampshire 

Website:               www.cai-tech.com

Employees:          25

Established:        1985

Background

CAI Technologies has been providing GIS services to local and regional governments since 1989, making it one of the oldest and most experienced companies in the marketplace.  Since it was founded in 1985 as Cartographic Associates, Inc, CAI Technologies has been a recognized leader in local government parcel data development. Instrumental in developing the original parcel fabric, including record research and compilation for more than 270 municipalities, CAI continues to support parcel mapping development and annual maintenance needs for over 650 local governments.

Other strategic CAI corporate business functions focus on geospatial technologies including enterprise geodatabase design, GPS field data collection/mapping, and implementation services for critical utility infrastructure.  Focusing on water, sewer, and drainage infrastructure, CAI Technologies develops user tools which make system mapping, implementation, and ongoing maintenance cost-effective.  Additionally, the company provides a full scope of development services including requirements analysis, functional design, development, installation, training, and support.

CAI has a significant New York State customer base as the company currently supports the business needs of clients through implementing industry leading geospatial solutions.

Illustrative Projects

East Hampton, NY ArcGIS Enterprise Support

Since 2015 CAI has supported the Town of East Hampton by providing staff and expertise for managing and upgrading their ArcGIS Enterprise. With each upgrade, CAI provides the Town with a detailed plan including scope and pricing to support each task. Plans are designed to include processes to minimize downtime, identify fall back procedures, and provide time for end user acceptance testing.

Upgrades initially focused on ArcGIS Server and migration of existing SQL back office and SDE database onto one hardware appliance.  Next, CAI implemented Portal for ArcGIS to support Active Directory based logins with a federated ArcGIS Server. Once Portal was configured including the web adaptor, roles and permissions, CAI configured Web App Builder in the new Portal environment and migrated existing web applications.  “CAI has worked on a number of projects for us over the years and we continue to go back to them because of their excellent service,” notes Bob Masin, GIS Manager, Town of East Hampton, “they work collaboratively with us to fit our needs, are responsive, and always go the extra mile to make sure the job is done right and to our satisfaction” 

As new versions of existing software and add-on features become available, CAI coordinates implementation with the Town to ensure they are maximizing their return on investment. Most recently, CAI federated ArcGIS Server and Portal as part of an upgrade to Enterprise 10.9.1

Bedford, New York 

The Town of Bedford for many years maintained tax parcel data in various formats. A Town wide parcel layer existed in shapefile format with a majority of the tax maps generated from AutoCAD.   Some of the most current maps however only existed in PDF format. As a result, not all data sets were updated consistently each year which resulted in an inaccurate parcel dataset.

To meet the needs of the Assessor’s Office it was clear that the tax maps required updating and the resulting parcel data needed to be linked to the RPS assessment database. Using the existing source files, CAI digitized all of the existing lines and annotations into an ESRI geodatabase. Going as far back as 2011, deeds and plans were reviewed and parcels were recompiled in order to update the maps. Using additional information provided by the Assessor’s Office, CAI created GIS layers for condos and easements. Once updates were completed, CAI configured a Data Driven Pages map document file in order to print new tax maps from the GIS data.

CAI assisted the Town of Bedford in converting both existing digital datasets and hardcopy maps, including condos and easements, into a ESRI Geodatabase. This will support future tax map maintenance functions and serve as the foundation of the town’s AxisGIS public facing application. https://www.axisgis.com/BedfordNY

Capitol Region Council of Governments, CT

CAI Technologies Receive Special Achievement in GIS Award

The Capitol Region Council of Governments, CT (CRCOG) and CAI Technologies were selected to receive a Special Achievement in GIS (SAG) Award from ESRI. This award is given to users around the world to recognize outstanding work with GIS technology. The CRCOG/CAI Regional Parcel Viewer and Regional GIS Portal web application stood out from more than 100,000 other applicants.

CROG is the voluntary Council of Governments organization supporting 38 municipalities in the Metropolitan Hartford CT area including the City of Hartford. It is the largest of the nine regional planning organizations in Connecticut. CRCOG provides services to member towns to promote efficient transportation, public safety, responsible land use, preservation of natural resources and economic development as well as supporting shared service initiatives between member communities.

The project is a self-hosted and self-maintained Regional GIS Portal and Parcel Viewer to serve CRCOG member municipalities as well as to provide a flexible infrastructure for internal and external users. Features include automating the collection and linking of parcel and computer-aided mass appraisal (CAMA) data for each community hosted as a 38 community fabric of parcels, providing productivity tools including generation of abutter lists and labels, and providing contextual data from local, State and Federal partners such as infrastructure, environmental conditions, natural resources, census information, and political geographies. Project tasks also included streamlining and automating the update of CAMA data to the site. CRCOG GIS staff are now able to add town-specific data layers without incurring additional costs.

The CRCOG parcel viewer exemplifies the cost-efficiencies of shared services providing parcel data viewing and related mapping functions to 38 municipalities in the metro-Hartford area

The portal provides  the region with an invaluable repository of property information to support local and regional planning and development while also allowing CRCOG to implement an ArcGIS Platform which will be expanded to serve other needs of the COG organization and member communities.  The portal  continues to be a collaborative effort between CRCOG and ESRI Business Partner CAI Technologies and can  serve as a model for other regional planning agencies to follow.

The portal site can be visited at https://crcog.org/regional-gis/

Utility Mapping and Inspection Tracking Using GIS

CAI provides mapping services for their clients Water, Sewer and Stormwater systems.  Working with client staff, CAI performs Global Positioning Systems (GPS) data collection of the system point features and at the same time provides connectivity of the utility pipe network.

Working recently for the Windham Water Works and Windham Water Pollution Control Authority in Windham, CT, CAI performed sub foot data collection and mapping for over 130 miles of Water system and 47 miles of Sewer system. Taking advantage of the already in place AxisGIS service CAI hosts for the Town of Windham, the utility systems are made available to each utility in a secure staff only accessible AxisGIS Editor service. Each utility now maintains their data using AxisGIS Editor and Field Maps for ArcGIS.

CAI also integrated the water utility’s customer database with the GIS, thereby allowing easy field access to the water service connection tie cards. Recently CAI configured ESRI’s Lead Service Line Inventory solution to support inspections required to meet the Environmental Protections Agency’s (EPA) Lead and Copper Rule Revisions.

With many aging sewer systems present in the Northeast, CAI works with clients to record and display their Manhole and Pipe inspections using GIS. Typical pipe inspections include capturing CCTV video. The camera operator records information relative to pipe condition, material, diameter and lateral locations. CAI is able to glean this information from the inspection software database in an automated fashion to update feature attributes, create GIS features representing sewer lateral connections and symbolize lines based on their condition. The CCTV video is linked to the corresponding pipe segment for easy retrieval in the field or office using AxisGIS or ArcGIS Online (AGOL).

The AxisGIS  platform provides an excellent framework to integrate and mash together several different types of infrastructure data types including geometry, reports, and video inspections.

For those communities that are a permitted Municipal Separate Storm Sewer System (MS4), CAI provides system mapping and application development to support annual reporting requirements. To support outfall and ditch inspection workflows, CAI has configured a suite of AGOL Applications and Dashboards. Using Field Maps for ArcGIS, clients can record inspections while in the field and progress is shown using Dashboards configured in AGOL. As a result of significant EPA updates to the current MS4 General Permit, CAI has updated Outfall Inspection applications to support capturing test results required of any dry weather inspection where flow is present.

Dashboards are useful for managers responsible for monitoring and maintaining infrastructure systems. Displayed information aids in both communicating and managing field crews. Long term benefits assist in preparing annual and capital budgets.

Contact:

Aaron Weston
Business Development Manager
CAI Technologies
www.cai-tech.com
800.322.4540 x28
direct 603.761.6241
aweston@cai-tech.com

GeoSpatial Business Spotlight: H2M

Location:        Corporate Office in Melville, New York /  10 Other locations 

Website:          www.h2m.com

Employees:    372 in Melville / 110+ in satellite offices

Established:   1933

H2M is a multi-disciplined professional consulting and design firm focusing in the fields of architecture, engineering, and environmental sciences. From treatment facilities to public safety buildings, land surveying and road reconstruction, and from site assessment to remediation, H2M has helped design and build throughout many communities across New York State since 1933.

Geospatial Support in Water Supply Systems

H2M has built its engineering practice around its service to water clients working directly with municipal water suppliers and private water utilities. The company’s work in this space has grown significantly over the past five years and is built on decades of combined municipal and private A/E experience. Recent work has focused on supporting public and private water systems to comply with new U.S. Environmental Protection Agency (EPA) Revisions to the Lead and Copper Rules which require an initial inventory by October 16, 2024. One of the rule’s requirements mandates the inventory must be made publicly available online for systems serving a population of more than 50,000 people.

H2M’s primary water-related consulting includes, but is not limited to, comprehensive and cost effective water engineering, water quality analysis, distribution system mapping, water storage tank inspections, water quality testing services, lead service line (LSL) inventory, leak distribution analysis, main break mapping, hydraulic (pipe) modeling, and a full suite of online and mobile mapping applications utilizing industry leading GIS software solutions. Fully integrated GIS applications include access to maintenance logs, field notes, spur maps, tap cards, valve sketches, as-build drawings, and photos.

The scanning and indexing of historical hardcopy records of water system features adds great context and valuable information to new GIS-based applications

Complaint tracking, customer notification, and work order management functions are also supported by H2M as many infrastructure GIS systems are integrated with Enterprise Asset Management (EAM) programs such as Cartegraph, IBM Maximo, Cityworks, Tyler, AssetWorks, Infor, and Lucity. These systems often consume published GIS map services, ensuring dynamic connectivity for real-time data analysis and review.

In the realm of field data collection, mapping and viewing software is augmented by powerful mobile apps. ESRI’s suite of mobile software products includes Field Maps, Survey 123, Workforce, and QuickCapture. These mobile apps can be augmented by connecting to external GNSS devices for real-time coordinate correction and higher accuracy data collection.

H2M’s work in the water system space includes the delivery of dashboards to which have become increasingly popular among administrators and decision makers providing a direct and “live” link to water system databases. Such dashboards access to pie charts, spreadsheets, photos, and mapping/viewing windows

Illustrative Projects:

Greenlawn Water District

H2M assisted the Greenlawn Water District in meeting new EPA lead service line inventory requirements by accurately geocoding each of their 12,017 service accounts and creating a data schema that complies with New York State Department of Health requirements. H2M reviewed multiple sources of information to determine service material including approximately 12,000 tap cards, dozens of hardcopy record replacement maps, and municipal records that include date of construction. Based on this information, H2M created an inspection map in ArcGIS Online which allows the District to determine areas with unknown service material and suspected lead which requires further investigation. H2M deployed Esri Field Maps as well as a Survey123 inspection form for the District to record their field inspections. This allows the District to easily document field inspections with notes and pictures, which are tied directly to the core GIS inventory data. Furthermore, H2M created multiple dashboards in ArcGIS Online that provide a dynamic snapshot of known and unknown service line material. This enables the District to quickly see the quantity of accounts that require further investigation and action, should replacement be required.

Online map viewers are easily configured to visually classify the types of water system materials owned by both the water district and by property owners

Village of Garden City Water Department

H2M was tasked to perform the Village-wide Lead Service Line (LSL) inventory and to develop a searchable, map-based data repository within its existing ArcGIS Online environment. As part of this work, H2M’s geospatial team reviewed several thousand individual records provided by the Village, including Excel spreadsheets, Building permits, plumbing permits, and nearly 1500 engineering plans. Information pertaining to water service material was transposed from the source materials to the GIS data. Source documents were also attached to the GIS data to facilitate simplified, map-based retrieval in the future. In addition to scanned documents, H2M incorporated information from engineer field observations, customer reports, and date of construction, as documented by the Nassau County assessor’s office.

Every street-side and customer-side water service within the Village is mapped and catalogued by its documented material and status.

Veolia North America (formerly SUEZ Water New Jersey

Veolia owns, operates, and maintains a network of hundreds of miles of transmission and distribution infrastructure serving more than a million residents in numerous municipalities/institutions throughout the State. In advance of the proposed State of New Jersey lead service line regulations, Veolia launched a comprehensive lead service line replacement (LSLR) program in 2019. Veolia sought assistance from H2M architects + engineers (H2M) as Construction Administrator and Construction Observer to support the regulatory compliance goals and ensure detailed records of field activity, including digital mapping in a GIS framework.

The initial scope of the 2021 LSLR program was characterized by the performance of dig-and-determine for1,900 services and the replacement of approximately 1,200 (lead and non-lead) lines within the Veolia Hackensack Public Water System Identification (PWSID), which has since been expanded to 4,600 dig and determines and 2,500 replacements.

The most challenging portion of compliance for Veolia and H2M was in the identification, cataloging, mapping,and replacement of lead service lines in systems. Service line inventories must result in the categorization of services as either: LSL, brass with suspected leaded gooseneck requiring replacement, galvanized requiring replacement, or non-lead.  Particularly vital to the success of this effort was the creation and maintenance of a set of standards intended to document compliance with the updated federal Lead and Copper Rule and ensure continuity of critical infrastructure data for future operations. To accomplish this, H2M utilized a novel, tablet-based data collection tool to document each crew’s daily activities and ensure immediate QA/QC access to the Veolia leadership team.

H2M’s work has ensured Veolia remains EPA compliant and ahead of the new requirements schedule.

 Hicksville Water District

Since 1996, H2M has supported the Hicksville Water District and as part of this work, a service line material inventory was created for the District utilizing Geographic Information Systems (GIS) technology. Leveraging existing District data which exists in both hardcopy and digital format (tap cards, record replacement maps and date of construction records) and combining with field collected datasets, H2M continues to assist the District in meeting EPA Lead and Copper regulations. This also includes complying with public/private water system data standards established by New York State Department of Health.

ESRI’s ArcGIS Online provides an excellent framework to establish and serve easy-to-use map viewers that will allow residents to look up service material by either address or account number. H2M’s efforts support compliance with the regulation and increased transparency for the municipality.

Water distribution systems built before the 1950s often had distribution networks that were built with lead piping

Summary:

The team of GIS professionals maintain technical fluency in the constantly-changing
GIS industry software and practices including the ESRI and AutoCAD platforms.
Software flexibility and expertise in deploying need-based solutions ensures H2M’s clients have the information they need to continue to provide the highest level of service to our communities.  A more detailed description of H2M’s capabilities and geospatial work in the water systems industry can be found in this presentation.

In addition to applying and creating solutions for the water systems sector, H2M’s geospatial team also provides client services in the following areas:

  • BIM Integration
  • Community Planning
  • Data Conversion
  • Digitization of Records
  • Environmental Data Analysis
  • Geodatabase Design
  • Geospatial Analysis
  • GPS Data Collection
  • Hydraulic Modeling
  • Mobile Application Development
  • Municipal Asset Management
  • Online Mapping
  • Raster Analysis
  • Special District Mapping
  • Wetland Delineation

H2M is an ESRI Business Partner and was recognized with their ArcGIS Online Specialty designation for the continued deployment of successful online and mobile mapping solutions.

Contact:

Christopher M. Kobos, PMP
Director of GIS Services
H2M architects + engineers
538 Broad Hollow Road, 4th Floor East, Melville, NY 11747
tel 631.756.8000 x1731 | direct 631.392.5359 | mobile 516.946.9832 | fax 631.694.4122

10 Questions: Neil Curri

Geospatial technologies are found in so many organizations and on so many levels.
What once was a fledging technology based on desktop client software now
encompasses web technology, mobile and handhelds, increasingly the engineering
software toolbox, and hordes of geospatial data of all types and quality. And yes, the
ageless desktop clients lives on. It’s not often to find someone who is able to navigate
the many pieces of the technology for multiple organizations.

Neil Curri, who lives in the mid-Hudson River Valley community of Lloyd, is involved in a
wide range of geospatial efforts encompassing a diverse number of organizations over
the past several years. While technically currently employed by Partridge Venture
Engineering, Neil also serves as a GIS Academic Computing Consultant at Vassar
College in Poughkeepsie and has served in local government geospatial efforts as well
as the Dutchess County Cornell Cooperative Extension.  We recently communicated to discuss his past and current GIS contributions to the profession.

eSpatiallyNewYork: Let’s go back to the beginning – when and how did you get started
with geospatial technology?

Curri: After working in IT for a few years after college, I decided to go back to school to
refocus my career on something in the environmental field. GIS seemed a logical fit. I
found an Environmental Science M.S. program that also offered a GIS certificate at the
University of New Haven. The summer before I went back to school, I got a hold of a
copy of ArcView 3.2 and made a couple of maps and a website for a local watershed
group. The environmental applications were obvious.

eSpatiallyNewYork: In your capacity at Partridge Venture Engineering (PVE), what kind
of GIS applications or tools do you use?

Curri: Mostly ArcGIS Pro (and ArcMap for legacy projects – still transitioning…), some
GPS, and some limited drone work. We’ve used ArcGIS Online for a handful of projects
where a web mapping application was an appropriate deliverable for the project and
client. I’ve had to build a couple of small databases to organize environmental data
streamlined for mapping. My position is within the company’s Environmental division,
and there’s a need for map figures in every phase of a project – most of our work is site investigation and remediation. Mapping-grade GPS provides enough accuracy for ourpurposes, but we do use differential GPS and post-processing to get the best accuracy we can with our hardware. We’ll collect drone photos when existing aerials are
insufficient or outdated. I’ll either georeference them for any site figures we need, or
occasionally I’ll set up a flight plan and use drone mapping software to get a composite
aerial of a large area or use the 3D capability to estimate soil stockpile volumes or
excavation pit volumes.

eSpatiallyNewYork: You are the GIS Lab Manager at Vassar College. What does this
involve and some of your duties

Curri: My official title at Vassar is GIS Academic Computing Consultant. Duties include
mainly instructional support – advising faculty, staff, and students interested or engaged
in using GIS for teaching and research. For example, students in a Geomorphology
course were recently working on a GIS lab exercise that involves mapping changes in
glacial lake levels and creating an elevation profile to get channel dimensions and
calculate flow volume. This lab is one of several exercises for the course that were
originally written for ArcMap, which I migrated to ArcGIS Pro. I also work with the
college’s IT department staff to maintain GIS hardware, software, and licensing. CIS are
technically the “lab managers”, but we work together to keep things running and provide
capacity as GIS use grows on campus. With an enrollment of about 2,400 students,
Vassar is a small college. But GIS use is reaching the point where I think the
administration will expand licensing campus-wide for the next academic year, which will
significantly reduce the time I spend managing ArcGIS Online accounts.

eSpatiallyNewYork: Any particular area students seem to be most interested in in
applying GIS technology and concepts?

Curri: While the two core GIS courses – Cartography and Spatial Analysis (I
occasionally adjunct instruct either of these) – are taught out of the Geography and
Earth Science department, many students who take the course are Urban Studies
majors, who are very interested in social justice issues. But there are also many
Environmental Studies students who take the courses, and they tend to be interested in
ecological research and conservation. Neither of these courses (nor both of them
together) necessarily prepare students for a career in GIS, but students who take these
courses are sought after by faculty and staff for research and other projects (like the
Poughkeepsie Natural Resource Inventory or research projects at the Collins Field
Station on Vassar Farm) and they are more likely the ones who will pursue GIS as a
career and/or go on to graduate school to study GIS or a GIS-related field.

eSpatiallyNewYork: Tell us something about Vassar GIS students/grads,
YouthMappers, and Society for Conversation GIS

Curri: Hudson Valley Mappers is the Vassar-based chapter of YouthMappers, an
international organization supported by USAID. Two former students, one of whom now
works for USAID supporting YouthMappers, began the chapter in the Fall of 2018.
Students involved in HV Mappers are passionate about using GIS as a resource for
communities, both locally and around the world. The group coordinates local community
mapping events, usually involving some field data collection and partnering with one or
more local organizations, as well as organizing mapathons in which students participate
in Humanitarian OpenStreetMap Team (HOT) mapping projects

eSpatiallyNewYork: What was your geospatial roll and contribution with the City of
Poughkeepsie Natural Resource Inventory?

Curri: I mentored several student workers who assembled the maps created for the
report and online content and I ended up editing some sections of the report with Jen
Rubbo, Director of the Environmental, who led the project. Part of the it involved
inventorying and inspecting Ash trees for impacts by Emerald Ash Borer. I worked with
students and staff using previous tree inventory data by the City’s Shade Tree
Commission as the starting point, set up an ArcGIS Collector project for the field data
collection, and helped organize the information into a public-facing web map. That data
was used by the City to identify trees that presented a potential hazard and remove
them. There’s a short video describing that part of the project on the City’s website.

eSpatiallyNewYork: You worked at Dutchess County Cornell Cooperative Extension
between 2007-2015. What is your involvement there today?

Curri: I was recently asked to serve on an advisory committee for Dutchess County Cornell Cooperative Extension’s pending update of the County’s Natural Resource
Inventory. I worked on the last revision several years ago while at CCEDC, which was
an update of the previous version conducted in 1985 by the County’s Environmental
Management Council. A former intern and a volunteer I mentored there both went on to
graduate school and made careers for themselves in GIS – one is now with the NYS
GIS Program Office and the other is on staff at CCEDC.

eSpatiallyNewYork: You currently serve as Chair of the Town of Lloyd Environmental
Conservation Committee. What’s your sense of the understanding and acceptance of
GIS concepts by citizen and community groups at this level in the Hudson River Valley?

Curri: Though I may not be totally sure, but I think most citizen and community groups
in the Hudson Valley – at least any that have an interest in environmental conservation,
planning, or community development, or anyone volunteering for a town committee or
board – have some sense of what GIS is and that it has value. But there is a lack of
capacity available to citizen and community groups, and consultants like me cost
money, and budgets are limited, so I think exposure to GIS and understanding how it is
or could be useful to them is still limited. Lloyd is one of few towns in the Hudson Valley
with some in-house capability, which predates my involvement.

eSpatiallyNewYork: Some of your community outreach work and involvement has led
to having the DEC Hudson River Estuary Program support an intern on one of their
funded projects. Tell us about how that developed.

Curri: A former student should get some credit for this. While we were finishing up the
Poughkeepsie NRI, she was taking the web mapping class, which is a half-semester
class taught occasionally taught by Prof. Mary Ann Cunningham. Mary Ann connected
her with us, and for her class project the student published the NRI layers to ArcGIS
Online and assembled them in nested web apps to combine functionality. Volunteers
working on NRI’s in two other Hudson Valley towns, Union Vale and Gardiner, saw the
Poughkeepsie online map and wanted one of their own. Interested interns came forwardand used the Poughkeepsie NRI map as a template to assemble those. Based on thesuccess of these, the DEC Hudson River Estuary Program then contacted me to inquireabout assembling maps for the Town of Gardiner’s Community Preservation Plan
(CPP). We found an interested student but it ended up being more simple for PVE to
assume the contract and hire the student. He and I are working on this project now.

eSpatiallyNewYork: What’s been your involvement in statewide GIS activities?

Curri: I’ve been a member of the NYS GIS Association for a few years, but not very
active.I used to attend NEARC regularly before my partner and I started a family five years ago. About two or three years ago, some folks from a few land trusts in the
Hudson Valley started up a local chapter of the Society for Conservation GIS. I have
missed only one or two of these meetings since then. It’s a great group of people and I’dlike to be more involved – after this semester is over!

eSpatiallyNewYork: Have a particular GIS project you worked on or produced that
would like to highlight or brag about just a bit?

I think I’ve already done some of that here, but I’ll mention getting to work with Vassar
Professor Emeritus Dan Peck on the maps for his book, Thomas Cole’s Refrain.

There’s some work for litigation projects at PVE I’d like to highlight but not permitted top
do so. Most of my projects I don’t really consider “produced” by me, as I am often
working with a subject matter expert, a geologist, a professor, or enthusiastic student, a
client, or community partner who’s more or less guiding the project, and I’m just figuring
out what geospatial product or tool fits their needs.

Contact:

Neil Curri, GISP
GIS Analyst, PVE, LLC
Vassar College Academic Computing Consultant
necurri@vassar.edu | 845-437-7708 | 845-664-2100 (mobile)

The American Recovery Plan Act (ARPA) of 2021: Where’s the GeoBeef?

There's lots of money out there. But few in the GIS community seem to be talking about it

During the waning months of my service with Westchester County last fall, I began to see references and documentation connecting geospatial technology to Coronavirus State and Local Fiscal Recovery Funds (SLFRF) program which was enabled as part of the American Rescue Plan Act (ARPA) passed earlier in 2021.  Earmarked monies for each government in New York State.  This was followed by passage of the Infrastructure Investment and Jobs Act (IIJA) passed in November 2021.   In general, SLFRF funding is more directed to local governments and IIJA funding being more focused on state government appropriations.  The progams certainly haven’t gone unnoticed by GIS software companies such as ESRI and Cartegraph which have published documentation outlining how specific categories of ARPA funding  can be used to support local government geospatial activities.  Even Autodesk, the AutoCAD giant, has recognized the relevance and importance of these landmark funding programs.

Empire State organizations such as the New York State Association of Towns (NYTOWNS), New York State Association of Counties (NYSAC) and the New York State Conference of Mayors and Municipal Officials (NYCOM) which represent the many levels of local governments across the state are also busy tracking funding allocations and keeping their own scorecards.  For example there is NYCOM’s Municipal ARPA Plans and Programs inventory, NYTOWNS procurement guide, and NYSAC’s county-level breakdown of funding   And there’s more.  The U.S Treasury Department’s Allocation for Metropolitan Cities  or the Brookings Local Government ARPA Investment Tracker.  Your county or municipality may have yet to make the connection to these geospatial opportunities.  

The Brookings ARPA Investment Tracker is one of several sites monitoring the use of grant funds. Erie County’s use of the funding is highlighted here with 92% of the funding being used for infrastructure purposes. Other New York State government interim reports can be found here.

But even with all of this publicly available information, and aggressive marketing by the vendor community, there seems to be a limited amount discussion about how these major federal grant funding programs can be woven into local geospatial initiatives.  And this is unfortunate because its very clear there ARE local activities which are “ARPA eligible” in the areas such infrastructure management, economic development, health and human services delivery, housing, transportation and community revitalization to name only a few.  So who is leading the statewide local government ARPA geospatial discussion?

Diving a little deeper, I took out attempting to survey the statewide local government geospatial community on the ARPA and IIJA programs by issuing a simple survey via the NYS GIS listserv, as well as having a link put on the NYS GIS Assocation’s website (thank you, Association webmasters).  Perhaps I would have gotten a better response to the survey offering links to both of the funding programs, but instead, wanted to capture the respondent’s immediate understanding/awareness of the programs when opening the survey.  Providing links to the programs would have defeated the purpose of the survey.   And I made it clear the survey was only for New York State local government users and/or their contractors.    That takes a lot of potential respondents off the table via the listserv and with local government representation in the Association hovering around less than 25% of the total membership, I wasn’t sure what the response would be.  Though not included in the images below, I emailed a handful of former county colleagues separately ahead of the online survey which resulted in very similar results.

The results can hardly be considered a statistically representative sample of the statewide local government GIS user community.  I received only 20 responses of which 18 provided usable data.   As such, I would submit the following pie charts can be considered illustrative or reflectiveof the current overall awareness, if not understanding, of the current ARPA funding programs.  While only a third of the respondents indicated they were even aware of the ARPA program (first pie chart),  there was barely any understanding of the funding as it relates to geospatial (second pie chart) and only one of the respondents indicated he/she had been involved in any discussions regarding the use of ARPA funding (third pie chart) in their organization.   Though to some degree many GIS practitioners across the state often hold down technical positions in department-line staff positions which are normally far removed from the grant funds discussions being held in much higher administrative offices.

Unfortunately, as historically been the case, the top level NYS government associations noted above have rarely made GIS/geospatial a visible and outward facing part of their agenda.  Even today, Its hard to find anything really meaningful for the local government GIS community when using keyword searchs such as  “GIS, geospatial, or mapping” on any of their websites.  And its highly doubtful there will be, or can be, any real meaningful advocacy through any state program offices as this political or elected official outreach framework doesn’t even exist on behalf of local government GIS programs.    As the next generation of local government GIS/geospatial programs evolve, particularly in the urban environments where the focus will be more on the public infrastructure, utilities, sustainability and climate change impacts, large scale and high resolution mapping and surveying – the collective internet of things (IoT) – discussions and geospatial strategies with most state government offices in this space will  become more distant.    Geospatial programs for different levels of government in New York State evolving in completely different directions.   Albeit for sure New York City is on a different level when is comes to infrastructure and underground mapping, but it’s Underground Infrastructure Project concept does represent an important direction of the next generation of local government GIS programs in urban areas across the state.  It’s just a matter of degree.

The list below, from an ESRI publication and is available on numerous websites, highlights the local government programs in play.  No, not necessarily direct funding to your GIS office, but does serve as a roadmap of who GIS practioners should be talking with at the local level.  EcoDev, public health, infrastructure and public works, and cooperative efforts with utilities.  And then find out who is administering your government’s ARPA funding.    You can be assured someone or some agency has dibs on the funding.  And apparently the GIS programs are only visible in the rearview mirrow. 

The four major ARPA funding program areas include:

1.  Support public health expenditures, by, for example, funding COVID-19 mitigation efforts, medical expenses, behavioral healthcare, and certain public health and safety staff
2.  Address negative economic impacts caused by the public health emergency, including economic harms to workers, households, small businesses, impacted industries, and the public sector
3.  Replace lost public sector revenue, using this funding to provide government services to the extent of the reduction in revenue experienced due to the pandemic

4.  Invest in water, sewer, and broadband infrastructure, making necessary investments to improve access to clean drinking water, support vital wastewater and stormwater infrastructure, and to expand access to broadband internet

Within these overall categories, recipients have broad flexibility to decide how best to use this funding to meet the needs of their communities

While actually securing funding is much easier said than done, often requiring great grant and proposal writing skills as well as involving many individual offices and agendas in the organization.  But the almost complete lack of even a discussion by the statewide local government GIS/geospatial community to date seems amiss.

There are so few funding opportunities such as these 2021 federal grant programs to take advantage of.  These are generational programs.  Right now the onus of finding representation and advocacy for local government GIS funding in the federal grants arena falls squarely on local government GIS leaders and their representatives.  As well as local GIS practitioners.

Right now, though, the silence is deafening.

Geospatial Business Spotlight: Woodard & Curran

Location:                      Rye Brook, New York (Other Locations Nationwide)

Website:                       Rye Brook & Corporate

Employees:                 30 Rye Brook Office / 1,200 Nationwide

Established:                1979

The Company

Woodard & Curran is a privately held, national integrated engineering, science, and operations company. It was founded in 1979 by  Frank Woodard and Al Curran with a mission to provide a safe and enjoyable place to work with opportunity, integrity, and commitment, and to attract talented people. Woodard & Curran experts are devoted to their work which is reflected in exemplary project and program results for both public and private clients. Through a multidisciplinary approach, Woodard & Curran strives to solve clients’ technical and business problems, routinely finding unique and cost effective solutions for their clients.

Geospatial Software and Technologies:

A registered ESRI Business Partner, Woodard and Curran’s geospatial team offers the following services:

  • Needs Assessment & Implementation Planning
  • ArcGIS Online (AGOL) Configuration & Management
  • ArcGIS Enterprise Planning & Implementation
  • Paper to Digital Conversion
  • Data Standards Development
  • Field Data Collection
  • Data Integration
  • Database Design & Administration
  • Map Production
  • Web GIS Development
  • Mobile Application Development
  • Asset Management Planning and Implementation
  • Computerized Maintenance Management System (CMMS) Integration
  • GIS and GPS Training

Geospatial Products and Services:

Woodard & Curran’s geographic information system (GIS) experts leverage the latest technologies to transform outdated data management processes into practical, efficient, and effective solutions for public and private clients. As a registered ESRI Business Partner, Woodard & Curran uses ArcGIS Online’s powerful platform to optimize spatial data through web maps and workflow specific applications for internal or public use. Woodard & Curran customized ESRI’s ArcGIS Online and Portal environments  provide clients with secure permission-based access for individual users to view, edit, or analyze data. Specific geospatial programs supported include:

ArcGIS Online Jumpstart Program

Focusing on the ArcGIS Online framework, Woodard & Curran provides customized, certified GIS professional assistance to organizations getting started with AGOL by offering:

    • Initial setup and configuration of an ArcGIS Online environment;
    • Prioritizing web maps and applications;
    • Instructions on setup, configuration, and use of web maps and applications;
    • Ongoing training for those responsible for managing AGOL environment

 GIS Enterprise Solutions

Woodard & Curran offers professional services for the full suite of ESRI ArcGIS products including ArcGIS Desktop, ArcGIS Enterprise, and ArcGIS Online along with extensions and add-ons. Such client services are offered on premise or remotely depending on the nature of the GIS professional services being provided. This work includes support for GIS needs assessments, data conversion & migration, and design & implementation of new GIS environments for clients just starting out with GIS. For clients with more mature GIS environments, Woodard & Curran professional staff also provide advanced GIS Strategy and Planning, System Integrations, or Advanced System Architecture and Design Services.

Field Data Collection Solutions

Woodard & Curran’s geospatial experts help clients identify, configure, and implement a variety of field and mobile data collection solutions.  Field data collection can include the inventory or field verification of assets using mobile technologies including smart phones, tablets, and Global Positioning System (GPS) devices. Depending on the needs of the project, information can be collected with varying degrees of location accuracy ranging from sub-meter to centimeter. Mobile data collection applications, such as ESRI Field Maps and Survey 123, and GPS solutions allow for accurate updates to be made in the field for real-time data management.

Mobile data collection is a “must-have” app for the engineering disciplines. Woodard & Curran designs and deploys a wide variety across many platforms.

Woodard & Curran’s GIS experts also offer drone services to access terrain or infrastructure that may be too vast or pose safety concerns with numerous FAA certified small unmanned aircraft system (sUAS) and drone pilots.  Drones produce high resolution orthoimages, elevation contours, three-dimensional and land use analysis, volume measurements, planimetric maps, and vertical or horizontal visual measurements.

Woodard & Curran has FAA licensed UAS operators which help support many types of field data collection projects. Drones are increasingly being used to access sites which are either inaccessible or unsafe for field workers to get to.

Asset Management Technology

While asset management (AM) plans operate on a long-term vision, these plans rely on hundreds of daily dynamic inputs. And keeping track of these data points and life-cycle strategies requires a comprehensive AM technology program.

AM technology applications must be chosen carefully because they will store critical asset information, administer aspects of maintenance process and provide critical information to users when needed. These applications should fit both current and future needs, while providing the functionality necessary to maintain critical assets effectively. In supporting geospatial applications in this space, Woodard & Curran leverages business intelligence (BI) software, such as Microsoft PowerBI and ArcGIS Dashboards, to connect, integrate, analyze, and present business key performance indicator (KPI) data.

Woodard and Curran’s geospatial asset management strategy is integrated with organizational business programs such as Business Intelligence (BI) and Data Analytics and Enterprise Asset Management Systems (EAMS).

Testing Public Water Fountains for NYC Parks

New York City Department of Parks and Recreation (NYC Parks) retained Woodard & Curran to test for sources of lead in approximately 3,500 interior and exterior public drinking water fountains. While the initial proposal estimated eight weeks, the city wanted to fast-track the project with sampling beginning the first week of May 2019 and wrapping within five weeks. With the help of robust existing GIS data for the exterior fountains, Woodard & Curran’s field teams were able to meet this expedited timeline.

GIS data was analyzed to create groupings of fountain sites, organize workflow, and improve efficiency as six teams were deployed six days a week to reach nearly 900 public parks across the city’s five boroughs. Field staff were equipped with mobile devices to use GIS-compatible applications ArcGIS Collector and Survey 123 for real-time recording of sampling progress, asset information, and results reporting. The technology helped managed the need to cordon off each fountain for 8 to 18 hours, return to collect a sample after stagnation, and then a 30-second to one-minute flush sample. This also enabled field staff to build out GIS data for the approximately 500 interior fountains that were not previously listed in the client’s GIS. As the sampling progressed, the real-time collection of information on mobile devices fed into a public interactive map on the NYC Parks website.

Woodard & Curran mapped and took water samples at over 3,500 water fountains across the five boroughs in New York City in 2019.  The effort added many new features which where previously not included in the drinking fountain inventory.

Workflow & Data Accessibility for Town of Cortlandt, New York

To improve efficiency across municipal departments that relied on information about physical assets, the town of Cortlandt sought to enhance its GIS program. Woodard & Curran worked with the town to identify specific ways to strengthen their GIS program, targeting data quality and work order management as areas of significant opportunity. By focusing on the quality and integrity of data, GIS experts helped develop a public web GIS platform. To further leverage the technology, a work order management system with mapping interface was developed for staff, which allows them to generate and close out work orders while still in the field. All data from the work order system is available to managers, enabling them to see emerging trends and improve planning efficiency.

The Town of Cortlandt (NY) Work Order Management System (WOMS) provides town staff easy access to important municipal work orders (previous, current and pending) covering several operational programs and departments.

Contact:

Anthony Catalano, Senior Principal acatalano@woodardcurran.com
Jake Needle, GIS Program Manager jneedle@woodardcurran.com

Taking a Peek Under the Hood: New York State GIS Association

How’s Your Regional GIS Association Group Doing? Biden’s Infrastructure Plan. And Dude, What’s Up with Senate Bill S1466?

Its mud season in the Adirondacks so outdoor activities are kinda slow in the North Country.  Not much on the trails and the black flies loom.  Similarly is the blog content, scrounging around for new material and the like.  Couple articles in development hoping to pull together over the next couple months.  Some cool stuff coming out of NYC.  Seemed like a good time to pull together some topics and issues I’ve been staring at for a while.  Much of it related, for the most part, to the NYS GIS Association.

New York State GIS Association Regional Groups

The end of last fall I started a conversation with a GIS colleague who was responsible coordinating meetings for a local/regional GIS user group. An honorable task given the amount of time and effort which goes into doing so – often solo or with only one or two other folks.  Our conversation focused on a combination of declining attendance and participation throughout the region albeit at the time this may have been more of factor of COVID.  The play book almost the same everywhere:  virtually no in-person meetings, Zoom fatigue, and/or in general everyone completely pre-occupied with the pandemic.  All of this adding to the challenge of working with others to develop and propose meeting themes which would/could focus on something other than COVID.  And as we all know, much easier said than done over the past 16 months.

Curbing my own personal thoughts and opinions about where the profession is headed in this space across the Empire State – fodder for another article and another day – I put together a short 10-question Google forms questionnaire which was sent to the 15 regional coordinators listed on the Association’s Regional Coordination Committee web page.

Response rate was actually very good as I received responses from 14 of the 15 individuals I sent surveys to.  One of the 14 opted not to complete the survey leaving only one coordinator not responding.   Selected questions are listed below for which I’ve included summary results.   A spreadsheet containing all questions and and responses by all respondents can be downloaded here.  For the purposes of this article I removed the name of the Regional User Group so responses could not be linked to a specific person or group.

Taking a look at some of the questions and grouped responses:

1. When was the last time your Regional Group met?

2.  Was the last meeting in-person or online?

3.  Whether in-person or online, how many people participated in the last meeting?

4.  How many people are involved in helping coordinate and administer your user group activities (i.e., scheduling meetings and speakers, establishing agendas, maintaining email lists, maintaining any kind of user group website, etc) as of March 2021?

5.  Any thoughts as to whether or not your Regional User Group will go back to in-person meetings once the COVID pandemic has generally passed?

6.  Are any future Regional Group Meetings scheduled?

(Note:  During preparation of this article one Regional Group announced a Fall 2021 in-person meeting

7.   Is the membership of your User Group mainly composed of government workers or from private sector/industry?

8.  When User Group Meetings are held, do the topics and content of discussion focus on local/regional geospatial issues or more on statewide GIS issues?

Synopsis

Given the high percentage of the number of regional coordinators who responded to the survey (14 of 15; one responding to me but not completing the survey) the information gathered should be considered reflective of the current activities and engagement of the regional groups.  Admittedly the survey was really only 10 questions and completed during our time of  COVID, thus one could argue that some of the organizational issues which the Association is facing is similar to other organizations due to the pandemic.

That said, couple immediate takeaways on the pulse of the Association’s regional groups:

While the pie chart shows nearly 54% (7 of 13) of the groups haven’t met in over 12 months, overall its probably closer to 60% as I suspect the two groups which did not respond to the survey have not met during the same time period as well.  One of those for sure.  Sixty percent is significant.

Closely related is the question about whether or not coordinators anticipate getting back to “in-person” meetings after the pandemic has passed.  Seemingly more relevant, however, was the issue of “re-energizing” the group first (61% or 8 of 13 responding).  My guess it’s safe to assume the other two survey non-respondents are in the same space or mindset – and the percentage goes to a whopping 66% – 10 of 15.  75% of those responding indicated the next meeting wasn’t even planned and again, if you throw in the non-respondents to this questions it goes to over 80%.

A noticeable feeling of malaise?  Seems like enough to give the Regional Coordination Committee Co-Chairs something to think about.

Findings to other questions which included, for the most part, anticipated results such as:

  • Meetings taking place (independent of how long ago) were about half in-person and half-online)
  • Numbers of people participating in meetings (in-person or online)
  • As we all have painfully come to know, normally a handful of people (in many cases only 1-2) individuals coordinating the group and meetings
  • Probably didn’t ask the question properly, but nonetheless it appears the groups are split about 50-50 on private/industry sector vs. government individuals; and
  • Meeting agendas/discussion tends to focus about 50-50 on local/regional issues vs. statewide issues

Biden’s Infrastructure Bill

I included the question about meeting content (local level vs. state level) to get a sense of the discussion as to who/what may be directing the narrative.  Why, you say?  How about Biden’s $2.3B Infrastructure Plan.  Rarely has so much federal money been allocated which links itself to local and regional GIS programs.  Roads, buildings and utilities, bridges, public transit, water and sewer systems, disaster resiliency, public schools, and much much more.  Large amounts of geographic features and systems best managed at the local level.  And with local resources.  If not local and regional governments themselves then with trusted consultants and business partners.  Engineering consultants with broad and capable geospatial capacity.

Yes, the time for local and regional geospatial programs to proactively and reach out to state organizations such as the NYS Association of Towns, NYS Association of Counties, ot NYS Conference of Mayors to work towards making sure this new funding sources are secured for local use and application in the geospatial space..  As well as enhancing collaborations and efforts with professional organizations such as the New York State Society of Professional Engineers and New York State Association of Professional Land Surveyors which have an established presence in Albany.

Of course state assets are in play with regard to this funding, but local and regional geospatial programs, in May 2021, cannot afford to sit on the sidelines to wait and later find out distribution of this new federal funding is going to state programs first and being left to fight for the remaining scraps. And/or left to some funding distribution formula which included no local and regional geospatial programs input.

Time now for local and regional GIS/geospatial programs and organizations to mobilize on this funding opportunity.

Senate Bill S1466

Hello, McFly? Anybody home?  Anybody watching and monitoring anything with regard to the state legislature and legislation which is connected  to the Empire State geospatial space?  In the big scheme of things, S1466 probably doesn’t amount to much but it does seem something is amiss in the broader context when the words Geographic Information Systems Mapping Technology are used in describing any proposed New York statewide legislation and it goes completely under the radar screen without review and input from the statewide geospatial community. Can’t say absolutely no discussion because something, on some level, some people, somewhere, were talking and exchanging information to frame the legislation.  Was the Association part of that discussion?  Or maybe your Geospatial Advisory Committee?

And a bigger head scratcher is connecting the state GIS office with “strategic planning and municipal study assistance”.   Specifically the proposed legislation reads, in part:

“The usage of available floor space within a given political subdivision
is a critical detail. Evaluation of floor space usage allows the local
area to understand how buildings are being used, and evaluate whether
new zoning or construction plans are needed to stimulate activity in
certain sectors. However, conducting a study through questionnaires and
or geographic information mapping (GIS) technology is difficult and
costly for local entities. On the other hand, the Office of Information
Technology Services already maintains statewide GIS information and can
readily adapt that material for more specific purposes.”

This legislation would allow towns, villages, cities, and counties to
request GIS and study assistance from OITS to undertake a review of
floor space usage. Such assistance could include specific GIS maps,
online questionnaires, and other technological methods that would assist
the conducting of such studies.

Maybe I need to get out more.  Granted, if passed, the whole process of ITS of getting involved presumably wouldn’t happen unless requested locally, though it is interesting to see this office ready to provide these professional services.  Also, interesting it hasn’t ruffled a few feathers in the professional planning and GIS consultant communities as well.  NYS Association of Regional Councils?

Almost two years ago I made reference to a similar geospatial community asleep at the wheel legislative moment with regard to Senate Bill 9061 involving Google Maps.  Have there been similar pieces of legislation?  In absence of full-time staff – including an Executive Director who can operate in the Albany space – its almost an impossible task on staying on top of pending legislation proposed by others.  To say the least of identifying sponsors and proposing legislation for the benefit of the industry and membership.

One way or another, the legislative space is where the Association needs to expand and build capacity.   Thus far it hasn’t been easy and will continue to be difficult to do so.


The Art of Geospatial Collaboration: Allegany State Park Interactive Viewer

Cattaraugus County and Allegany State Park Share Resources and Vision

While GIS as a shared service as part of Governor Cuomo’s County-Wide Shared Services Initiative (CWSSI) has yet to take hold in a broad context across local governments in the  Empire State,  the statewide GIS community does have a great example to highlight how local governments can collaborate with a state agency in sharing geospatial technology.  Case in point:   The Allegany State Park Interactive Map viewer.

Located in Cattaraugus County in western New York abutting the Pennsylvania state line and  north of the Allegheny National Forest, Allegany State Park was created in 1921 and encompasses nearly 64,800 acres.   A major western New York State tourist attraction – the park averages  1.5 million annually – the park offers a wide range of four-reason recreation activities and lies within the Alleghany Highlands Forests ecoregion.   The idea of a joint effort between  Cattaraugus County and Allegany State Park online map viewer idea goes back as far as 2010 as part of a discussion between Daniel T.  Martonis, who at the time was GIS Manager for the County and Tom Livak who was then Director of Economic Development, Planning & Tourism.

The initial viewer was more emergency services focused with the collection of infrastructure data and intended for use by park staff only – nothing external.  Most of the data was collected by Dan and Tom, including Chris Holewinski – the current Cattaraugus GIS Manager – using various Trimble GPS units as well as utilizing old engineering maps.  The trio even brought out metal detectors to pick up the locations of pipes.   At the time, Dan was building web mapping applications with ArcIMS that Dan mentions was not “people friendly” and was ultimately discontinued by ESRI.  Along the way, though, both Dan and Tom knew they were beginning to frame a web mapping product which would be of great value to both the County and ASP.  ArcGIS Online began to emerge as a more functional and adaptable web mapping platform providing additional opportunities for the two government programs to build upon what had been started.

The ASP viewer represents the ongoing collaboration between Cattaraugus County and Allegany State Park. It provides easy to use access to a facility, environmental, and cultural data including historic aerial photography.

Continue reading

10 Questions / Preguntas: Daniel Munoz

Daniel Munoz, GIS Manager, Orange County GIS Division, has been an integral part of the Orange County GIS program for over twenty years and involved in geospatial initiatives in municipalities across the county as well.  Somewhat atypical of how other county programs across the Empire State originally evolved, Daniel led implementation of the countywide effort from its beginning from inside the Orange County Water Authority and later on overseeing development into key enterprise programs in the areas of Real Property Tax Services and Emergency Services.  With Spanish being his native language, I also asked Daniel to offer any thoughts/ideas on how to expand and provide geospatial tools to the growing Spanish speaking populations across the Empire State. In further supporting this issue, this eSpatiallyNewYork post is published in both Spanish and English.

Daniel Muñoz, Gerente del SIG, Condado de Orange División de SIG, ha sido una parte integral del programa SIG del Condado de Orange por más de veinte años y también ha participado en iniciativas geoespaciales en los municipios del condado. Un poco diferente de cómo evolucionaron estos programas en otros condados en el Empire State, Daniel dirigió la implementación de los esfuerzos del condado desde el inicio en el Departamento de Agua del Condado de Orange y luego supervisó el desarrollo de programas claves en las áreas de Servicios de Impuestos de Bienes Inmuebles y Servicios de Emergencia. Como el español es su lengua materna, también le pedí a Daniel que ofreciera conceptos / ideas sobre cómo expandir y proporcionar herramientas geoespaciales a las crecientes poblaciones de habla hispana a través del Empire State. Para respaldar aún más esta situación, esta publicación de eSpatiallyNewYork es disponible tanto en español como en inglés.

1.  eSpatiallyNewYork: Let’s start from the beginning.  Where are you originally from and when/how did you end up in Orange County government?

Munoz:  Here is the short story! I’m originally from Mexico City where I earned my Professional Engineer (P.E.) stripes.   I graduated as an industrial engineer from the Autonomous Metropolitan University of Mexico City and initially worked as computer system analyst for an international kitchen appliance company. I was fine with reading English and working with computers programing languages, but struggled with conversational English.  Since I had friends in the city,   I decided to move to Boston, Massachusetts to learn English.  While there I met a woman from Orange County which I married and ultimately moved to Orange County.

eSpatiallyNewYork:  Empecemos por el principio.  De donde eres originalmente y cuando o como terminaste en el gobierno del Condado de Orange?

Munoz: Esta es la historia corta! Soy originario de la Ciudad de México donde obtuve mi titulo de Ingeniero.   Me gradué de Ingeniero Industrial  de la Universidad Autónoma Metropolitana de la Ciudad de México inicialmente trabaje de Analista de Sistemas de Computación para una compañía internacional de electrodomésticos de cocina.  No tenia problemas leyendo ingles y trabajando con lenguajes de programación de computadoras, pero me costaba trabajo el inglés conversacional. Decidí mudarme a Boston, Massachusetts para aprender inglés ya que tenia amigos en esa ciudad. Allí conocí a una mujer del Condado de Orange con la que me casé y finalmente me mudé al Condado de Orange.

2.  eSpatiallyNewYork: What were your earliest Orange County GIS efforts?

Munoz:  I started with the Orange County Water Authority (OCWA) which is a “cousin” of county government.  My title then was digital systems analyst, which in hindsight, was “being in  the right place at the right time”. When I moved here, Orange County had not developed an E-911 system, but OCWA had started gathering  various databases and integrated computer mapping technology to create a county wide Geographic Information System.  Which ultimately led to  OCWA starting  to  serve a significant  supporting role in developing the new computerized E-911 system.  It was during this time I developed my own passion for GIS technology.   Since then I have learned about and worked in the fields of emergency management, planning, tax mapping, public works, and many other areas of county government.  We are providing and integrating data for all services!

eSpatiallyNewYork: ¿Cuáles fueron tus primeros esfuerzos de SIG en el Condado de Orange?

Munoz:  Comencé trabajando para Orange County Water Authority (OCWA) la cual es un agencia del gobierno del Condado de Orange.  Mi título entonces era analista de sistemas digitales, en retrospectiva, fue “estar en el lugar correcto en el momento adecuado”. Cuando me mude aquí, El Condado de Orange no había desarrollado el Sistema E-911, OCWA había comenzado a recopilar varias bases de datos y tecnología integrada de mapeo por computadora para crear un Sistema de Información Geográfica para todo el condado.  Lo que finalmente llevó a que OCWA comenzara a desempeñar un importante papel de apoyo en el desarrollo del nuevo sistema computarizado E-911. Fue durante este tiempo que desarrollé mi propia pasión por la tecnología SIG. Desde entonces, he aprendido y trabajado en los campos de gestión de emergencias, planificación, asignación de impuestos, obras públicas y muchas otras áreas del gobierno del condado. ¡Estamos proporcionando e integrando datos para todos tipo de servicios!

3.  eSpatiallyNewYork: Do you remember the version of ARC/INFO you got started with and what ESRI products are you using today?

Munoz:  Oh boy.  I do and this really dates  me!   My GIS experience didn’t start with ARC/INFO, I started with ArcView 1.0 with option to update to 1.0a.  I still have the box almost intact with the 5¼” installation floppy disks (picture below). We did most of the work with ArcCAD an ESRI plugin for AutoCAD. My first interaction with ARC/INFO was at Version 7. Nowadays we try to keep up to date as much as possible but avoiding the “bleeding edge”. We are in the process of moving our full enterprise GIS to V 10.6.1. I use the full ArcGIS suite including  ArcServer and  ArcMap with the following extensions:  Network Analyst, Spatial Analyst and 3D Analyst.   I have tried ArcGIS Pro but still has some issues.  As far as the web environment, I created all of our websites with the old ESRI flash builder and have started to update them with Web AppBuilder.

Like many others across the state, Daniel got his start with desktop ArcView software.  Still an ESRI favorite to seasoned GIS professionals.

eSpatiallyNewYork:  ¿Recuerdas la versión de ARC/INFO con la cual comenzaste y que productos de ESRI usasactualmente?

Munoz:  Ay Caramba! Recuerdo bien y revela cuanto tiempo ha pasado! Mi experiencia en SIG no comenzó con ARC/INFO, comencé con ArcView 1.0 con la opción de actualizar a 1.0a. Todavía tengo la caja casi intacta con los discos de instalación de 5¼ ” (imagen abajo). La mayor parte del trabajo fue echo con ArcCAD una extensión de ESRI para AutoCAD. Mi introducción con ARC/INFO fue en la versión 7.0. Hoy en día tratamos de mantenernos actualizados tanto como sea posible, pero evitamos estar a la “vanguardia”. Estamos en el proceso de actualizar nuestro completo SIG a la versión 10.6.1. Uso el paquete completo de ArcGIS, incluyendo ArcServer y ArcMap con las siguientes extensiones: Network Analyst, Spatial Analyst y 3D Analyst. He tratado ArcGIS Pro pero todavía tiene algunos problemas. Entorno de la web, construí  todas nuestras paginas de web con la antigua tecnología de flash pero ya comencé a actualizarlos con la tecnología de Web AppBuilder.

4.  eSpatiallyNewYork: You left GIS  for a while to take another position in County Information Technology –  but then came back to GIS.  Tell us about that.

Munoz:  For me,  GIS & IT always go hand to hand.  While working  for the County,  I always found myself splitting my work projects between GIS & IT.  At the beginning of my career in order to build a better GIS program I had to build a better IT infrastructure.   During this time, I obtained a Windows & Network professional certification. Having this expanded  IT background gave me the opportunity to move to an IT Director position which at the time was a good professional advancement for me.   Two years ago, the County decided to upgrade the County’s  GIS and I was asked  to be part of the team to interview  candidates and  proposals. Going through this process reminded me how much I enjoyed geospatial technology so I made the decision to move back to managing the Orange County GIS program.

eSpatiallyNewYork:  Dejaste el SIG por un tiempo para tomar otra posición en el departamento de Información Tecnología del Condado – pero luego regresaste al SIG. Platícanos a cerca de esto.

Munoz:  Para mí, el SIG & la IT siempre van de la mano. Mientras trabajaba para el Condado, siempre me encontraba dividiendo mi tiempo y proyectos de trabajo entre SIG y IT. Al comienzo de mi carrera, para construir un mejor sistema de SIG tuve que construir una mejor infraestructura de IT. Durante este tiempo, obtuve una certificación profesional de Windows y Redes. Teniendo esta experiencia ampliada en IT me dio la oportunidad de cambiarme a un puesto de director de IT, lo que en ese momento fue un buen avance profesional para mí. Hace dos años, el Condado decidió actualizar el SIG del Condado y me pidieron que formara parte del equipo para entrevistar a los candidatos y sus propuestas. Ser parte de este proceso me recordó lo mucho que disfrutaba la tecnología geoespacial, así que tomé la decisión de regresar a dirigir el SIG del Condado de Orange.

5.  eSpatiallyNewYork: So which areas of County government are the biggest users of geospatial technology?

Munoz:  Definitely Emergency Services!   They have three divisions working  24×7 using and creating data everyday.  Second would be the Planning Department and following very close the Department of Public Works.

eSpatiallyNewYork:  Entonces, ¿Qué áreas del gobierno del Condado tiene los mayores usuarios de tecnología geoespacial?

Munoz:  Definitivamente el departamento de Servicios de Emergencia! Este departamento tiene tres divisiones que  trabajan 24×7 usando y creando datos todos los días. Segundo sería el Departamento de Planificación y siguiéndolo muy de cerca el Departamento de Obras Públicas.

6.  eSpatiallyNewYork:  The County still offers hardcopy maps, shapefiles, and other products for download.  How has this changed, if at all, over the years?

Munoz:  It seems that technology is always driving the associated GIS changes.  The GIS offices are quieter these days as the phones don’t ring as much.  We use to answer the phone constantly to take requests, return calls to inform the caller their  request had been completed.  Today, our online automated GIS request website has taken care of many of these issues.   Individuals can create accounts, make  mapping or data requests, and be notified when the request has been fulfilled with instructions on how to obtain the request.  The website also has an area for data downloads and can notify registered users when County data layers have been updated by our staff.

eSpatiallyNewYork:  El Condado todavía ofrece mapas impresos, shapefiles y otros productos para descargar. ¿Cómo ha cambiado esto, si es que ha cambiado, con los años?

Munoz:  Parece que la tecnología siempre está impulsando los cambios asociados al SIG. Las oficinas de SIG son más silenciosas en estos días ya que los teléfonos no suenan tanto. Solíamos contestar el teléfono constantemente para recibir pedidos, devolver llamadas a nuestros usuarios para informarles que su pedido esta completo. Hoy en día, nuestro sitio de web tiene un sistema de pedidos automatizados y se ocupa de muchos de estos problemas. Las personas pueden crear cuentas, realizar pedidos de mapas o datos y recibir notificaciones automatizadas cuando el pedido se haya cumplido e instrucciones sobre cómo obtenerlo. El sitio web también tiene un área para descarga de datos y puede notificar a los usuarios registrados cuando nosotros actualizamos las bases de datos del Condado.

7.  eSpatiallyNewYork: Any integration with the AutoCAD environment?

Munoz:  Currently, a  small group of engineers from DPW and the tax mapping division are the only ones that still use AutoCAD.  Some years ago the tax mappers started to maintained the parcel boundaries from their tax maps in  an enterprise database with AutoCAD.  As  previously mentioned, our current  GIS upgrade project includes moving the full tax map maintenance program  to our ArcGIS environment.  Stay tuned!

eSpatiallyNewYork:  ¿Alguna integración con el programa de AutoCAD?

Munoz:  Actualmente, solo un pequeño grupo de ingenieros de el Departamento de Obras Públicas y la división de mapas de cadastro son los únicos que todavía utilizan AutoCAD. Hace algunos años, los mapas de cadastro se comenzaron a mantener a través de una base de datos con AutoCAD. Como se mencionó anteriormente, nuestro proyecto actual de actualización del SIG incluye mover el programa de mantenimiento de mapas de cadastro a nuestro sistema de ArcGIS. ¡Mantente al tanto!

8.  eSpatiallyNewYork:  As GIS Manager, what are your biggest challenges today?

Munoz:  I would have to say staffing.  Believe it or not in the last two years I have had to replace the GIS technician positions four times.  While each time each person has been  a competent young professional,  It seems to me the new generation of GIS technicians wants to keep moving on with the next opportunity for advancement.  As opposed to staying in one place for while and building a career in one place.   I find myself training people to see them gone within  6 – 12 months.   A huge challenge!

eSpatiallyNewYork:  Como Gerente de SIG, ¿cuáles son tus mayores desafíos hoy?

Munoz:  Tendría que decir que es el personal. Lo creas o no, en los últimos dos años he tenido que reemplazar las posición de técnico en SIG cuatro veces. Cada vez la persona ha sido un joven profesional competente, pero me parece que la nueva generación de técnicos en SIG siempre anda buscando la próxima oportunidad de avance. A diferencia de permanecer en un lugar por un tiempo y construir una carrera en ese lugar. Me encuentro entrenando personas para que desaparezcan en los próximos 6 – 12 meses. ¡Un gran reto!

9.  eSpatiallyNewYork: What’s the next big geospatial thing in Orange County?

Munoz:  The County is finalizing the Orange County Shared Services Property Tax Savings Plan.  One section in particular reads:

The County of Orange will offer geographic information services (GIS) to any and all of its 43 municipalities. This will include all cartography and geographic data services such as map development, maintenance and printing.

Coordinating and standardizing 43 municipalities will be our biggest project and will keeps us busy for a good while.  I’m hoping for staff continuity!

eSpatiallyNewYork:  ¿Cuál es la próxima gran cosa geoespacial en el Condado de Orange?

Munoz:  El Condado está finalizando el Plan de Servicios Compartidos de Ahorro de Impuestos de la Propiedad del Condado de Orange. Una sección en particular dice:

El Condado de Orange ofrecerá servicios de información geográfica (SIG) a todos y cada uno de sus 43 municipios. Esto incluirá todos los servicios de cartografía y servicio de datos geográficos, como el desarrollo de mapas, el mantenimiento y la impresión.

Coordinar y estandarizar 43 municipios será nuestro mayor proyecto y nos mantendrá ocupados por un buen rato. ¡Espero y el personal sea continuo entonces!

10.  eSpatiallyNewYork:  You are of Hispanic background.  Do you have any thoughts or ideas on how GIS technology could be extended to the regional Spanish speaking population?  Where and how would you start?

Munoz:  The beauty of GIS is that it can help everyone in so many ways.  But the challenge continues to be building applications which are relevant, accessible, and easy to use.  Research show that Hispanics are less likely to have an internet connection at home.  Hispanics are early technology adopters, and Hispanics are mobile-first community. These statements contradict each other a bit but it is because the Hispanic demographic is young. Based on this information I would focus available resources to build, design and post GIS apps in Spanish on mobile platforms (cell phones and tablets) where we know Hispanics are spending their time. These early adopters will spread the message among their social groups faster than any other method.

eSpatiallyNewYork:  Eres de origen hispano. ¿Qué piensas o que ideas tienes sobre cómo la tecnología de Sistemas de Información Geográfica (SIG) podría extenderse a la población regional de habla hispana? ¿Dónde y cómo empezarías?

Munoz:  Lo bonito del SIG es que ayuda a todos, pero debemos asegurarnos de distribuirlo a ellos. Las investigaciones demuestran que los Hispanos tienen la menor probabilidad de tener una conexión de internet en casa, los Hispanos adoptan la tecnología tempranamente y son una comunidad que usan los dispositivos móviles primero. Estas declaraciones se contradicen un poco, pero es debido a que la demografía hispana es joven. Basado en esta información yo pondría todos los recursos disponibles en crear, diseñar y publicar aplicaciones de SIG en plataformas móviles (teléfonos celulares y tabletas) donde sabemos que los Hispanos pasan la mayoría de su tiempo. Estos pioneros difundirán el mensaje atreves de sus redes sociales más rápido que cualquier otro método.

10 Questions: Christine Gayron, Gayron de Bruin Land Surveying and Engineering, PC

Christine Gayron currently serves as President of Gayron de Bruin Land Surveying and Engineering, PC (GdB) based in Melville, New York.   The company provides a wide range of geospatial products and services for clients in the Empire State.  As part of eSpatiallyNewYork’s continued effort to reach out to the statewide geospatial professions, we were able to meet and have a conversation at the 2019 New York State Association of Licensed Surveyors (NYSAPLS) annual conference.

eSpatiallyNewYork:  GdB was created in 2010.  The company has made a lot of progress in a relatively short period of time and adding a lot of new technologies along the way – GIS, drones, laser scanning, etc. – how is the company making it all happen?

Gayron:  I only hire people who are awesome. They are the ones who make it happen. I just bring in the work and create a company culture that makes the employees want to be the best at what we do. I have to credit my partner, Greg de Bruin, for constantly pushing the envelope, and insisting on investing in technology, and Jason Graf, my partner in charge of operations, for putting the technology in everyday use. Greg introduced GIS in the 90’s before I started my career. I actually think my contribution was my ability to run the business and bring work in, creating a revenue stream that would allow us to afford to make the investments. So I grew the company and oversaw things and generated profit, while the technology nerds in the company figured out how to customize software and put new technology into use.

eSpatiallyNewYork: Tell me a little bit about your education.   B.S. in Geology – how did you make the jump to surveying?

Gayron: I have a BA in Geology from CUNY Queens College and a minor in secondary education. I thought I was going to be an Earth Science teacher, but a month into student teaching, I realized teaching was not for me. I wasn’t sure what to do. My stepfather saw an ad in the paper for GIS Specialists at an engineering firm called A. James de Bruin & Sons, the predecessor firm to Gayron de Bruin.  It was in Bethpage, NY, the next town over from where I live. I had taken one class in GIS in college. The mapping aspect of geology interested me more than the rocks and minerals part, so I applied for an entry level position. I was hired to draft utilities and base maps for utility company conduit design drawings. Then I worked with one of the engineers on the conduit design. I designed hangers to support conduits underneath a couple of bridges over the Long Island Expressway (LIE).   I also designed horizontal directional drilling of conduit underneath the LIE. When the conduit design work dried up, I started doing more boundary surveying and control surveys for NYSDOT.  I used GIS to plan control networks.  At 23 years old, I was managing design survey projects. There was lots of opportunity at the small family owned firm and I was good at seeing what needed to get done. As I approached licensure in 2010, my boss, Greg de Bruin, and I decided to partner and form Gayron de Bruin.  It was time for Greg to start planning for retirement and I was the successor.

eSpatiallyNewYork:  Early on, traditional surveying and engineering companies were a bit slow embracing GIS technology/software but today this intersection is complete.  GdB is part of the ESRI Partner Network and has ArcGIS Online Specialty Did GdB have ESRI capacity from the beginning?

Gayron:  We’ve always been an ESRI shop. We saw how ESRI had discounted licenses for schools and government and we knew that was key. As we are geospatial data collectors and data managers we push GIS as a data management tool to our clients.  We try to provide this to all of our clients. GIS is just one of the tools in the toolbox. It used to be a hard sell to get clients to use GIS, but ArcGIS Online (AGOL) has made that a lot easier because we can set up the GIS tools, bring the data in, and show them how to view, analyze, and manipulate it.

eSpatiallyNewYork:  Are the new/younger generation of surveyors – and engineers – who are just getting into the work force have a broad enough understanding/experience with GIS software?

Gayron:  We hire a lot of people right out of college with GIS education. We find that they have a basic understanding of what it can do, but how we use it in surveying and engineering is usually new to them. Most of it is learned along the way. I think this is true of most industries – college gives a basic foundation and only scratches the surface. Getting into the workforce is where the detailed applications and user expertise is developed.

eSpatiallyNewYork:  Speaking of data, what has GdB’s experience been in obtaining government data?  I see that elevation certificates and tax parcel data are key business components in your space.    What’s been your experience in getting this digital data across New York State?

Gayron: Orthoimagery has been very attainable and useful. Parcel data is useful for elevation certificates as you suggested. Tax map line work is valuable for getting an idea of what the parcel layout may look like, but it can be deceiving. We try not to use it on our drawings because we are licensed land surveyors and if we put a line on the drawing, it’s got to be in the right place. We love to see government offices scanning their maps and storing them in a GIS and making them available, but this is still rare.

eSpatiallyNewYork:  Drone technology is becoming a geospatial game changer.  What’s the GdB read on this evolving technology?

Gayron: So drones are all the rave, but they are really just another cool option in the geospatial tool box – a glorified robot camera holder.   It’s really the software that connects drone flights to GPS and uses drone photography to create point clouds and 3D surface models that I find impressive. Like other tools such as LiDAR, it is the accurate and precise control that yields accurate 3D models. The software is key in reconciling the data with the ground control.

eSpatiallyNewYork:  This is impressive  – “GdB is ranked in POB Magazine as one of the top 100 Geospatial firms in the United States.”

POB magazine gathered data in 2015 and 2016 on revenue in the geospatial community. I’m attaching the articles so you can see how they used the data to rank firms. They stopped doing it after 2016, but I’m certain we would rank even higher on the list now!

eSpatiallyNewYork:  How does Honeoye Falls, New York fit into the GdB business plan? It’s a long way from your Long Island headquarters!

Honeoye Falls is just outside of Rochester. So we wanted to expand the company and it seemed we had the choice to expand geographically providing the same services or we could expand our range of services to include more civil engineering. We decided to stick with what we are good at and do it farther away. My partner, Jason Graf, LS, found New York State Department of Transportation (NYSDOT) data available online. It listed NYSDOT projects by location and contract budget. He manipulated the data in GIS and created a heat map to see where NYSDOT was spending the most money. The New York City area glowed the brightest, of course. The next “glowiest” cities were Buffalo, Rochester, and Syracuse. With Rochester in the middle of those three cities, it seemed like a place to look into. We had some contacts there and did our research. Within one year of starting to think about a Rochester office, we had the branch office open with 5 employees. 18 months later, we have 11 employees and they are all busy! Scott Smith, LS, the Branch Manager, is building an all-star team upstate. I truly believe that the bringing on the right people drives our success. As we grow, we are putting effort into making our operation more structured and efficient, but as stated above, we only hire people who are awesome, and I want them to feel appreciated for their ideas and contributions.

eSpatiallyNewYork:  What are some of GdB’s current larger or unique projects using geospatial technologies? 

Power companies are putting out very large corridor projects requiring surveying and mapping of several miles along a proposed power line route. I think these projects are coming about as new forms of energy generation are being developed. They need transmission lines to connect the new power plants, solar panel fields, and wind farms to traditional power grids. We also do large mapping projects for design of infrastructure in New York City. The city’s infrastructure is crumbling and needs upgrading. One of the first steps is mapping the existing conditions. These jobs are always a huge rush.

eSpatiallyNewYork: Considering all of GdB’s business – what is the breakdown between private and business clients? 

Most of our work is for government agencies. The breakdown is aboutt 80% government agency work, and 20% private clients.

eSpatiallyNewYork: Tell us about the online teaching you do through GeoLearn?

I met Joe Paiva, the founder of GeoLearn, before I got licensed because I took his review course when I prepped for the Licensed Land Surveyor test, and then I would see him at conferences a couple times per year. Joe is an excellent presenter. Joe knew that I was doing some presentations to professional organizations and he knew that my company was using GIS and other new technologies in Land Surveying – so he asked me to present courses on GIS for GeoLearn.  I prepared power point slides just like I would for a live presentation. I flew to GeoLearn’s studio in Kansas City to record them. It’s actually much easier to present this way, because you only have to present 10-15 minutes at a time to create the segments. Being in the studio was a very cool experience!

eSpatiallyNewYork:  Work aside, I understand you’re a triathlete and compete in many similar events.  What’s next on your calendar? 

Last year, I qualified for XTerra World Championship race in Maui. This is an off-road triathlon consisting of an ocean swim, mountain bike, and trail run. Unfortunately, I was injured a couple weeks before the race and didn’t go. This year, I am not signed up for any races, which is an interesting experiment, because I’m still training, but without the pressure of an upcoming race. So I know I’m doing it because I really love it. I usually wake up at 4:30am and train early in the morning. I’m done by 8am in time to get my kids off to school and get to work. I am married to a NY City Firefighter and we have three amazing children, who are very active. Right now, I’m ok with putting my racing career on hold to attend their lacrosse games, concerts, and cheer competitions.

Contact:

Christine Gayron, President
Gayron de Bruin Land Surveying and Engineering, PC
cgayron@gayrondebruin.com