Geospatial Public Health Research in the Empire State

It was at the 2015 NYS GeoCon Conference in Albany that I saw only a portion of Dr. Tabassum Insaf’s presentation entitled “Lessons Learned in Small Area Spatial Analyses of Health Outcomes” which started an interest in the state of applied GIS/geospatial activity in medicine and health care across the Empire State.  Having yet to approach the topic as part of eSpatiallyNewYork and finding an almost complete absence of health sciences content at the exact same state GIS conference this past fall in Lake Placid, I decided to circle back to Dr. Insaf to see if I could begin to scratch the surface on the use of geospatial in the NYS  health sciences research communities.

The Albany Connection

After initiating my correspondence with Dr. Insaf, the use of geospatial technologies in academic health care research across the Empire State became apparent..  Given the presence of NYS Dept. of Health in Albany, research in this space at the SUNY Albany School of Public Health is an obvious location.  Further review of the subject matter identified similar research programs at other academic institutions including Columbia University, New York University, and CUNY.

Like several other New York State Department of Health (NYSDOH) Research Scientists, Dr. Insaf holds an appointment at the School of Public Health.  At NYSDOH, Dr. Insaf is the Acting Research Director at the Bureau of Environmental and Occupational Epidemiology.  Her research interests are in understanding the role of environmental, social and behavioral factors in health disparities. Her work encompasses longitudinal and multilevel data analysis, Geographic Information Systems (GIS) technology and spatial epidemiologic methods.

With regard to the shortage of health sciences presentations at New York State GIS conferences, Dr. Insaf suggests the issue may be threefold:  (1) While the use of geospatial technology is common in their work, results in this space are often not presented or used as maps or other visual aids. (2)  Health data is often confidential and locations cannot  be published, and  (3) there may be more due to a lack of awareness in the health community that there may be interest and audience for this type of work in the GIS community.

Illustrative research efforts of Dr. Insaf include:

Social Determinants of Health for Low Birth Weight (LBW)

This research utilizes a variety of NYS public health records with the intent of better understanding and identifying potential social determinants of low birth rates focusing on data from selected census tracts in the metropolitan areas of Buffalo, Rochester, Albany, and Westchester/Long Island.   Applying geoprocessing tools and analysis, research findings suggest that census tract-area proportions of LBW was highest in areas with larger Hispanic or Black populations and high smoking preferences.  Spatial Regression analysis was used to  predict prevalence of LBW based on these major social determinants to identify areas of high risk of LBW.

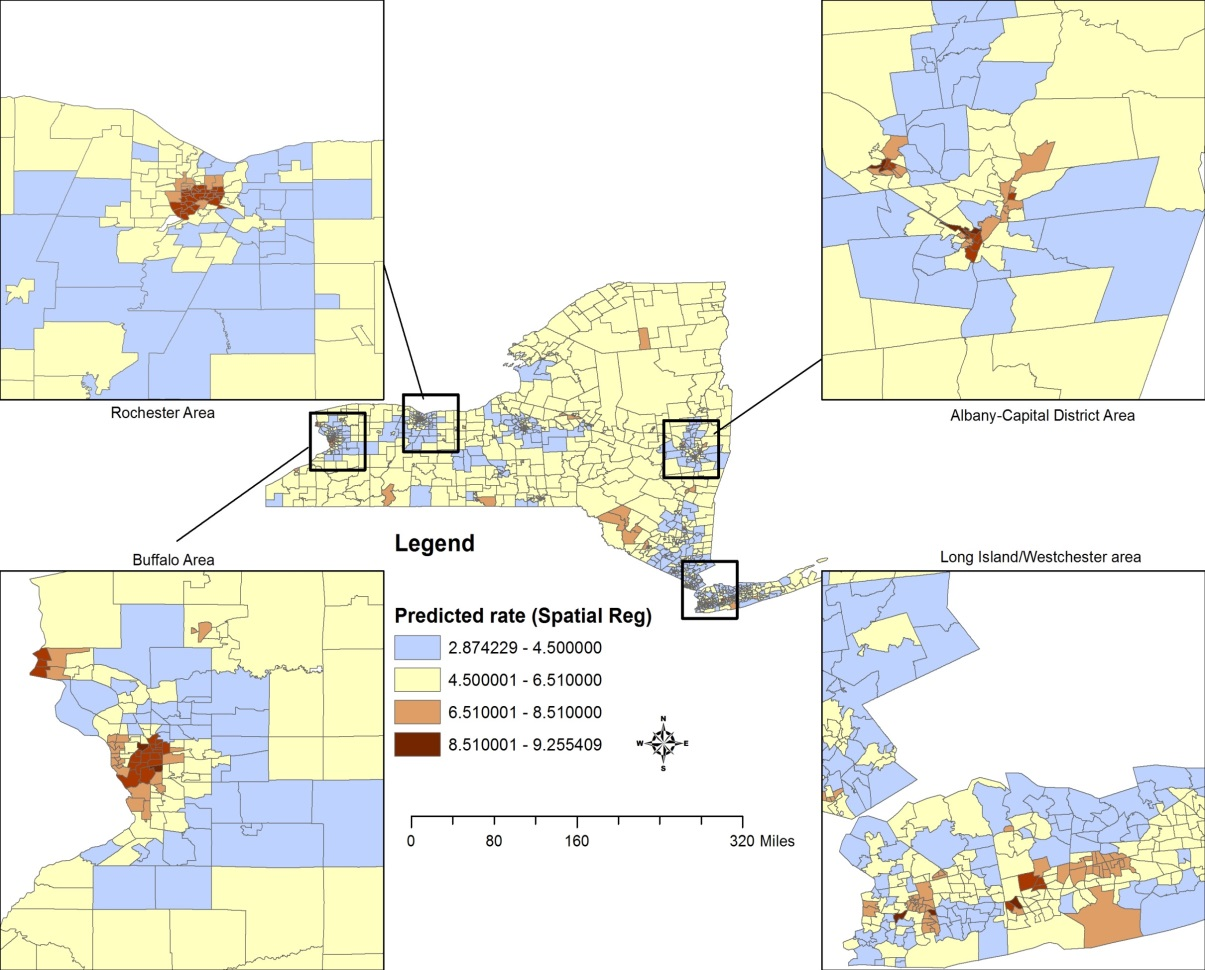
Predicted rates (%) for low birth weight prevalence based on a spatial error model that incorporates social determinants as race/ethnicity, prenatal care, smoking prevalence and maternal education.

It’s worth noting that her work in this space included collaborating work with Tom Talbot, now retired, who was an early champion of GIS technology in NYSDOH.

Health Impacts from Increased Temperatures Due to Climate Change

More recently Dr. Insaf has been working with several state agencies (bringing together New York State Department of Health, Florida Department of Health and New York City Department of Health) to develop indicators of localized climate trends, review and develop public health relevant heat warning messaging and develop local assessments of vulnerability to extreme heat for specific communities using remote sensing data from NASA satellites.

The team has worked with multiple stakeholders and collaborators including the CDC Environmental Public Health Tracking Network, State Climatologists, National Weather Service offices, NYS Department of Environmental Conservation, Office of Emergency Preparedness and local county health departments to develop climate information relevant to their mandates and jurisdictions.  Researchers  spatially linked satellite derived modeled data for air temperatures and heat index at a 12KM resolution with geocoded health outcome datasets (Hospitalization and Emergency Department visits for heat stress, renal disease and cardiovascular disease).  The team then estimates the risk of adverse health outcome for each 5-degree change in temperature and have also developed heat health profiles combining heat, health and vulnerability indicators for each county. The county profiles will be available soon as downloadable pdfs at the NYS Department of Health Climate, Weather and Health website.

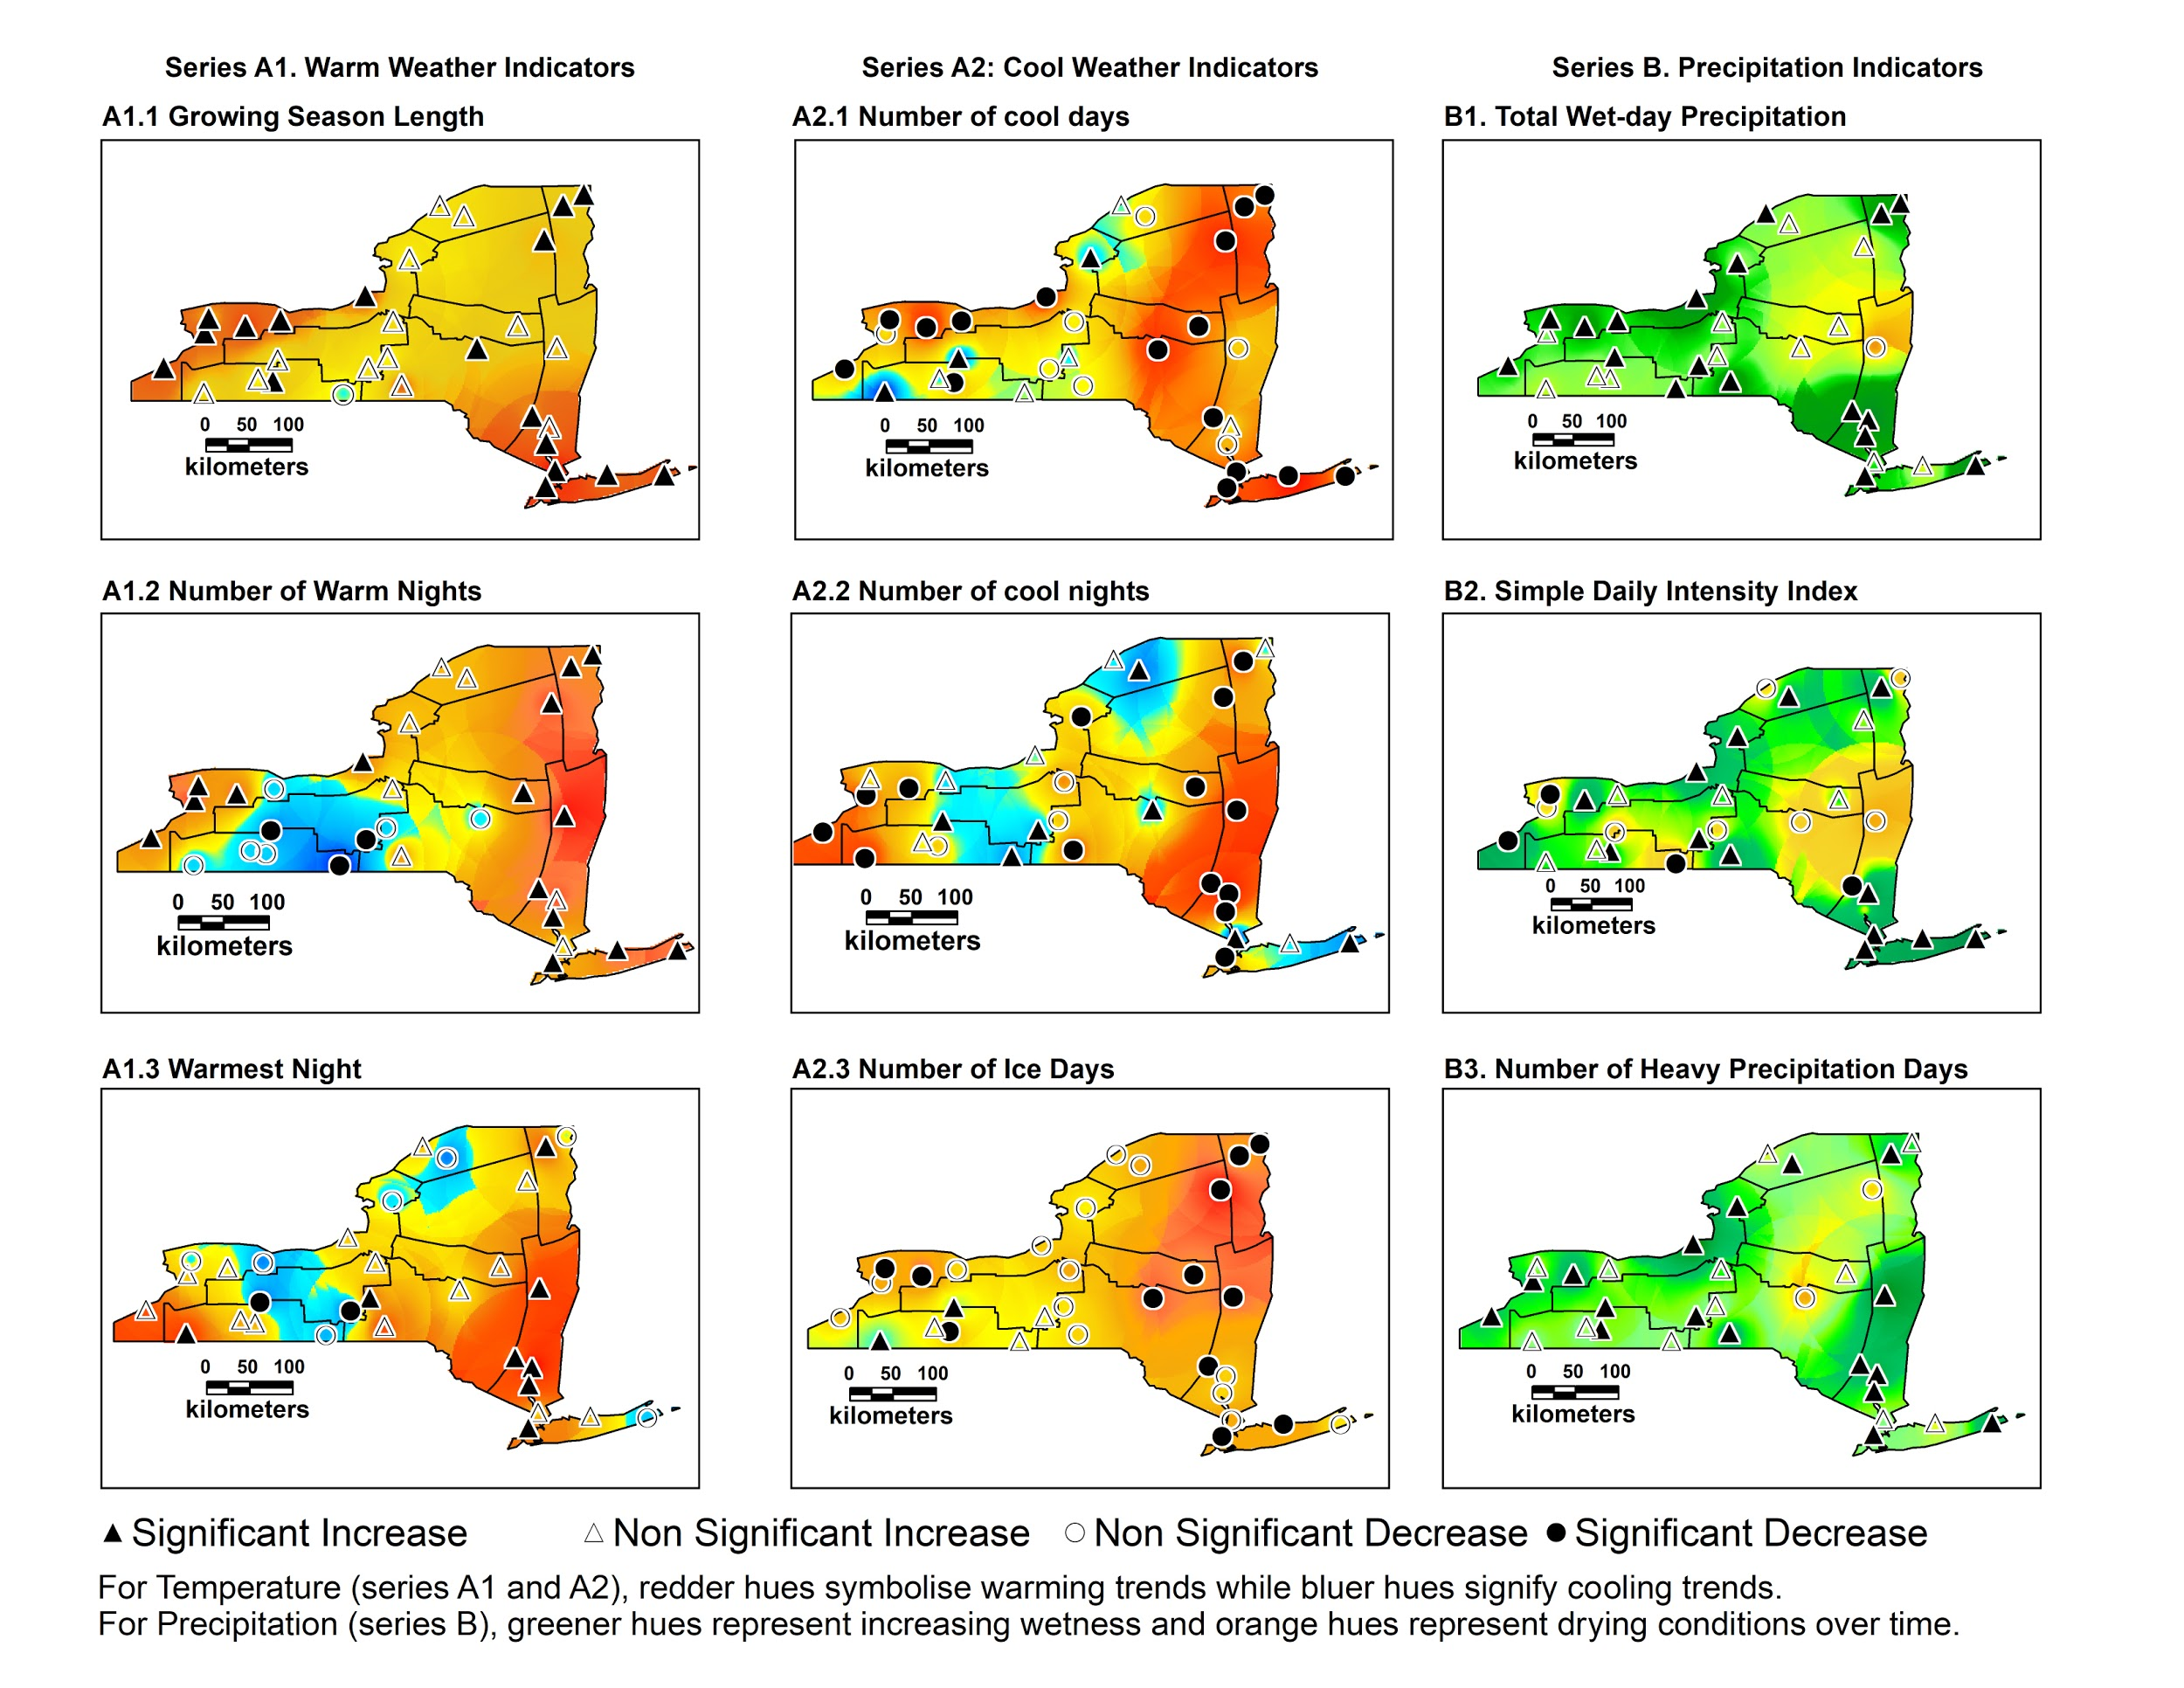
The initial assessment of Climate in NYS that was the springboard for this more recent work is published here.  In an analysis of the U.S. Historical and Climatology network dataset for the 60 year period of 1948-2008 it was found that the most representative extreme weather indicators in NYS for warm weather are growing season length and warm nights. The most representative indicators during cold weather are a decline in cool days and ice days.  Most other temperature indicators are also consistent with the warming trend.    The precipitation indicators in the study report all point towards increasingly wet conditions over time.  The most representative indicators were total precipitation and the simple daily index.  Data also suggests the Great Lakes, Northern Plateau, Champlain Valley and Coastal New York regions may be particularly sensitive to changes in extreme climate events.

The map shows the predicted rates (in %) for low birth weight prevalence based on a spatial error model that incorporates such social determinants as race/ethnicity, prenatal care, smoking prevalence and maternal education.

Her team is currently using a spatially contiguous satellite derived dataset to build upon this work and to estimate health risks of heat exposures in rural and urban areas of New York. She is working with the National Weather Service offices to inform guidance on heat warning issuance in the area based on local thresholds.  The ongoing work is sponsored through a NASA ROSES (Research Opportunities in Space and Earth Sciences) grant. A great poster presentation on this work can be found here.

Estimating Health Care Access Times

Dr. Insaf has been focusing research on data from a newly established congenital heart defects (CHD) surveillance program funded by the Center for Disease Control (CDC).  Analysis uses geocoded data from surveillance datasets to determine patient access times to Cardiac Surgical Care facilities using the Google driving distance/time Application Programming Interface (API).  These driving time estimates are then compared against travel times from the same address using public transit (where available in more urbanized areas).   It is widely accepted that differences in travel distance to appropriate care among individuals with birth defects can have a significant impact on healthcare utilization, and it has been suggested that geographic barriers may play a role in cessation of care among those with CHDs.

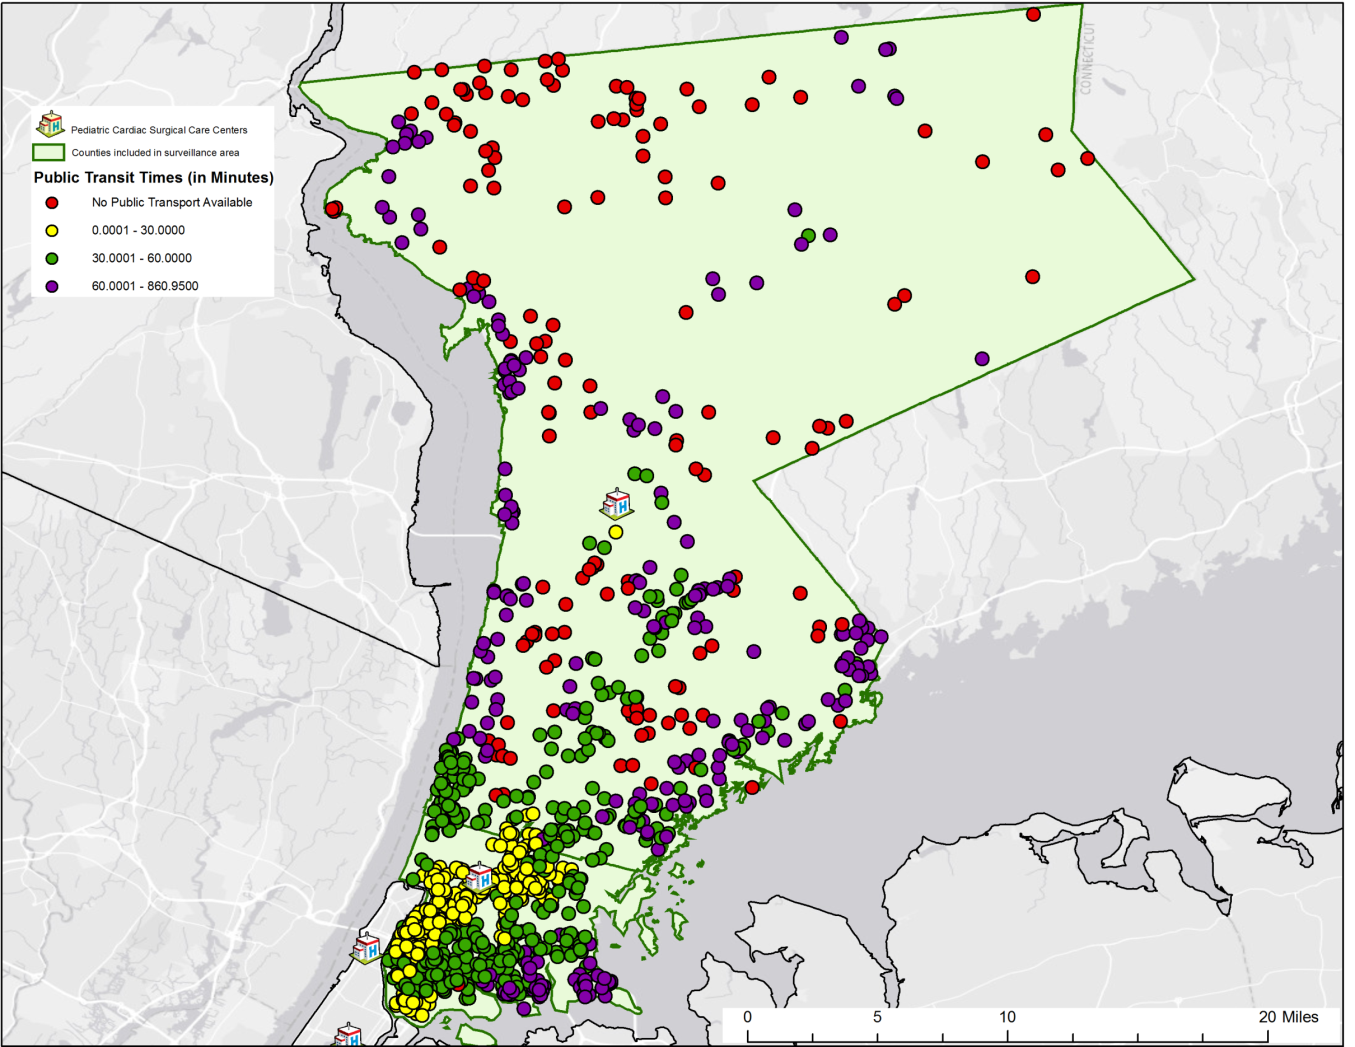
Calculated drive times in minutes for congenital heart defects patients to Cardiac Surgical Care facilities in Westchester County and the Bronx.

Other Representative Statewide Efforts

Dr. Glen Johnson, Associate Professor in the Department of Environmental, Occupational and Geospatial Health Sciences at the City University of New York School of Public Health, focuses geospatial aspects of health, with particular application to environmental and community-level social determinants of health outcomes. Research in the Bronx  includes examining the relationship between walkable access to healthy food sources (HFS) and the risk of anemia in pregnancy.   After geocoding patient residences, street network distances were obtained for the closest healthy food sources, which were identified from multiple databases.  For lower-income patients, as indicated by Medicaid or lack of health insurance, those who lived less than 0.25 miles from a healthy food source were less likely to be anemic when compared to those who lived farther away.  Patients with commercial insurance showed no effect.  These results continue to help to understand how a nutritionally-mediated condition such as anemia during pregnancy can be affected by one’s built environment, while also highlighting the importance of conditioning on socioeconomic status for these types of studies.

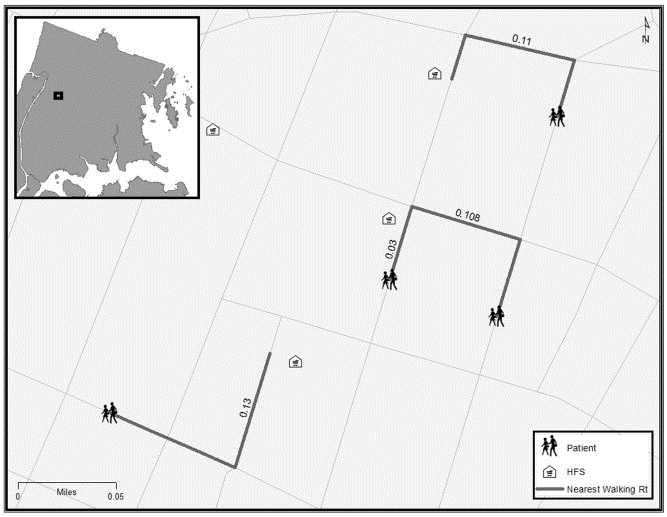
The primary variable of concern in the Bronx study: The street network walking distance to a Healthy Food Source (HFS) for a pregnant woman.

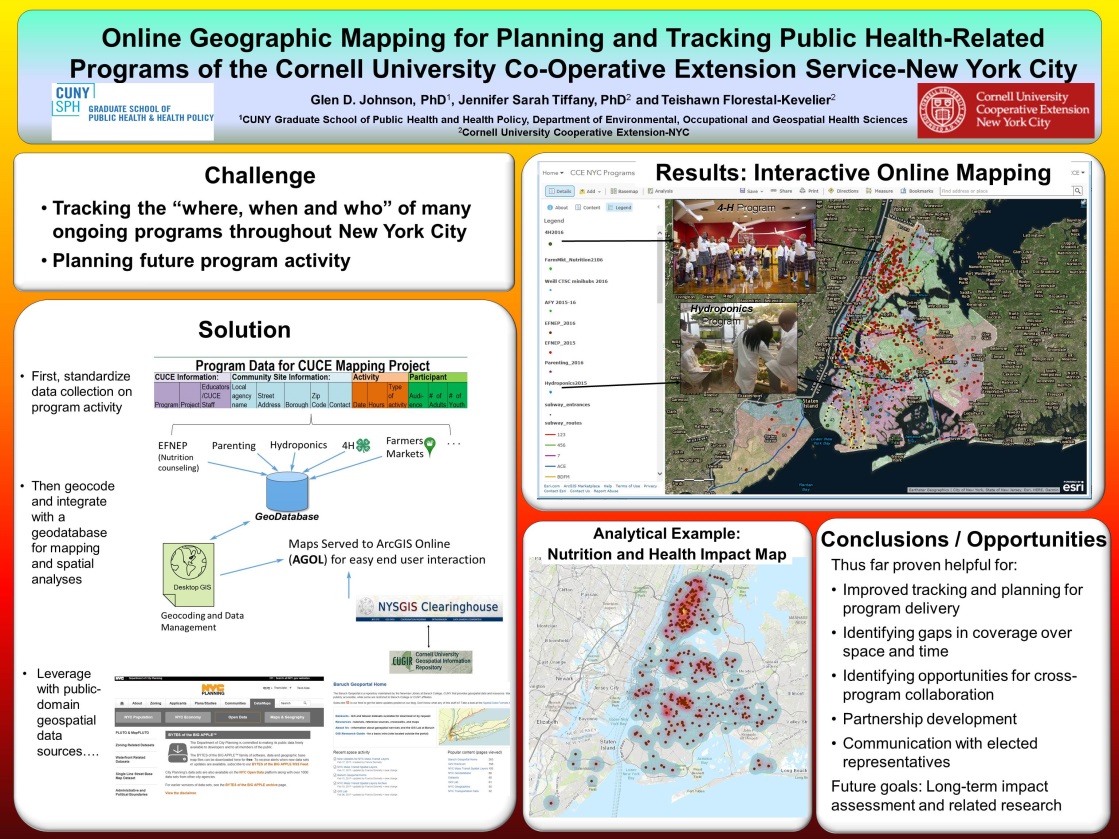
Most recently he has been working with the Cornell University Cooperative Extension (CUCE) who implement multiple programs aimed at improving overall population health in communities throughout NYC.  Examples range from community-based educational programs in nutrition and parenting to 4-H STEM programs for children.  Keeping track of the “where, when and who” of many ongoing programs in the largest city in North America is challenging. Online GIS mapping has provided a partial solution to this management challenge.  The poster below was presented at the New York State Health Foundation conference last December.

Johnson’s work also appears as  “A Community Needs Index for Adolescent Pregnancy Prevention Program Planning: Application of Spatial Generalized Linear Mixed Models” in . Maternal and Child Health Journal.  He is a former biostatistician for the New York State Department of Health and a faculty member of the University at Albany School of Public Health.

Also at  CUNY  Dept. of Environmental, Occupational, and Geospatial Health Sciences is Dr.Andrew Maroko, Associate Professor. Past research involves the use of geospatial tools focusing on the health outcomes of (unhealthful) food-and-beverage advertising in subway stations  This research focused on the correlations between ad exposures and sugary-drink consumption, fruit-and-vegetable intake, and diabetes, hypertension, and high cholesterol rates. Subway-station ads for “less-healthful” items were located disproportionately in areas home to vulnerable populations facing diet and diet-related-health challenges. The fact that uneven ad placement did not relate to total rider counts suggests ads were not directed at the largest possible audiences but rather targeted to specific groups.

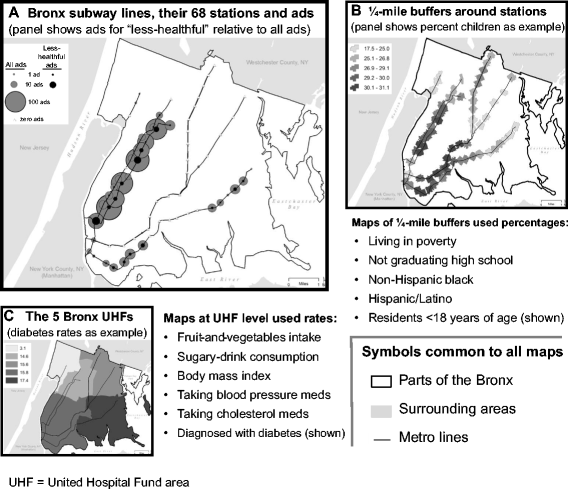
Ad placement did not relate to the number of riders entering at stations. Instead, exposure to food-or-beverage ads generally, and to “less-healthful” ads particularly (specifically ads in Spanish, directed at youth, and/or featuring minorities), was directly correlated with poverty, lower high-school graduation rates, higher percentages of Hispanics, and/or higher percentages of children in surrounding residential areas.

Other Maroko NYS geospatial-based research work includes “Integrating Social Determinants of Health With Treatment and Prevention: A New Tool to Assess Local Area Deprivation” and “Direct observation of neighborhood stressors and environmental justice in the South Bronx, New York City”.

Dr. Jessica Athens at New York University School of Medicine, Department of Public Health, is part of the Health Geographics Research Initiative (Health GIS).   One of her primary focuses at the present is City Health Dashboard presents data on health outcomes and the upstream determinants of health for 500 Cities across the U.S.  Her team produced a pilot version with four cities which can viewed at www.cityhealthdashboard.com. Starting on May 15, the site will include data for 500 cities will be available at the same URL.

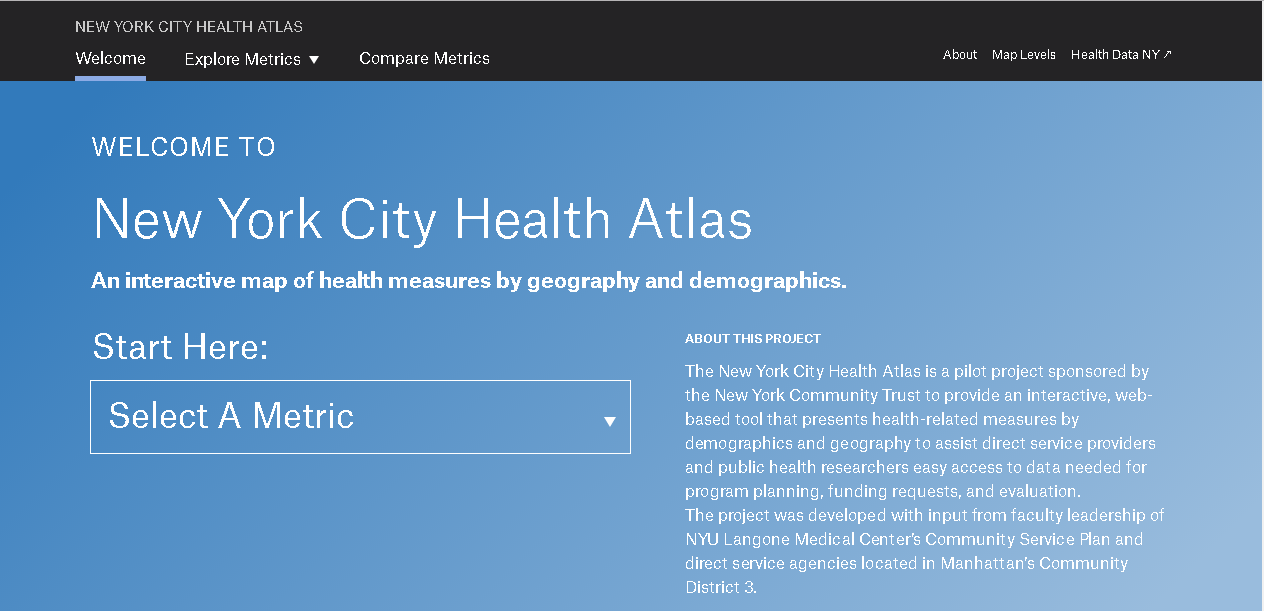
Dr. Athen’s other work includes the NYC Health Atlas which is sponsored by the New York Community Trust. The application provides direct service providers and public health researchers easy access to data needed for program planning, funding requests, and evaluation.

Also in the region at Columbia University, Department of Psychiatry, Division of Child and Adolescent Psychiatry, Drs. Christina Hoven, George Musa and Lupo Geronazzo-Alman are working on several projects using geospatial analyses to understand the effects of neighborhood quality, safety and socioeconomic status on psychopathology.

Summary

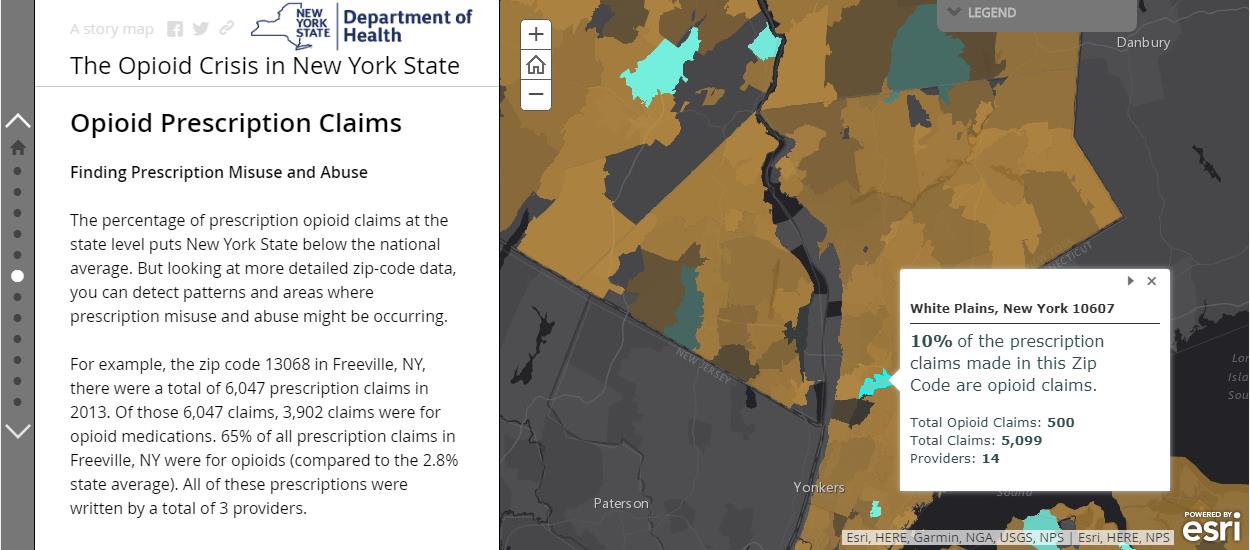
The combination of  world renown medical research facilities and the growing use geospatial technologies at  these organizations is an evolving environment the New York State GIS community should take advantage of and nurture.   As we find ourselves amidst major public health challenges impacting our communities from issues such as the growing influence of Climate Change, the spread of infectious diseases, and the ubiquitous opiod crisis among others, the use of geospatial tools in collaboration with the health care research community will bode well for increasing the visibility of the profession across the Empire State.


Geospatial Technologies at St. Lawrence University

The 2017 New York State GeoCon in Lake Placid provided the opportunity to for me to catch up with several statewide colleagues which will be reflected in at least a couple upcoming blog posts.  As part of these discussions, I ended up connecting with a familiar Empire State GIS person of interest:  Carol Cady – who serves as GIS Specialist/Map Librarian at St.Lawrence University (SLU) in Canton, New York.  Our discussion and follow-up communications certainly highlight a wide range of geospatial activities in the state’s North Country which the SLU GIS program is a significant contributor.

Carol directs the GIS project which is housed in the Libraries and Information Technology Division.  Unlike many of the New York State public university geospatial programs, the SLU program is not associated with a specific academic curriculum or major.  She and other GIS program staff provide instructional, technical and research geospatial support to the entire university community in the use of geospatial software and technology including Remote Sensing and Global Positioning Systems (GPS).

Carol arrived at SLU in 2002 to oversee and manage the GIS program.  Before her arrival, the SLU GIS program had been established in the early 90’s by Professor Bill Elberty who was a Geography Professor and for whom the current GIS lab is named after.  Professor Elberty taught GIS courses which provided the foundation for many current GIS professionals across New York State.  After Professor Elberty retired in 1999 the GIS program data and software was moved to the Science Library.

Prior to accepting the SLU position, Carol served as a GIS Analyst for Fort Drum Natural Resources Branch as a contractor. Carol’s background is in biology with a BS from UMass- Amherst and a Masters in Zoology at the University of Vermont.   She was introduced to GIS as land management tool while a seasonal wildlife technician for US Fish & Wildlife Service at Moosehorn Refuge in Calais, ME.   She then returned to UMass to learn more about GIS with coursework in the Wildlife Department.

GIS Facilities and Academic Offerings

The principal location for GIS and GPS instruction at SLU is the Elberty Laboratory for Spatial Analysis.  The lab includes 15 dedicated GIS workstations, printing and plotting devices, field tablets, and both Trimble and Garmin GPS units.  Increasingly, smartphones using the ESRI Collector and Survey 123 apps are being used in field data collection efforts.  Both Carol and GIS/GPS technician Dakota Casserly offer support to the SLU community in a variety of software packages including ArcGIS, QGIS, Google Earth, IMAGINE, IDRISI, and NASA’s WorldWind.

On a regular basis, Carol teaches both Intro to Geographic Information Systems (with lab) and Directed Studies in Geology GIS classes and occasionally Advanced GIS and Intro to Geospatial Technologies.  GIS concepts are incorporated in other courses in the areas of Conservation Biology, Global Studies, Environmental Psychology.

Carol is assisted by Dakota Casserly, St. Lawrence University GIS/GPS Technician who is involved in the program on many levels including designing and guiding projects with student GIS technicians and teaching introductory sessions or specialized topics like GPS and Network Analyst.  A project he has recently completed is the Laurentian Legacy project.

Mapping the Laurentian Legacy is a partner project between the University’s Donor Relations department and the GIS Program. The web app provides interactive and searchable access to the University’s named spaces database.

Projects and Activities:

The GIS program at SLU provides support to many local and regional geospatial efforts.  The program has a long  relationship with the St. Lawrence Land Trust having provided maps for base line and yearly evaluations of easements.  Recently, SLU GIS staff, along with Jess Rogers, Assistant Professor, Biology/Environmental Studies, SUNY Potsdam, and Alex French, Sustainability Coordinator, Clarkson University conducted a suitability analysis to find large privately owned forested properties which meet Land Trust criteria to put lands into a protected easement.  More recently, Carol’s Intro to GIS has been involved in a suitability analysis to identify non-forested properties in all of St. Lawrence County that may meet Land Trust easement criteria.  In 2013 Dakota’s predecessor, Jonathan Ignatowski, worked with the St.Lawrence County Health Department to identify houses built before the early 1970s and may contain lead paint.  This was part of a larger project to help with lead paint remediation for household owners.

One SLU project which was of particular interest to me is the June 2017 Death in St. Lawrence County (DSLC) Project that began an archeological excavation at the St. Lawrence County Poorhouse Cemetery in Canton, NY.  As a result of decades of erosion, the cemetery had a number of graves at risk of washing away into the Grasse River.  While the original goal of the project was to identify and exhume at-risk graves, identify the individuals using forensic techniques, and re-inter the remains elsewhere on the property. Unfortunately, Mindy C. Pitre, an assistant anthropology professor at St. Lawrence University, who was overseeing the project said she and her team of students discovered that very little remained of the bones at the gravesites they dug closest to the Grasse River.  As a result, the bone could not be examined and information such as gender and age could not be determined, she said. The deteriorated bone fragments were returned to where they were found and reburied.  It was felt that continuing any further would have done more harm than good by removing it, so the project was stopped.  Nonetheless, the project did include the use of state-of-the-art geospatial tools including high resolution GPS data and 3-D photogrammetric software to record and digitally preserve the archeology. This project was presented as a poster at the Lake Placid conference.

Additional examples of student projects focusing on American Kestral nesting sites, Brook Trout spawning sites, wind turbine placement relative to hawk migrations, and the effects of St. Lawrence County land use changes on grassland bird habitat can be found on the SLU GIS landing page.

Working Partners:

Collaborating organizations in the North Country recognize SLU’s GIS contribution in regional geospatial efforts.  Notes Jason Pfotenhauer, Deputy Director. St. Lawrence County Planning Office:

“The St. Lawrence County Planning Office has had a long relationship with the GIS lab at St. Lawrence University having worked with Carol Cady for many years, as well as several of her mapping technicians.  We traveled to numerous State GIS conferences and NYS geo-spatial summits together and have had approximately 10 SLU students work with our office in various capacities.  Two recent larger scale county projects were the result of Carol’s willingness to supervise graduating seniors with strong GIS skills.  For the first, Carol took the initiative to pursue Walker Fellowship funding so that Sean Gannon could receive a paid internship and create the initial dataset for the County’s Agricultural Atlas.  The second project involved the collection of raw U.S. Census data to depict housing and socioeconomic data at the census tract level (which is not readily available on existing regional, state or federal websites).  Dylan Arpey undertook this initiative to help inform the County’s Assessment of Fair Housing.

The GIS lab staff have also provided us with valuable technical assistance that improved our capabilities in preparing maps for county constituents.  Most recently Dakota Casserly and Carol provided a tutorial on how to geoprocess tiffs in order to create digital models of hard copy flood plain maps.”

Star Carter, GIS Supervisor, Development Authority of the North Country (DANC) adds:

“The St. Lawrence County university/college GIS people are all fantastic and very worthy of recognition!  I work with the SLU crew a few times a year to get data or share data for infrastructure in the Village of Canton.  It’s a good relationship.  DANC has hired graduates and summer interns from both SLU and SUNY Potsdam.  A former DANC GIS Specialist graduated from SLU and is now in grad school in Colorado; and a current DANC GIS Technician graduated from SUNY Potsdam.  All of these graduates came out of their programs with enough GIS skills and practical experience to hit the ground running and be valuable employees right away.  So, from the hiring perspective of a local employer, having these GIS programs available at local universities is very important to keeping me supplied with a competent workforce”.

Summary

The St. Lawrence University GIS program illustrates the growing presence – and importance – of the New York statewide network of university programs which support regional and local GIS initiatives.   In absence of paid consultant assistance, University programs can often provide a certain level of geospatial support to governments and organizations with limited funding or geospatial capacity.  While several Empire State college programs offer both B.S. and advanced degrees in geospatial technologies, non-degree academic programs such as SLU offer high quality geospatial academic training, combined with applied field experience that adequately prepares students for a variety of geospatial workforce occupations.

For more information on the St. Lawrence University GIS Program, contact Carol Cady at ccady@stlawu.edu.


Best of the Show: New York Giant Traveling Map

While the recent statewide GIS conference in Lake Placid featured several presentations and vendor displays in emerging  areas of geospatial development across the Empire State, one presentation –  and an interactive one no less –  was certainly one of the most refreshing and welcomed.  Why’s that, you ask?  Well, consider the following:   (1) it contains  no technical jargon or  software programming speak,  fancy charts or diagrams, (2) has connections to the  educational community, (3) applicable anywhere in the Empire State,  (4) absolutely and completely different, and  (5) suitable for all ages –  Rated “G”!  Yes, the New York Giant Traveling Map which was presented by Susan B. Hoskins, Senior Extension Associate at Cornell University.

Susan B. Hoskins demonstrates use of the NYS Giant Traveling Map to conference attendees during 2017 GeoCon in Lake Placid. Note: No shoes allowed – the geoenabled version of the game Twister?

The Map

In celebration of the 30th anniversary of state geographic alliances, National Geographic produced a Giant Traveling Map for each state.  Two copies were gifted to the New York Geographic Alliance in 2016 headed by Timothy McDonnell, geosciences faculty at Monroe Community College in Rochester.  Since then the New York 4-H Geospatial Sciences program has gotten involved to help promote the map in 4-H programs and classrooms statewide.  The 4-H Geospatial Science and Technology Program, within Cornell Cooperative Extension, provides educator professional development in GPS, GIS and the tools of remote sensing.  The geography lessons learned on the Giant Traveling Map are fundamental to using technology in map making.  Many youth and adult mentors take these skills and technology lending library and apply them to community mapping projects.

The Giant Traveling Map of New York, measures 15 X 20 feet and includes major cities, water bodies, mountains, Indian Reservations and National Parks.

The map “kit” comes complete with a curriculum of six activities that help youth explore map features and symbols, grids, map scale, orientation and direction, and the basics of Geographic Information Systems.  Props included in the kit are orange cones for marking points, yellow plastic chain, blue yarn and a ball of string to map “linear features, a compass rose and map legends.  Teachers and users of the map can determine how far is it from New York City to Albany by comparing one’s foot to the scale bar and walk along the Hudson River.  Or finding the Erie Canal?  Follow the canal path from Albany to B-uf-fa-lo-ooo, just like the song.

To date, the following schools and organizations have hosted the Map:

Additionally, McDonnell states: “The Map can be used in middle schools to support 7th Grade curriculums for social studies which includes New York history and geography”.  The Geographic  Alliance  maintains other resources specifically designed for middle school including  The Atlas of New York: Legacies of the Erie Canal and Lessons for the Atlas of New York.  More information can be found under the Resources link on their website.

The Map Travels to Westchester County

After  the Lake Placid conference, the Map traveled to Solomon Schechter elementary school in White Plains where it was used by 4th grade teacher  Amy Sroka who expressed accolades after having used the map..  After a week in the classroom, one of Ms. Sroka’s students commented:

I learned a bunch of names of different towns and cities. It was really fun trying to find the locations of a lot of the places. While I was studying the map, I discovered that there are actually so many more mountains in New York State than I had thought there were…I really enjoyed the map!”

If your school, family gathering, or organization is interested in using the Map, contact Tim McDowell at the New York Geographic Alliance.  It is also available for sale through National Geographic for $750.

10 Questions: Jonathan Cobb


I’ve had the pleasure of knowing Jonathan Cobb for nearly two decades.  As part-owner of Waypoint Technology Group based in Albany, Jonathan and his company product line and services are well recognized to the New York State geospatial community.  Waypoint is also a long-time supporter of many statewide geospatial events and programs.  I had the chance to catch up with Jonathan at 2017 GeoCon in Lake Placid to discuss some of Waypoint’s current business efforts and new trends in GPS-related technology.

eSpatiallyNewYork: How did you get started with Global Positioning Systems (GPS) technology and the story behind Waypoint Technology Group?

Cobb: As with so many career trajectories, mine was circuitous and unplanned.  After growing up in western New York and graduating from the University of Rochester with a dual degree in Mechanical Engineering and Geology, I relocated to the Albany area to begin my professional career as a junior engineer/geologist.  It was in this capacity where I was first introduced to GIS technology.  It was 1990 and I was assigned to work on two projects that involved the siting of new sanitary landfills.  GIS was the underlying technology that was used to determine the relative favorability of candidate sites.  While not a GIS practitioner, I worked closely with my firm’s in-house GIS technicians to develop the relevant graphical overlays and to compute various quantitative values that were used to support the siting process. Simultaneously, I was consuming all of the written material I could find that related to the growing application of GIS technology, and became intrigued with what was at the time the poorly understood commercial potential of the global positioning system (“GPS”).  Shortly thereafter, and with the help of my business partner Greg Hunt, Waypoint Technology Group  (“Waypoint”) was born.

eSpatiallyNewYork: You’ve been a Trimble distributor for many years.  These relationships are still strong moving forward?

Cobb: Within one-year of forming Waypoint we were approached by Trimble to represent their interests in the northeastern United States – but most especially New York – as a distributor of their mapping, GIS, and land surveying solutions.  That was nineteen years ago and yes, we’re still going strong.  Our current portfolio of Trimble solutions now includes robotic total stations for land surveying and 3D scanners, which have become very accessible – from both an economic and functionality perspective – in recent years.  In addition to Trimble, we also represent Laser Technology, Inc. (“LTI”) is a leading manufacturer of professional measurement solutions, based primarily on laser technology.  LTI’s products fulfill an important niche for our customers, both in stand-alone form as well as in conjunction with Trimble solutions.

eSpatiallyNewYork: Smartphone technology has significantly changed field data collection.  How has this changed your business model?  Who is using what?

Cobb:  We refer to the deployment of smart phones (as well as tablets) for the purpose of geospatial field data collection as a manifestation of the Bring-Your-Own-Device (“BYOD”) revolution.  This development is something of a double-edged sword in that the ease of smartphone-driven app-based data collection effectively brings that power to anyone with a device and a data plan (i.e. virtually the entire population); at the same time, questionable claims of positional accuracy coupled with the absence (often) of authoritative  metadata persist.  This has resulted in manufacturers such as Trimble developing compact, lightweight, high-performance GPS receivers for the express purpose of pairing wirelessly with smartphones in order to bring professional-grade positional accuracy to the masses.  With respect to the impacts on our business model, I’d say the key differences are two-fold.  One – professional grade solutions are no longer the sole province of larger organizations or those with substantial technology budgets and/or in-house IT resources; and two, the use of smart phones and apps has spawned an entirely new breed of services (e.g. data collection apps, differential correction data streams) that are built upon pay-as-you-go or subscription-based revenue models.  

eSpatiallyNewYork:  What’s the composition of your client base in 2017?  (i.e., Surveying/engineering, general data collection, academic, recreational)?

Cobb:  Waypoint is fortunate to have cultivated a diverse customer base over our nearly two-decade existence.  While the distribution varies on an annual basis, our active customers are comprised of an approximately even split between the private and public sectors.  Within the private sector, consultants (e.g. engineers, land surveyors, ecologists) make up the largest segment, while in the public sector, local and state government agencies dominate, followed by the federal government.  Academic institutions make up less than 10% of our customer base in any given year, but are significant in that the instructional and research arms expose students – future potential clients – to our portfolio of solutions.

eSpatiallyNewYork:  What percentage of our business are repeat customers?  How might current market place factors be affecting your client base?

Cobb:  We add new customers on a weekly basis, but the vast majority of our customers are of the long-term/repeat variety.  This is partly due to the nature of the technological solutions that we sell; that is, once a customer has made an initial investment in hardware and software — and very often, training – switching to a different platform can be cost-prohibitive.  In addition, many customers elect to protect their investment through annual hardware warranties, software maintenance, and technical support service contracts.

Going forward, the migration toward “bring your own device” solutions and software-as-a-service solutions promises to tilt our business model into one that is more heavily reliant upon recurring revenue.  For example, in addition to subscription-based software applications which are now ubiquitous, we are seeing a transition to short-term pay-as-you-go, differential correction data streams to improve the positional accuracy of the location services technology that is onboard consumer devices, such as cell phones and tablets.  This innovation opens the door to high-accuracy position determination for a potentially large segment of end-users that would have otherwise been unreachable due purely to cost.        

eSpatiallyNewYork:  Waypoint has worked internationally.  Tell us or highlight some of these clients and their projects.

Cobb:  In addition to supplying the United Nations with solutions that have been deployed in challenging political regions, including Lebanon, Eritrea, and Senegal, we have provided on the ground training and consulting services at the American University of Kosovo (“AUK”), in the young nation’s capital of Pristina.  AUK is affiliated with Rochester Institute of Technology (“RIT”), and it was through our long history as an RIT vendor that we were invited to participate on that project, which also included training services for engineers in Kosovo’s nascent national electric power transmission authority.  We have also supported RIT’s other international efforts through the donation of hardware and software to support humanitarian missions in Haiti and Rwanda.

eSpatiallyNewYork:  What’s the coolest or most unusual client application you’ve worked on using GPS technology in New York State?

Cobb: Great question.   With such a diverse clientele this is a difficult one to answer, but if pressed, I think I’d have to settle on one of the many unique applications of 3D scanning technology that has been led by a member of Waypoint’s staff.  The project focused on the precise recording of the existing conditions of the roof of the New York State Capitol in Albany.  This was in support of an architectural restoration project and is an excellent example of the utility of 3D scanning.  Another one was performing a similar function in an abandoned elevator shaft.  But for me, the most interesting application was deploying the scanner to capture a three-dimensional representation of a remote and difficult to access bat cave in support of research related to the devastating and widely-publicized white-nose syndrome.

eSpatiallyNewYork: What do you see as the next big “GPS” technology advancement?

Cobb:  Hmmmmm…….the “next” big advancement has arguably been commercially viable for several years.  That is, the transition from GPS-only solutions to GNSS-based solutions.  Specifically, this refers to GPS as strictly the American satellite constellation, whereas GNSS (global navigation satellite system) is intended to incorporate ALL constellations, including American, Russian, European, and Chinese.  The growth of GNSS-based solutions, which translates to the ability to acquire and continuously track many more satellites, has allowed for accurate positioning in previously challenging conditions (e.g. urban canyons, dense forests).  The transition from GPS to GNSS has been so profound, that even the lexicon has evolved:  we now routinely use “GNSS” in place of “GPS”. Beyond that, component miniaturization, extended battery life, and of course, the rapid proliferation of drone technology will continue to significantly impact the geospatial data capture landscape for years to come and GPS/GNSS will continue to be an important part of that evolution.

eSpatiallyNewYork:  If you had your way, what’s the one GPS “investment” you’d like the NYS geospatial government and business community to make?

Cobb:  Education and training.   Acquiring hardware and software is simple; trivial even.  I’d like to see a greater proportion of technology resources devoted to understanding the capabilities – and importantly, the limitations — of geospatial technology, rather than that aspect being treated as an afterthought.  The vast majority of questions that we field from end-users relate either to software operations or positional accuracy concerns.  For many organizations, a modest investment in comprehensive training would not only result in measurably superior positional accuracy, but it would also improve productivity.    

eSpatiallyNewYork:  Career Reboot:  What would you be doing if it wasn’t Waypoint?  Mason? Hockey player?  Teacher?  Sous Chef?

Cobb:  If I wasn’t working full-time at Waypoint, I would probably occupy time melding my dual interests in geospatial technology and world travel.  I’ve had the good fortune in recent years to blend these passions for both business and recreational purposes, and I have every intention of continuing.  Ironically though, I’ve found that the most memorable experiences occur when you leave the technology behind, ignore the map and the Yelp reviews, and just let the road lead you.


2017 GeoCon Wish List: Part II

In January of this year, I published my first 2017 GeoCon wish list relative to geospatial mapping applications and topics I’d like to see as part of the Lake Placid October 17-19 conference.  Since January, writing and publishing eSpatiallyNewYork has enabled me to communicate with a wide range of individuals and organizations involved in geospatial programs across the state  – some of which are included in the list below.  Others itemized on the list are new business start-ups,  government and nonprofit initiatives, and programs involved in the emerging drone technology.

So without any further adieu, here is Part II itemizing geospatial topics and program areas I’m advocating for 2017 GeoCon in Lake Placid.  Speakers, presentations, and ideas to mix things up and start some new discussion – and why.

Opioid Crisis Mapping

With the opioid crisis well documented in New York State, Story Mapping and data visualization help further detail the magnitude of this public health issue to a much wider audience.  Story Maps also enable authors with much greater flexibility in developing a narrative to accompany the data which might be otherwise be difficult to interpret or understand with just a map by itself.  Here in New York, it’s the hope to see greater use of Story Mapping (not just ESRI’s solution – all platforms) by agencies and organizations which historically have been reluctant to publish maps due to concerns of data which might be sensitive or misinterpreted.  This Opioid Story Map provides a powerful message and can prove to be a catalyst in seeing other statewide public health data being published in a similar geographic format.  It would be interesting to hear more from this Story Map author(s) about the datasets used (availability, sensitive/non-sensitive, sources, etc.) and possible collaboration with other GIS programs and agencies at the federal, state, and local level.  See also the Northern Kentucky Story Map:  The GEOStory of Opioid Addiction and The Urban Observatory: The Opioid Epidemic.

Story Maps provide an easy and powerful framework to combine narrative and maps which is often very helpful when publishing sensitive or “difficult” to interpret data. Publishing agencies have can better help how data is interpreted and read.

New York State Wildland Fire Mapping

Nothing special or cutting edge here geospatial, but I’ve always had a soft spot for wildland fire maps having served on U.S. Forest Service interregional fire crews back in the day in both Idaho and Montana.   Though in context of publishing fire data, it’s unfortunate how little capacity New York State Department of Environmental Conservation (DEC) has built in context of publishing their data and products as services. Not that statewide wildland fire data and map services would be a top seller for DEC, but the image below (scrapped from the DEC website) speaks to the continued reliance on static maps and other enterprise map applications  which cannot be consumed by other viewers.  The map is actually interesting in showing how there are more fires per square mile closer to urban areas (red) than in the more forested areas such as the Adirondacks – where most would think wildland fires occur and with more frequency.   Publishing this type of data as some type of map service would Continue reading

2017 GeoCon Wish List: Part 1

I first wanted to publish this article initially as a wish list to the GIS Santa Claus in early December, but the holidays came and went so I am now submitting it as a New Year’s wish list (Part 1) for the 2017 GeoCon  in Lake Placid.  There will  be other suggestions over the next several months and I’ll remain cognizant  what I wish for as I may be submitting an abstract to present myself.  Maybe.

So to start the discussion, here is an initial list of  ten geospatial mapping applications and program areas I’d like to send a speaker invite to for the 2017 GeoCon – and why.

NYS Office of the Attorney General:  New York Crime Gun Analysis https://targettrafficking.ag.ny.gov/tool/

While mapping continues to be one of the primary end products of GIS analysis, geospatial data is increasingly being used in a wide range of data visualization platforms such as Tableau.    I’d welcome the opportunity to attend a presentation by the Office of the Attorney on the Crime Gun Analysis report outlining data collection, data analysis, and the rendering of the data through maps, tables, and charts.  Not the normal GIS menu.

New York State Regional Economic Development Councils (REDC) http://regionalcouncils.ny.gov/

In context of geospatial, this program reference isn’t so much about “what it is”, as opposed to more about “what it isn’t”.  Or at least I think.  From my level, the REDC framework has always been somewhat of a mystery since current state administration created the 10 Regional Councils in 2011.  And even more confusing that the geography of the REDCs do not coincide with the statewide Regional Planning Commission boundaries. That said, there is an incredible amount of geospatial information and analysis in the Council’s underlying mission.  Everything happens somewhere.  And there is a ton of money coming through the Consolidated Funding Application (CFA) process which I believe the GIS community should be more engaged and recipients of to some degree. Uber opportunities for web mapping applications, Story Maps, and GIS-produced maps for publications though one would be hard pressed to see any real evidence of a professional GIS touch in any of the Council products and services.   I looked through four regional 2016 “progress” reports (Hudson Valley, Finger Lakes, Capital Region and Southern Tier and found very limited reference to GIS/geospatial technologies.   Some kind of presentation by one of the REDCs and/or regional GIS personnel involved in this program would be most informative for the statewide GIS community.  Otherwise I doubt we’re going to hear anything through the state GIS program office on this.

511NY
https://www.511ny.org/

This is more of a selfish request than anything because I really don’t fully understand the makings and how 511NY operates in context of GIS/geospatial data collection, sources, work flows, or even development of their applications including the online mapping stuff.  I do know it’s big, visible, seemingly growing in functionality, supported by a mess of New York State transportation agencies -even though it has its own .org web address.  It also creates a lot of data which would be useful to consume and use in local government web mapping applications.   I’d be the first one to sign up to hear how it all comes together, funding, sources of the data (including what is being taken from and/or generated at the local level), opportunities for collaboration with local GIS programs, and what’s next.  How long before we see an Uber icon on the 511NY homepage to help support trip planning?

Continue reading

NYS Local Government GIS Common Core: Part 1

At the 2015 NYGeoCon in Albany, I presented a paper focusing on several GIS applications which often support and justify GIS/geospatial development at the local level.  I refer to these applications and program areas as the “GIS Common Core” and it was my intent to use the presentation as a starting point to expand the discussion further as part of this blog.

While some of the GIS Common Core program areas are not new to the discussion, several factors have contributed to elevating these day-to-day GIS functional areas to the mainstay of local government geospatial efforts.  Though these factors and opportunities vary greatly across the state, some of the more obvious reasons why “GIS Common Core” applications are becoming the foundation of local government programs include:

  • Improved large-scale spatial data integration across key business applications (assessment-inspections-permitting-public safety-utilities)
  • Better address standardization as a result of E911 implementation
  • Significant improvements on the integration between GIS and AutoCAD technologies
  • Establishing capacity to fulfill ongoing/permanent regulatory and reporting requirements (MS4)
  • Broad deployment of software programs in which using/collecting/maintaining X,Y data is implicit and available by default; GIS/geospatial is often no longer considered an “optional” feature
  • Leveraging flexible, easy-to-use browser-based applications which are accessible in a wide range of environments, particularly in the growing government mobile work force.  A work force which expects maps anywhere anytime.
GIS Common Core application areas in local government

“GIS Common Core” application areas in New York State local governments

Continue reading

Geospatial Business Spotlight: Mohawk Valley GIS

Company Name:                Mohawk Valley GIS

Website:                               www.mohawkvalleygis.com

Established:                          2003

THE COMPANY

Linda Rockwood founded Mohawk Valley GIS in 2003, after her family relocated to Herkimer County, New York.   Previously, she owned North Country Technology Integration in New Hampshire, working primarily with school teachers to integrate technology and particularly GPS and GIS into the K-12 curriculum.

Initially, Linda had planned to continue offering the same type of services in New York, but found more opportunities early on providing GIS system development, data creation and training to municipalities, and designing custom print maps for organizations.

Mohawk Valley GIS moved to historic Bagg’s Square in downtown Utica in 2014 and has grown to include three full-time staff in addition to Linda, who continues to keep her GIS skills current along with coordinating all business development associated with the firm.    Interns from nearby SUNY Polytechnic Institute  and Syracuse University help when everyone starts bouncing off the walls.  The business received NY Women Business Enterprise (WBE) certification in 2013.

PRODUCTS AND SERVICES

The company has expanded to offer a complete suite of technology services including custom interactive online maps and mobile applications to help promote tourism and recreation, as well as to helping businesses, organizations and local governments towards updating websites to be mobile responsive.

By example, GoCaz.com is an interactive web map promoting four season recreation opportunities throughout the Cazenovia area in the Finger Lakes Region.  This particular project is an example of an adaptive, rather than a responsive, mobile application.  The software checks to see what device is accessing the map, then adapts by “offering” the correct version, either large screen or small device screen, as shown below.

The GoCaz website is device independent - enabling users to access the application from different platforms.

The GoCaz website is device independent – enabling users to access the application from different platforms. The browser version screen is on the left and smartphone version on the right.

Mohawk Valley GIS has also been running two promotional, recreation e-commerce sites for the past six years: the winter-oriented NY Snowmobile Trails  and the summer-oriented ADK Trail Map.   The Snowmobile Map application features an interactive map with a route planner, no-reception-needed trail apps with turn-by-turn navigation, and GPS map offerings including Garmin .img file format overlay maps and regional .GPX track files and waypoints.  The application was built in partnership with over 100 snowmobile clubs throughout New York State and was just awarded a NYS GIS Association Applications Award at NYGeoCon 2015.  Many similar functions are available in the ADK Trail Map.  Both projects feature responsive interactive maps, which respond to the device screen size by repositioning elements or eliminating some functionality.

n addition to a massive catalog of snowmobile trails, the application provides access to information on lodging, restaurants, and related travel services

In addition to containing a massive catalog of statewide snowmobile trails, the application also provides access to information on lodging, restaurants, and related travel services.

The route planner and turn-by-turn navigation functionality are built using a pathfinding algorithm which required converting the shapefile representation of the trails to a graph data structure. All geospatial application code in the web map is programmed using Leaflet, an Open Source javascript library.

Core Mohawk Valley GIS services  include GPS data collection, geocoding and digitizing, custom map creation, GIS implementation and training, and GIS data analysis, particularly with regard to big data analysis for predictive analytics and visualization.

Other recent or currently underway Mohawk Valley GIS projects include:

  • Municipality mobile app for Town of Webb/Old Forge, reception required, runs on all mobile devices/browsers, designed primarily for codes enforcement department
  • Municipality mobile app for Warren County, no reception needed, for first responders, focusing on building and structure characteristics
  • Custom paper map design for Vermont Association of Snow Travelers
  • Responsive website for the Herkimer County Chamber of Commerce
  • A unique (at clients request) website, American Electrical Enterprises, which uses a high tech data and chart visualization library
  • Three “big data analysis projects”, all under Non-Disclosure Agreements (NDA), which include  strong geospatial components related to predictive analytics, marketing, and real time data interpretation

To find out more about Mohawk Valley GIS geospatial services and products, visit their website.

CONTACT

Linda Rockwood, Owner

linda@mohawkvalleygis.com

114 Genesee Street, 3rd floor

Utica, NY  13502

315-624-9545

www.mohawkvalleygis.com


NextGen NYS Geospatial: Expanding the Profession

Based on the support of many long standing contributors, vendors, and returning individuals, the NYGeoCon 2013 meeting in Saratoga Springs, November 12-13, was considered a success.  Looking forward to future conferences and similar outreach efforts within the state, many could argue there is much optimism within the professional geospatial community – particularly with the NYS GIS Association at the helm – for continued growth and presence of the GIS profession across the Empire State.   However, unless new members are recruited from professions which are currently not part of the “staple” of the Association membership (government/public agencies, software companies, photogrammetry, academia, and civil engineering disciplines), such optimism may be tempered based a combination of recent industry and business reports, metrics, and employment trends.   Consider the following:

Government Job Growth Weakest:  A December 2013 Governing Magazine article notes that while private employment may finally be ready to accelerate, “state and local government job growth continues to be among the weakest of any industry”.  Translation:   Much of the future geospatial development – most likely at all levels of government in the Empire State – will increasingly be vendor/contractor based. While it is anticipated that existing government GIS programs in the Empire State will find a means to continue on some level, current government budgets and tax cap spending limits, suggest that new or expanding government geospatial programs will occur at a decreasing rate.    And few in government administrative or management level GIS positions across the state would probably be unable to argue otherwise. 

Minimal Technology Sector Growth:    A recent Praxis Strategy Group market report entitled “The Surprising Cities Creating the Most Tech Jobs” offers current statistics on employment trends in industries normally associated with technology, such as software, engineering and computer programming services. The article also presents numbers of workers in other industries which are classified as being in STEM occupations (science, technology, engineering and mathematics-related jobs).   Though the study considers only MetroNYC – and not the entire state – the findings are still somewhat troubling as the NYC ranked 36th on the national scale – only slightly ahead of metro Buffalo (43rd) and Rochester (45th).  Since 2001, New York City’s tech industry growth has been a paltry 6% while the number of STEM related jobs has fallen 4%.  The chances of New York City – or others parts of the state for that matter – of becoming a major tech center are handicapped not only by high costs and taxes, but a distinct lack of engineering talent. On a per capita basis, the New York area ranks 78th out of the nation’s 85 largest metro areas, with a miniscule 6.1 engineers per 1,000 workers, one seventh the concentration in California’s Silicon Valley. (Buffalo and Rochester statistics in this regard may be better though were not available as part of the article).

Shared Services Still Struggles:  For a technology which presents incredible opportunities for public organizations to share computing infrastructure, replicate (or share) identical mapping applications, cost-share on similar geospatial data development projects, or jointly exploit new Cloud-based programs – Information Technology (IT) shared services – and by extension GIS – have yet to be broadly implemented across the Empire State.  An August 2013 report prepared by the Cornell University found that while Shared Services programs in areas such as transportation, public safety, and recreation/social services continue to show promise, only eight-percent (8%) of the nearly 946 New York State government agencies surveyed in the study were engaged in Shared Services IT projects.

Growth Outside the GIS Mainstream:  An illustrative series of 2013 global market study reports by TechNavio forecasts steady GIS growth in disciplines which currently do not have a significant presence in many statewide conferences and programs or the NYS GIS Association.  Largely outside of government, and certainly not normally considered “tech jobs”,  these key industries  include banking and financial services, real estate, retail,  telecommunications, and utilities – all of which have significant corporate presence in the Empire State.  Many of these same industries were also identified as “GIS growth sectors” – including banking, insurance, law enforcement, business, healthcare, and finance – as part of a Geospatial Job Market panel discussion at the 2012 Association of American Geographers annual meeting.

Long term sustainability of the GIS profession in the Empire State requires the continued expansion and recruitment of industries which to date, have not had a strong visible presence in statewide GIS programs and activities.    Such opportunities exist by engaging these disciplines –  health care, retail, real estate, insurance and banking, and telecommunications, to name a few –  in local and regional GIS events,  NYS GIS Association professional development programs, or conversely, by attending and participating in industry trade shows and annual conferences held here in New York State (i.e., National Retail Federation,  NYC Real Estate Expo,  Annual NYS Commercial Real Estate Conference, NYS Association of Health Care Providers, and NY Bankers Association as well as many others).

Long term growth and influence of the NYS Geospatial profession should be considered extremely promising though will need to be based on a broader mix of disciplines and practitioners.