GeoSpatial Student Spotlight: Collin O’Connor

PhD Candidate/Geography                               June 2025 (Anticipated)
Department of Geography
University at Buffalo                                                                                Buffalo, NY

M.S. Epidemiology                                             May 2020
School of Public Health
Department of Epidemiology and Biostatistics
University of Albany                                                                                 Albany, NY

B.S. Biological Sciences                                    May 2018
Department of Biological Sciences
University at Albany                                                                                 Albany, NY

Research Focus

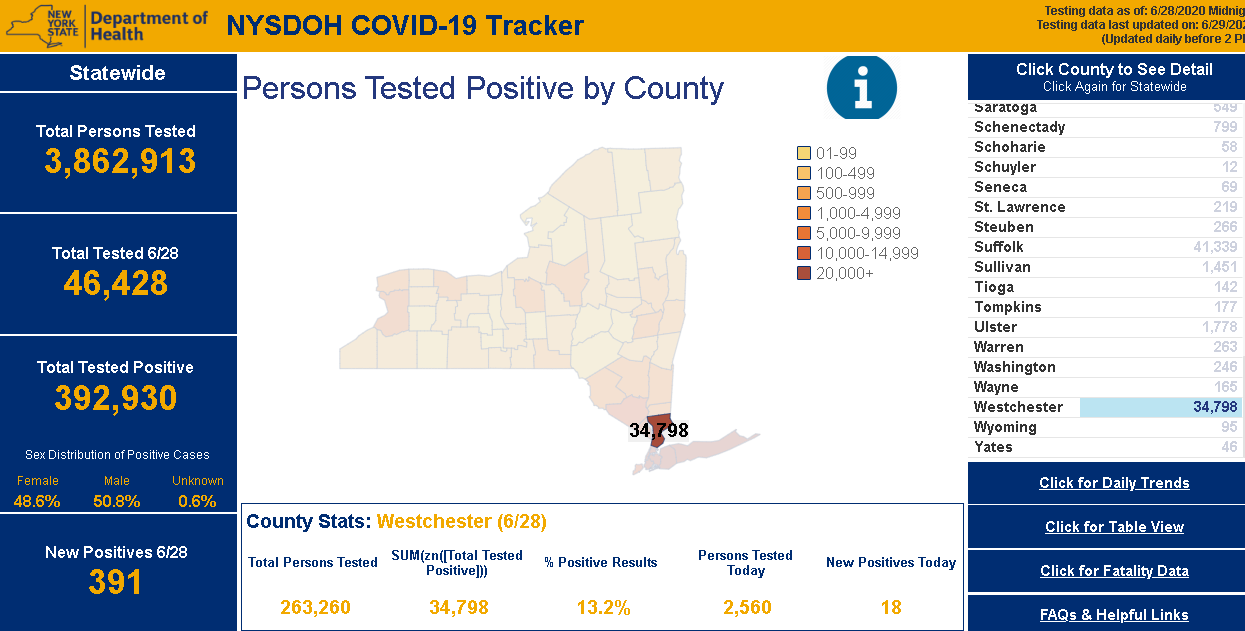
O’Connor’s doctoral research focuses on the spatial ecology and epidemiology of tick borne diseases in New York State. In particular, his dissertation work examines two genetic variants of Anaplasma phagocytophilum, the pathogen that causes anaplasmosis. Anaplasmosis is the second most frequent tick borne disease in New York State behind Lyme disease.  An August 2021 article in Medscape reported Anaplasma cases nearly quadrupled statewide from 2010 to 2018.  On a larger scale, Anaplasmosis became a nationally notifiable disease in the United States during 1999 after nationwide case counts increased significantly. Most of these infections occur in the upper midwestern and northeastern states, with eastern New York and the Hudson River Valley areas being of particular focus and concentration.

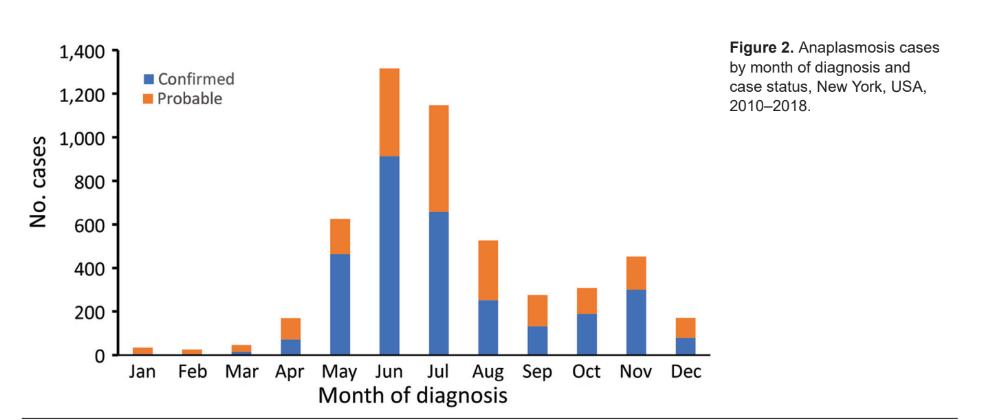
It comes as no surprise that confirmed Anaplasmosis are the highest during the summer months when people are active in the outdoors.

Background

O’Connor started his research on anaplasmosis while working on his masters degree at UAlbany with a team of other public health researchers and scientists in both academia and government. Their ongoing and collective research focuses on evaluating human risk of acquiring anaplasmosis (as well as Lyme Disease, babesiosis and other tickborne diseases) at publically accessible lands, based on measures of tick density and pathogen prevalence. Central to the investigation is looking at the relationships between human activity and environmental characteristics of specific land cover types supporting mammalian populations which serve as both transmitters and hosts of the A. phagocytophilum pathogen.

O’Connor’s research involves numerous datasets as part of his research, most notably human case data – which is analyzed at the ZIP Code Tabulation Area (ZCTA) level –  as reported to the New York State Department of Health (NYSDOH). Data is aggregated by NYS regions (Capital, Central, Metro, and Western) and ZCTA by using patient address and 2010 US Census population data and shapefiles.

Continue reading

COVID Era Geospatial Applications to Support Empire State Communities

Here in southeastern New York State, it’s amazing how fast the COVID wave came and went. At first, mid-March to mid-May seemed like an eternity, but now, not so much.  I likened the preparation for COVID to preparing for Super Storm Sandy.  Albeit phenomenally different, the buildup and the anxiety of waiting for it to show up.  Peering out the windows to see the outcome of a completely different kind of damage and suffering  altogether.  Physical and psychological.  Now July, it seems and feels like we can see the first wave of the pandemic in the rear view mirror.  But then as we refocus on the road in front of us, we know there are speed bumps ahead of us.  Not if, but when.

There were a plethora of interesting and meaningful geospatial viewers created across the state during the mid-March to mid-May time frame.  Most included highlighting COVID case numbers by larger units of geography (municipal or zip code boundaries),  generalized heat or pattern maps, impacts to businesses and institutions, as well as  information on hotlines and sources of assistance.  However, its pretty well documented the geospatial community across the state has struggled with being part of providing detailed spatial analysis or mapping support functions at the address level.   Or for that matter, even being asked to participate in this regard.

Personal health related data is uber protected with its use regulated and governed by the Health Insurance Portability and Accountability Act (HIPPA).  HIPPA  regulations reign supreme and contributed to a lesser involvement of GIS analysts in  providing geospatial content, metrics and analytics during the pandemic.  There is also the unspoken reluctance on the part of the public health community to release data sets  which might be difficult to understand or easily misinterpreted by the general public.  Department of Health  professionals often cautious to release data – particularly in new instances such as the COVID pandemic – and leaving analysis/interpretation  to internal professional staff only.  Ultimately though,  releasing some flavor of the data but in a more generalized context.

NYS Department of Health (DOH)  COVID-19 reporting has improved dramatically since the pandemic appeared in March.  Though while numbers  are made available only on a county basis, users can access and visualize the data in a variety of ways.  Reporting and posting of the data has become much more timely.  DOH is also now publishing a regional “Early Warning Monitoring Dashboard“.

Continue reading

GIS Common Core Part 3: Health and Human Services (HHS)

Through a sequence of articles posted in eSpatiallyNewYork, I have proposed a series of GIS applications which provide a framework for establishing and maintaining  GIS/geospatial programs in local  governments (villages, towns, cities, and counties) across  New York State.  These applications areas are referred to as the Geospatial Common Core, many of which are integrated with local government office and administrative business systems.  Others are utilized in the support of regulatory reporting programs.    Together, the Geospatial Common Core contribute towards building sustainable geospatial capacity for local governments.   This is the third installment of the series.

“GIS Common Core” application areas in New York State local governments

The first article entitled Part 1:  Infrastructure and Asset Management focused on the growing and critical role local government GIS geospatial programs continue to serve in rehabilitating and maintaining the decaying and outdated New York State – and national – public infrastructure.  The second article Part 2:  Work Orders, Permitting, and Inspections (WOPI) published in March 2016 focused on geocentric software packages which are ubiquitous in government programs supporting work flows in areas such public works, health, planning, clerk, assessment, buildings/code enforcement and inspections.  Organizations investing and integrating WOPI systems with GIS will continue to help build long-term sustainable geospatial programs in local governments.

Part 3:  Health and Human Services (HHS)

Health and human services can often be broadly defined from one location to another but for the purposes of this article it includes a wide-range of government programs including, but limited to, public health services, social services, public assistance, youth and veterans programs, disability programs, housing and homeless services, child protection services, as well as the important network of contracted service providers governments rely upon in providing counseling and related support services.  I have long been an advocate of building geospatial capacity in these local government program areas.

Why?

Statewide local government HHS budgets typically dwarf other local government operational program areas with regard to annual appropriations.  While I am not a budget analyst and admittedly it’s sometimes difficult to follow the money trail of appropriations vs. revenues vs. actual tax payer costs in county budgets, here are a few examples to illustrate the size and magnitude of HHS programs in a selected 2017 NYS county budgets (Data/information from County webpages as noted):

  1. Stuben County 2017 Budget. (Page 3).  Pie chart indicates nearly 47% of the appropriated budget dedicated to Health and  Economic Assistance/Opportunity (includes Social Service disciplines) program areas
  2. Ulster County 2017 Budget. (Pages 1 & 2). Table and pie chart indicate nearly 42% of the appropriated budget dedicated to Public Health and Economic Assistance/Opportunity program areas
  3. Erie County 2017 Budget. (Pages 93, 159, and 174). Appropriations (rounded in millions) in Health ($86M), Mental Health ($47M) and Social Services ($591M) account for almost 50% of the $1,455,000,000 recommended general fund budget.  (Note:  There are other references to the 2017 budget being closer to $1.7B). Either way, HHS budgets are a significant portion of the overall county budget
  4. Albany County 2017 Budget. (Page 34). Employee Count table lists 657 of 2,535 County employees (26%) are in the Child, Youth, and Family Services (170), Social Services (308), Mental Health (90), and Dept. of Health (89)
  5. Suffolk County 2017 Budget. (Pages 101 and 366).   Appropriations (rounded in millions) in Health Services ($249M) and Social Services ($628M) account for nearly 30% of a recommended $2.9B budget
  6. Monroe County 2017 Budget. (Pages 157 and 275).  Appropriations (rounded in millions) in Human Services ($536M) and Public Health ($62M) account for nearly 50% of an adopted $1.2B budget
  7. Continue reading