BuildingFootprintUSA: Setting the Foundation in Albany

Somewhat fitting a new geospatial start-up would emerge in the Albany area.   The region being home to MapInfo, an early player in the desktop GIS software market appearing at number 23 in Inc. Magazine’s annual list of the 500 fastest-growing private companies in the U.S. in 1992.   While the software product is still around, the company has since been acquired by Pitney Bowes.  Across the Empire State geospatial landscape it’s not uncommon to bump into someone working in the GIS space with ties to MapInfo.

Case in point, in 2016 four ex-MapInfo colleagues, each with over 25-years of experience in the geospatial space focusing largely on data development, went out on their own and launched BuildingFootprintUSA with the intent of providing to the geospatial industry spatially accurate and attribute rich building footprints covering the United States.  Their initial focus has to been to provide data to the location based advertising, insurance, and telecommunications industries.  In January of this year, Geoawesomeness included BuildingfootprintsUSA (BFUSA) in the 2019 Top 100 Geospatial Companies and Startups List.

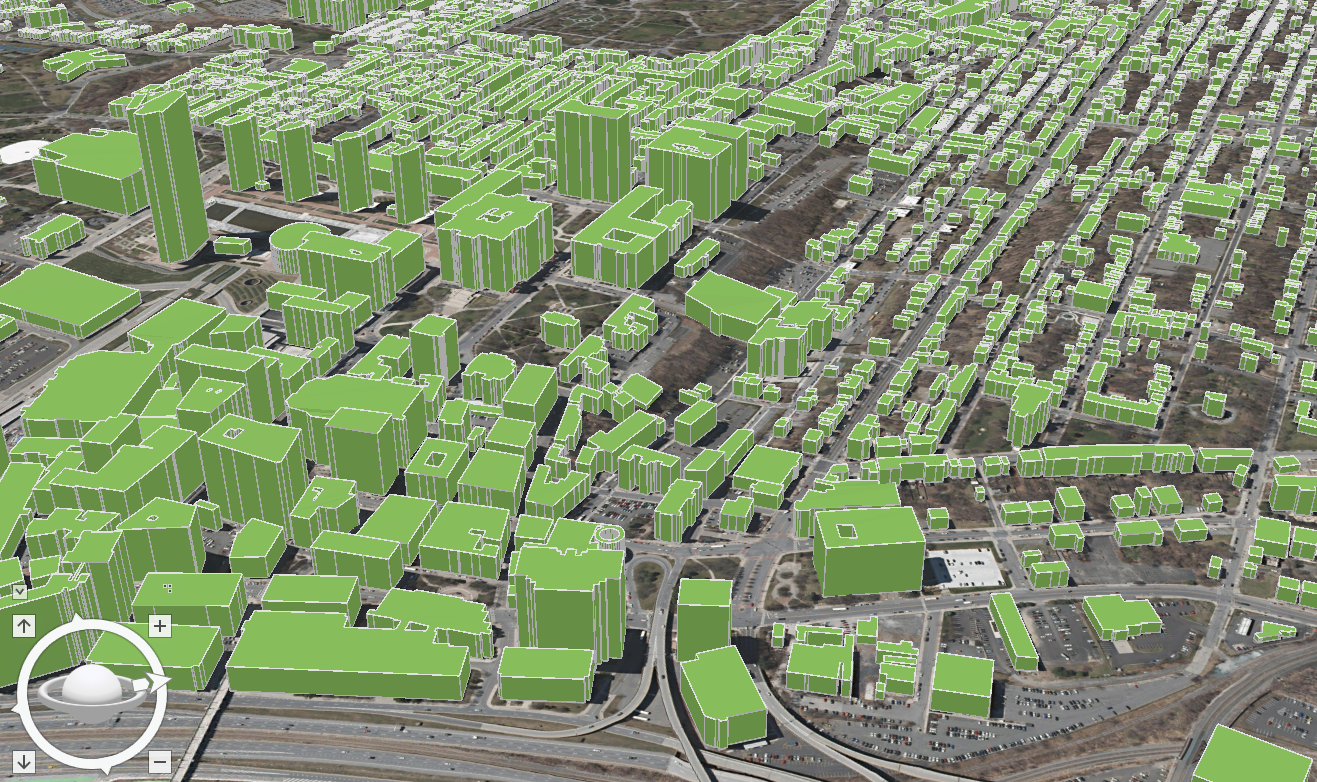
BuildingFootprintUSA’s 3D model of Albany including the Empire State Plaza. Buildings are commonly attributed with addresses and assessment data.

Given that the company is only three years old and has only a handful of full-time employees, BFUSA might be considered a typical tech start-up.  However, co-owner Scott Robinson notes that the company is in the midst of significant growth with a growing list of clients nationwide.  The company is an ESRI Emerging Business Partner and is part of the START-UP NY Program in a partnership with SUNY Albany.

The fast-growing company’s catalog already includes over 90 million footprints covering 75% of the US population, several large clients and to date has not required any external funding.  Using an addressed building footprint as the foundation of their product line, BFUSA routinely connects a wide range of attribute data to the footprint including, but not limited to, census designations and demographics, assessment files, property and facility information, and business characteristics such as category and size of company.  For residential structures, detailed demographics (i.e. age, race, income, education, etc) and household profiles on consumer behavior and lifestyles are also available.  Structure height (z-value) is also included in the footprint dataset which is derived from available LIDAR databases as well generated from their own photogrammetry or other BFUSA business partners.

We are committed to data integrity”, notes co-owner Scott Robinson, “our work is essentially a  huge data curation effort – blending and harmonizing data from many different sources including open data portals, government websites, and commercial data services”.   Specific and very detailed attention is given to the spatial/positional accuracy of the footprint as well as the numerous data fields associated with the footprint.  Robinson points out that not all building footprints are created alike noting that many “single” footprints can be comprised of several offices or living spaces such commercial buildings and/or condominiums and apartment buildings.  Similarly the same footprint can have different heights (z-value) which factors into line-of-sight analyses and wireless signal studies.  He continues “It’s not uncommon to find at least 25% of the building footprints we receive from others to be off at least 100 feet”.

Specific examples of how BuildingFootprintUSA products and services are used include:

Insurance

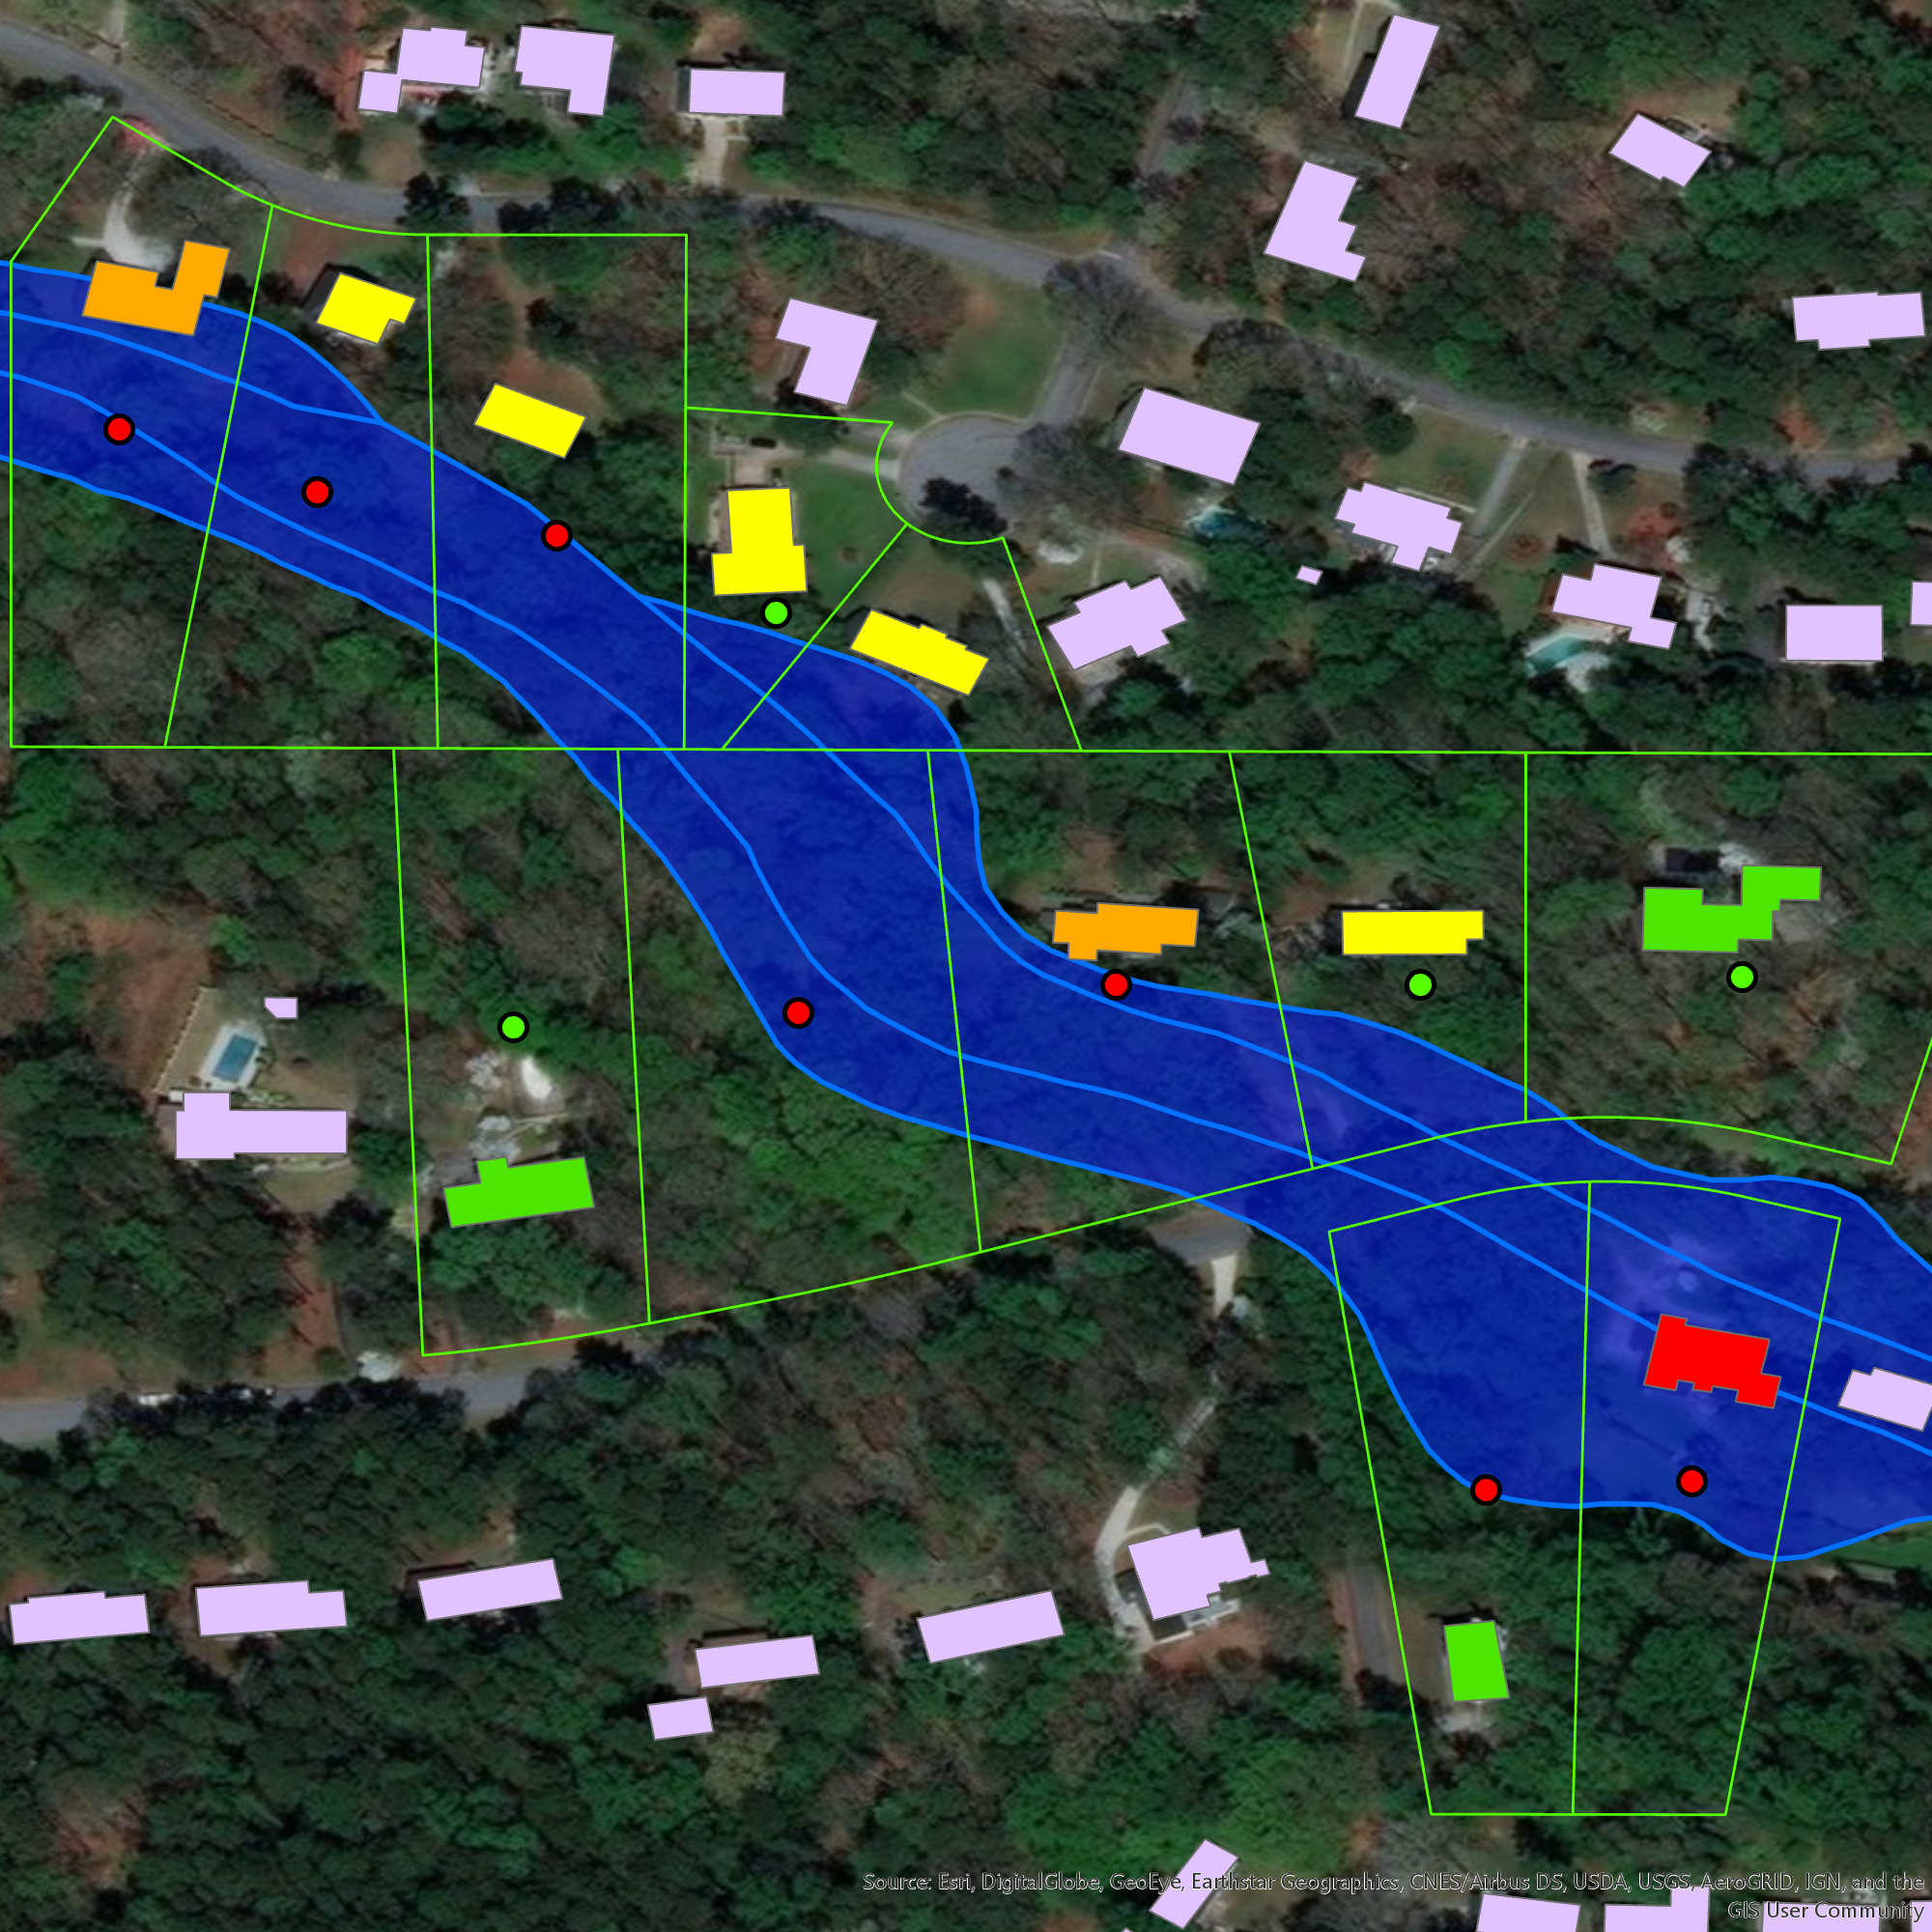
In assessing structural risks in designated flood plains, using building footprints versus parcel centroids provides a more informed evaluation. In this example, dots represent parcel centroids. In some instances where parcel centroids are located in the flood plain, associated parcel structures may/may not be (orange and yellow) vulnerable to flooding. Both a red dot and red footprint indicate a more vulnerable property while both a green dot and green footprint imply major property assets are not subject to flooding.

Telecom

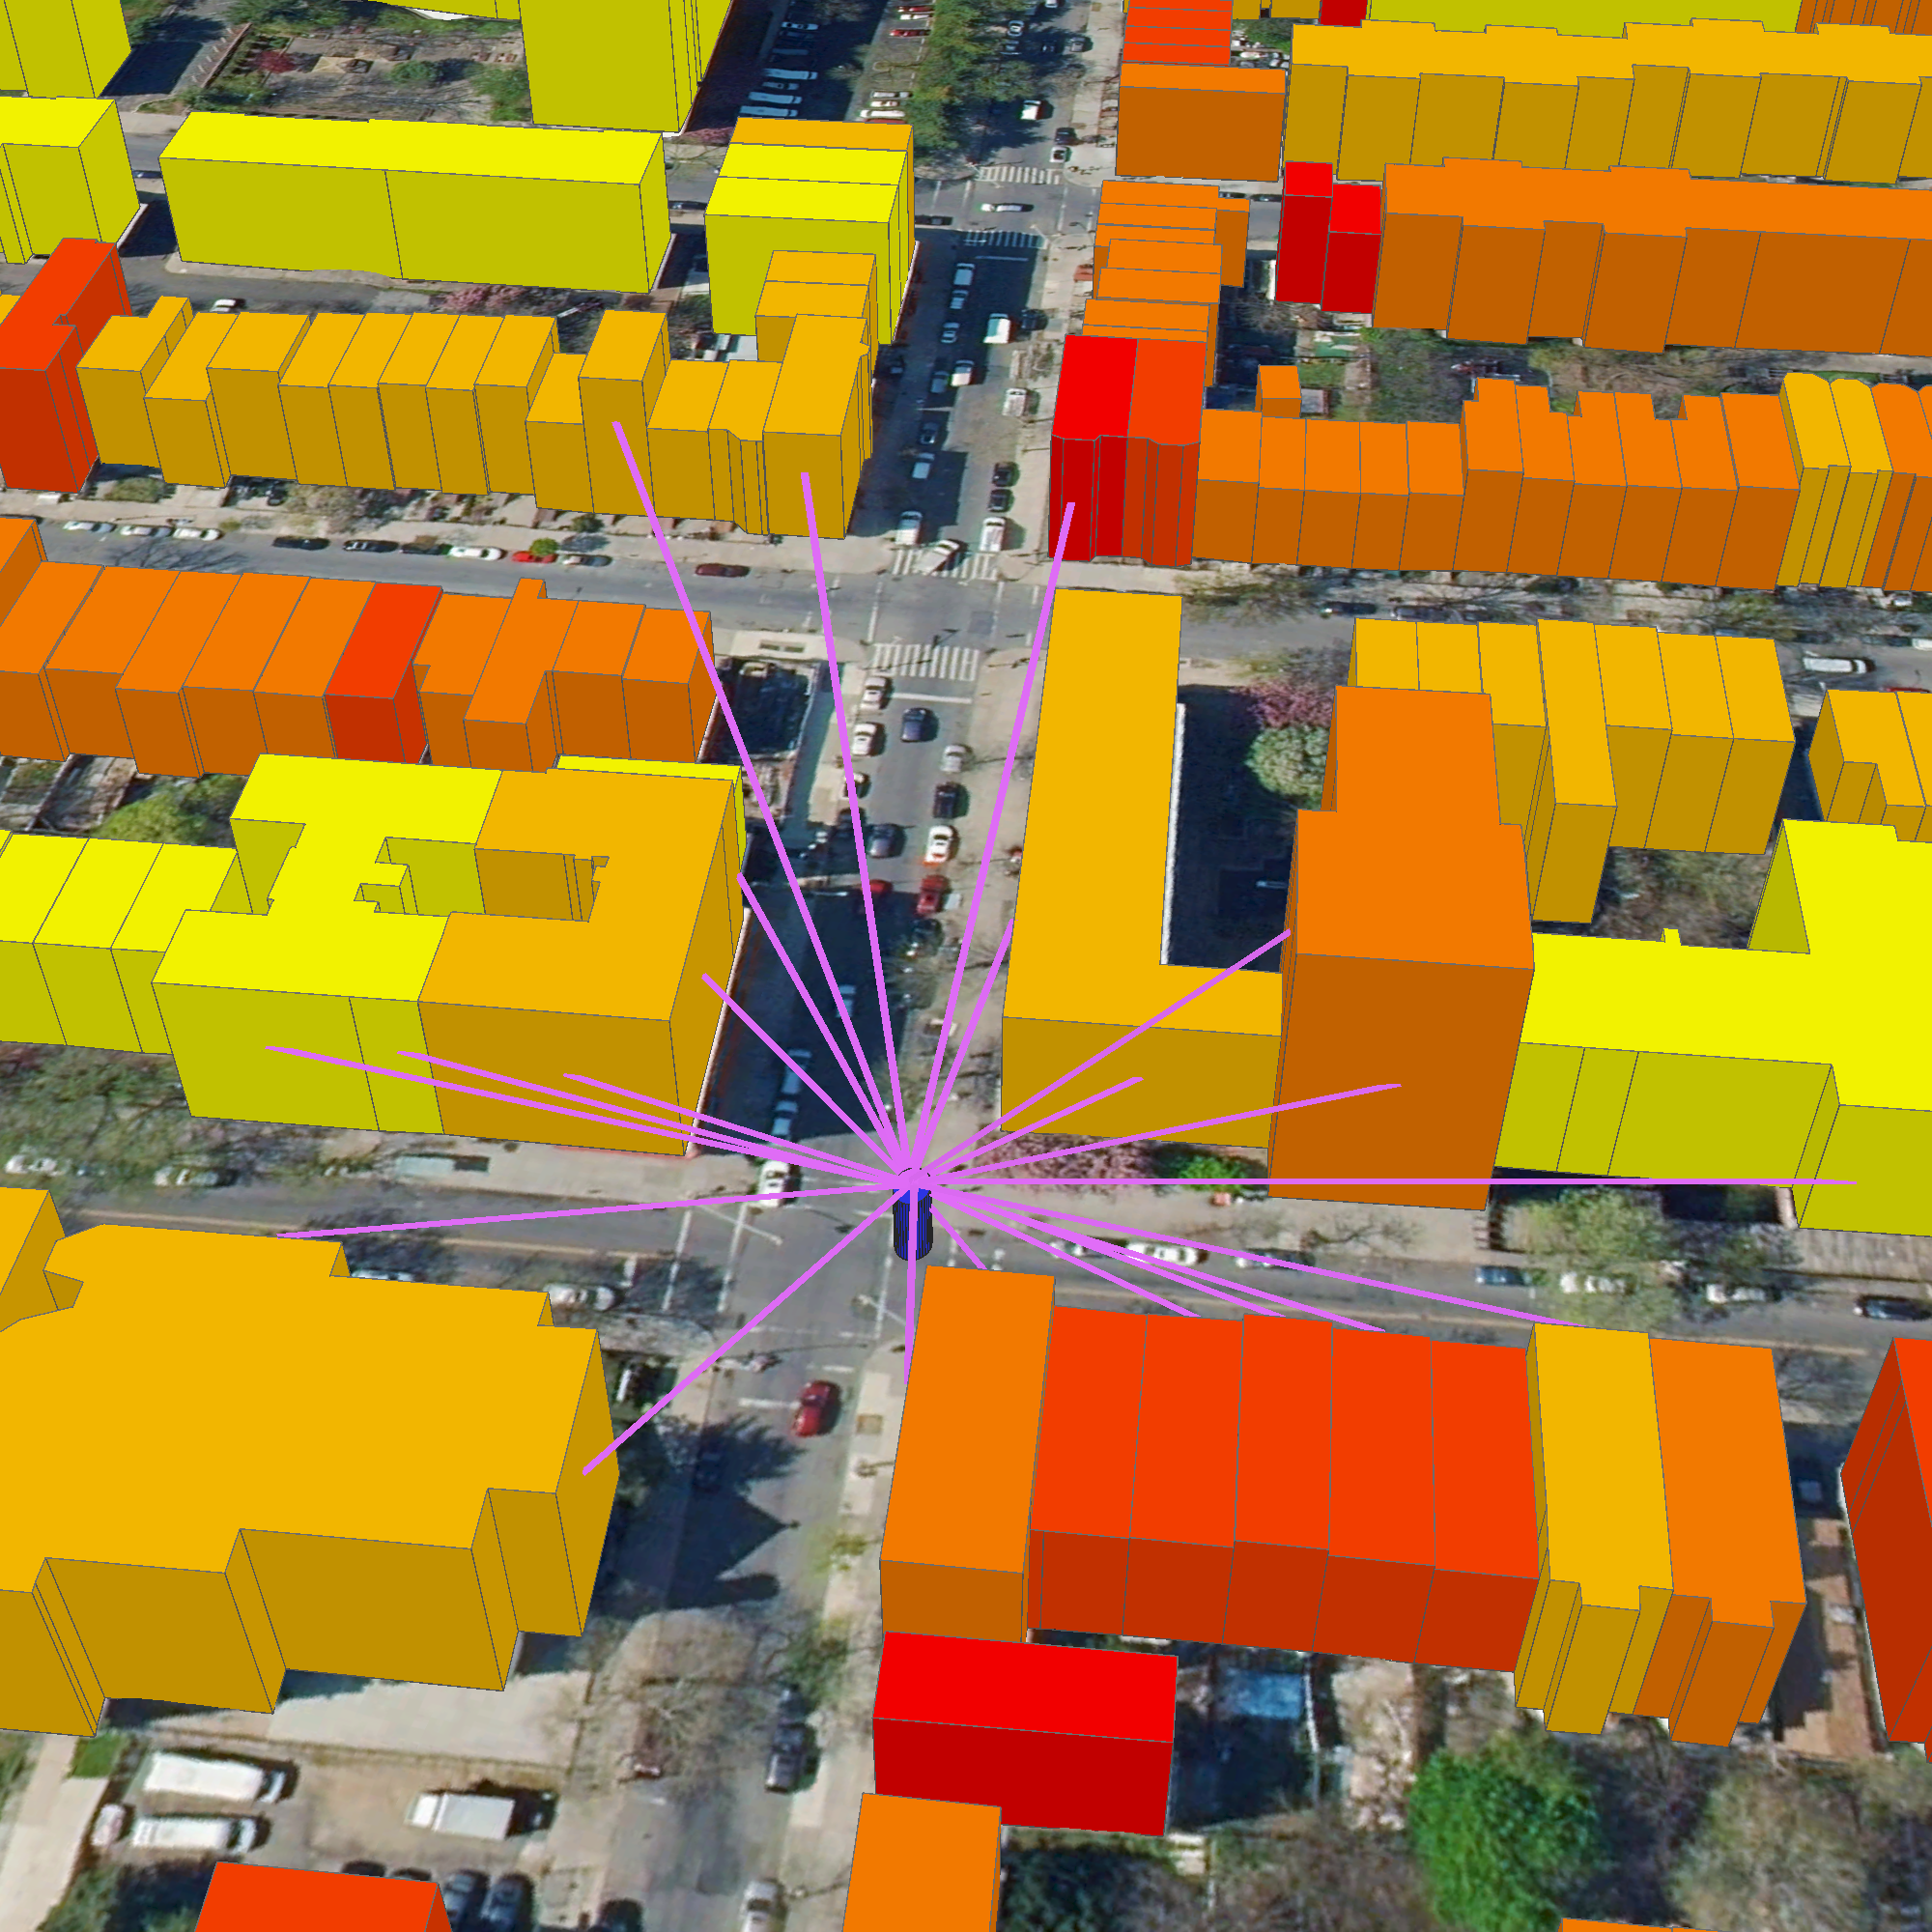
A Telco company uses BuildingFootprintUSA data to understand optimal placement of 5G network towers in NYC; based identifying what buildings the signal can reach and what are the characteristics of the building itself. In this picture residential buildings are shaded by affluence of the residents.

Location Based Advertising (AdTech)

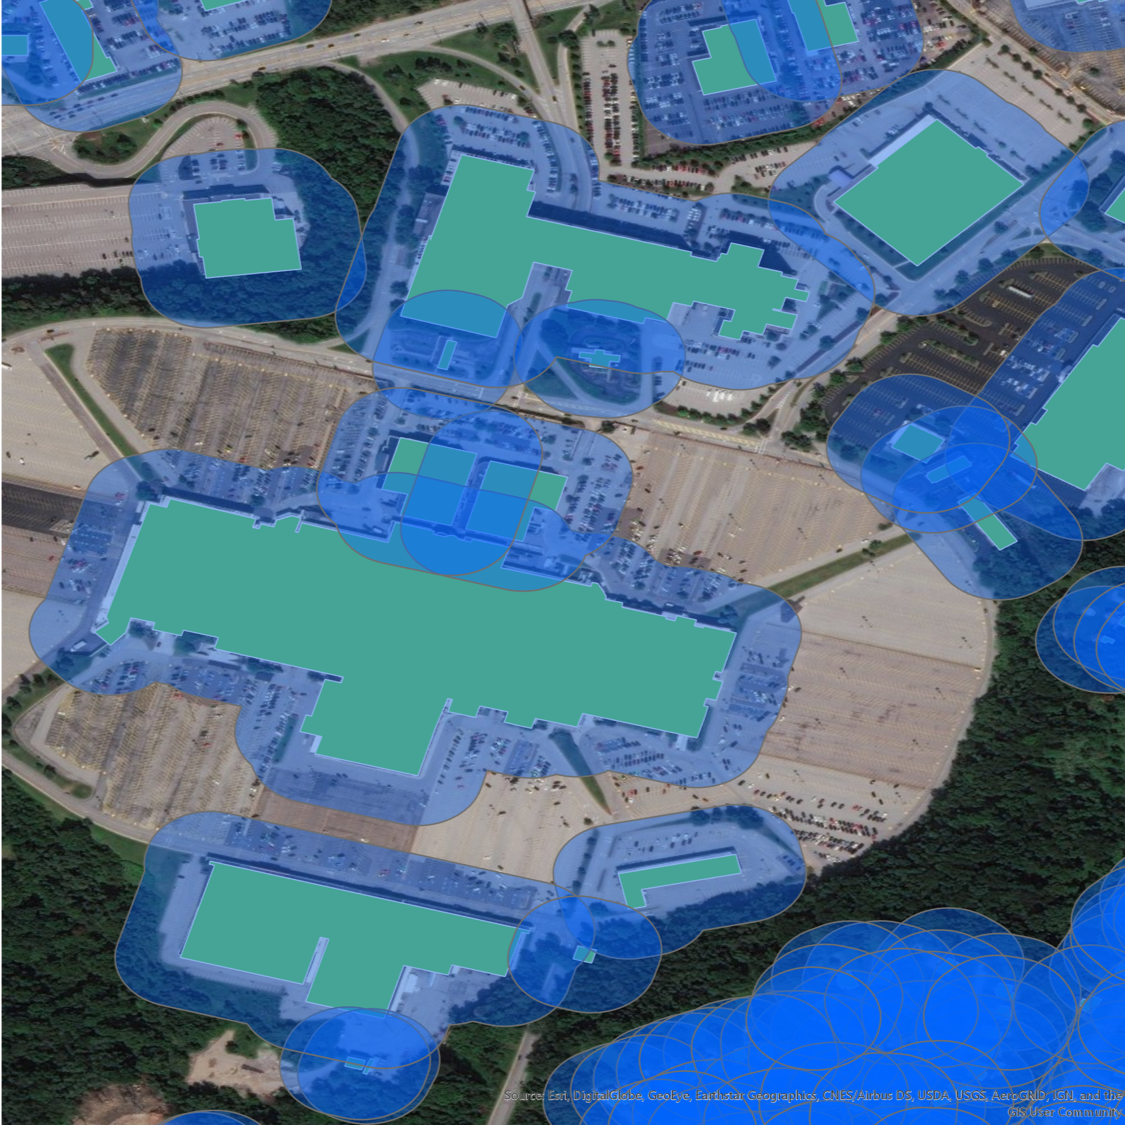
Detailed business data attributed to building footprints can then be integrated with consumer movement data generated by mobile devices. Buffers around specific buildings can support a variety of pattern analyses which provides a very educated guess on where a mobile device has been over a period of time. Using both store visit insights and foot-traffic data, building footprint data empowers retail analytics firms and real estate asset managers to conduct live trade area analysis and give retailers insights on the characteristics of these people, and know the reasons that are drawing people to those locations.

BuildingFootprintUSA data products are currently available via ESRI Shapefiles and geodatabase (GDB) and MapInfo TAB in Coordinate System WGS84.  Later in 2019 the company plans to offer data via an API. Datasets are typically sold as nationwide coverages though smaller geographic footprint are available as well.  Data is offered by annual license with quarterly updates.

Summary

Refreshing to see a geospatial start-up emerge in Albany only minutes from the Empire State Plaza.  With the UAV technology well recognized and established from Syracuse into the Mohawk Valley Region, we can be optimistic that BuildingFootprintUSA’s success – and perhaps by extension its association with START-UP NY – will be recognized and brought to the attention of the state’s elected officials.  Highlighting both the company’s contribution to the local and state economy and illustrate how geospatial marketplace commodities are routinely produced and made available by industry.

Perhaps a start to similar industry growth in the greater Albany and Hudson River Valley region.

Contact:

Scott Robinson, VP Strategy
scott@buildingfootprintusa.com
BuildingFootprintUSA
200 Great Oaks Blvd, Suite 214
Albany, NY 12203
518-218-4444

Digital Agriculture Continues to Evolve in New York State

Agriculture is important to New York State’s economy, and takes place in almost every region of the State as nearly one-quarter of New York’s total land area is utilized as farmland. There are a plethora of statistics which document the vastness of the agriculture industry across the Empire State:  An annual economic impact of over $42 billion, over 36,000 farms, 1.5 million head of cattle, 40,000 acres of apple trees, $25 million worth of maple syrup and 14.9 billion pounds of milk.  And #1 in the nation in the production of over 700 million pounds of yogurt.  The list goes on.

It’s refreshing to see this important statewide industry begin to intersect with geospatial in a more expanded and robust means.  The movement began to see traction a little over three years ago with the New York Precision Agriculture Workshop held in Geneva, NY in December 2015.    The goal of the workshop was to help assess the use and development of precision agriculture in New York State and was held after a directive from the New York State Legislature instructing the Commissioner of Agriculture and Markets to “issue a report assessing the use and development of precision agriculture in the state with recommendations pertaining to rural broadband accessibility, use and support for the farmer, as well as cost savings and higher crop yield.”   Over 50 individuals from the New York agricultural community were in attendance representing higher education, research, agronomic business, farmers, technology, government and more.

Nearly a year later in November 2016, the 151-page Digital Agriculture in New York State:  Report and Recommendations was published through Cornell University College of Agriculture and Life Sciences.  One of the primary recommendations which was ultimately established was the Cornell Initiative for Digital Agriculture  (CIDA).  Recently, CIDA hosted its inaugural Digital Ag Workshop October 9, 2018 on the Cornell University campus. The event was titled “Transforming Agriculture and Food Systems” and was attended by 200 individuals.  The Workshop included a wide range of presentations and resulted in the establishment of four interdisciplinary Digital Agriculture (DA) Working Groups:  Rapid Phenotyping, Socioeconomic Analysis for Digital Agriculture, Weather, Climate and Agriculture, and The Software-defined Farm.  It will be interesting to see how CIDA evolves in its outreach, research, and building partnerships with government and industry.  Cornell University was rated one of the Top 25 Best Colleges for Precision Agriculture in the United States.   For those interested in following the program, upcoming events and webinars, sign-up for updates and e-News from this CIDA webpage.

Other signs of growth in the statewide Digital Agriculture (also often referred to as “Precision Agriculture”) space augmenting CIDA’s mission includes a recent  ESRI press release announcing Ag-Analytics which is part of their Emerging Partner Startup Program.   Ag-Analytics offers a platform with tools that make utilizing farm data easier than ever. Built around the Software-as-a-Solution (SaaS) framework, Ag-Analytics offers farmers the ability to better manage and visualize their production records to make informed decisions when it comes to understanding risk.  As farm equipment manufacturers become larger and prominent players in the Digital/Precision Agriculture development, it is no surprise that the Ag-Analytics program is integrated with the John Deere Operations Center.  Faculty from the Charles H. Dyson School of Applied Economics and Management at Cornell University are involved with the Ag-Analytics program.  We also saw in 2018, DropCopter, an agricultural technology startup funded through the GeniusNY drone incubator in Syracuse, which managed to pollinate apple orchards in Lafayette, New York using their hexacopter drone. The recent decline of bee populations has raised pollination prices significantly, creating a market for alternative technologies such as Dropcopter.   Evolving in other areas, we would anticipate seeing government program areas such New York State Agriculture and Markets and/or the  New York office of the USDA Natural Resources Conservation Service (NRCS) begin to build some level of digital/precision agriculture capacity as well.

On a related note at the federal level is the passage of the Precision Agriculture Connectivity Act of 2018.  With the focus of the bill  to “identify and measure current gaps in the availability of broadband Internet access service on agricultural land”, the bill assigns responsibility to the USDA and FCC to “develop policy recommendations to promote the rapid, expanded deployment of fixed and mobile broadband Internet access service on unserved agricultural land, with a goal of achieving reliable capabilities on 95% of agricultural land in the United States by 2025”.  Kudos to the National Society of Professional Surveyors (NSPS) working to successfully amend language in the original bill to ensure that members of the task force assembled to make recommendations include “representatives with relevant expertise in broadband network data collection, geospatial analysis, and coverage mapping”.

No doubt, exciting developments for the agriculture industry across the Empire State and great opportunities for the geospatial community to contribute and be part of.

URBAN-X: Supporting New York Geospatial Startups

Curious to know about technology accelerators in New York State which are supporting  geospatial startups?  Look no further than Brooklyn-based URBAN-X built by MINI and Urban Us and operating since 2016 offering customer development, product development, and fundraising support to get selected startups off the ground into production and operation.   Geospatial is not the only type of startup  URBAN–X supports  (its actually much more)  with an existing resume of 37 firms in its portfolio covering technology solutions in the areas of real estate, transportation, energy, infrastructure, public health, and government among others.  The URBAN-X startup focuses on the urban tech environment developing hardware and software solutions which address key needs of city systems, as well as businesses and individuals.   The accelerator’s current cohort consists of seven  startups which each received $100,000 and five months of immersive mentorship.  This cohort was selected from over 500  applications this past November.

Every six months Urban-X selects up to 10 startups and invest $100,000 per company. The 20-week accelerator program also includes six on-site “experts-in-residence”.

Illustrative of the geospatial startups which have come through the accelerator is Citiesense.

Citiesense creates data-driven maps and dashboards that layers information about new permits, recent sales and property changes in urban areas, guiding real estate investors and other local stakeholders to support more informed business decisions.  Using interactive mapping and data visualization techniques, the company continues to focus on helping business districts better understand market demand and dynamics.   Citiesense uses Carto software to support their mapping applications and leverages data available in the NYC Open Data Portal.  Examples of their mapping apps are at the Downtown Brooklyn website and the Long Island City Partnership.  Citiesense is also referenced in a 816 New York article “3 map-based tech tools perfect for neighborhoods and housing authorities”.

I quickly developed an account on the Citiesense website and immediately started mapping various features around 347 East 105th Street. Out-of-the-box the application provides access to dozens of variables and features. This image shows recent 311 Reports, the NYC Street Tree Inventory, and the Commercial Overlay Districts layer.

Starting a tech company is never easy” notes Citiesense CEO Starling Childs. “I think this is particularly true of ‘Urban Tech’ startups. Joining URBAN-X was like adding the perfect final cofounder to our team right when we needed to begin testing our idea in the market. The people behind URBAN-X know the challenges urban tech companies face when thinking about solutions that consider some level of government and private sector collaboration. They understand the value of things like open data; how it supports public private sector collaboration and accelerates innovation in cities.”

Other URBAN-X supported startups in the location and navigation space include Revmax, Rentlogic, WearWorks and Swiftera.

Revmax:  Revmax develops fleet management and routing software for ride-hail vehicles. Its technology maximizes vehicle utilization by proactively forecasting rider demand based on historical data and future events. Revmax ensures that vehicles are in the optimal location to find rides quickly — increasing fleet revenue while reducing pollution and congestion.  According to  CEO Jonathan Weekley and chief operating officer Briggs Fraser,  cabs and Uber cars are empty some 50 percent of the time — highly inefficient for drivers trying to make the most of their time on the road. But the real target market for Revmax, Weekley says, is auto manufacturers such as GM and Ford, who are looking to get into ride-hailing. “They see declining car ownership, and they need to figure out a way to keep building cars and use that fleet more efficiently,” he said. Those manufacturers will have extra incentive to optimize routes, since they, not the drivers, will own the cars that are out on the road.

Rentlogic:  Rentlogic is a standards organization that measures and letter-grade rates the quality of multi-family residential buildings. Rentlogic ratings recognize building owners that invest time and energy in to operating great buildings, and helps connect them with residents trying to navigate a difficult marketplace.  Data underneath the application is harvested from the city’s 311 system.    Every week, roughly 4,000 complaints are initiated by renters about their landlords via calls to the #311 system. These complaints can include mold, heat and hot water issues, infestations, structural problems and more – all of which are used in the application.  It is Rentlogic’s aim to bring transparency and standardization to the residential real estate market.

WearWorks:  WearWorks is a New York-based haptics design company using sensory feedback systems to communicate information entirely via touch. Using vibration-based language, their product augments the senses of blind and visually impaired users through a non-visual interface, helping them to easily and effectively navigate to any destination.  Btw – WearWorks technology was worn/used by Simon Wheatcroft, a blind runner, in the 2017 New York City Marathon.

Swiftera: Swiftera’s business plan is to support citizens, businesses and municipalities in mobility, leisure and urban planning decisions. By providing access to fresh and actionable geospatial data at a competitive cost, the company leverages its novel urban-imagery technology to help customers analyze the past, explore the present and be the first to see the future.  While still in development, Swiftera anticipates delivering unprecedented urban imagery: available all-the-time, in real time.  For more information visit their website or contact them at info@swiftera.co. 

Summary:

URBAN-X provides an excellent opportunity for startups – including those in the geospatial space – to get started in a way which would otherwise be financially and logistically very difficult.    URBAN-X is itemized in a 2017 Dreamit article as one of the leading voices in the New York City “nascent urban tech movement”.  In the broader statewide context, the Empire State Development corporation supports several regional certified business incubators.  The New York State geospatial community is fortunate to have both the access and ability to work with companies such as URBAN-X.

Contact:

Micah Kotch
Managing Director
URBAN-X
Micah.Kotch@urban-x.com
Mobile: +1.646.645.0459
www.urban-x.com

Geospatial Business Spotlight: Mapillary

Company Name:                 Mapillary

Website:                              http://www.mapillary.com/

Established:                       2013

THE COMPANY

Mapillary is a new and different approach to Street View. Using computer vision, Mapillary stitches together photos taken with any device to create street-level imagery for extracting geospatial data. By empowering anyone anywhere to easily create street-level imagery, Mapillary aims to create a photo representation of the world. To date, Mapillary’s community has contributed 63 million photos spanning over 900,000 miles across all seven continents.

Mapillary was founded in 2013 by Jan Erik Solem, Johan Gyllenspetz, Yubin Kuang, and Peter Neubauer, who share a vision for putting mapmaking into the hands of people everywhere. Solem, who serves as CEO, previously founded Polar Rose, a facial recognition software that was bought by Apple in 2010.  The company is headquartered in Malmö, Sweden, and has fifteen full-time employees located around the world.   Mapillary’s New York office is based In Brooklyn, NY.

PRODUCTS AND SERVICES

Mapillary allows community members to create and explore a crowd-sourced, street-level view of the world through its app, which is available for web, iOS, Android, and Windows Phone. Users can upload photos from their smartphones or other digital cameras and Mapillary then combines the images together geotagging each using GPS metadata. The resulting 3D reconstruction is created using computer vision and the company’s own open source “Structure from Motion” algorithm. Mapping isn’t limited to streets—the community has captured hiking trails, favorite bike routes, and even a stretch of Antarctica. Mapillary integrates with any mapping platform through simple APIs.

Street-level photos can be captured using Mapillary's iPhone app

Street-level photos can be captured using Mapillary’s iPhone app

In addition to creating photo-maps, Mapillary also utilizes computer vision techniques to extract useful data from uploaded images. For instance, the software can recognize symbols on street signs in photos taken in the U.S. or Europe. This capability grew out of the app’s need to blur faces and license plates for privacy purposes, and is now used by groups like city governments for urban planning, land surveys and asset inventory. Using Mapillary with Esri’s ArcGIS platform has helped cities streamline infrastructure updates, from speed limit changes to road surface quality checks.

Mapillary uses computer vision to automatically detect traffic signs and extract geospatial data

Mapillary uses computer vision to automatically detect traffic signs and extract geospatial data

Humanitarian organizations also use Mapillary to further their initiatives. In Haiti, the American Red Cross and Humanitarian OpenStreetMap partnered with Mapillary to help record previously unmapped areas to aid disaster response efforts. Mapillary has also been used by the World Bank and other groups in Dar Es Salaam, Tanzania, to record infrastructure in flood-prone areas of the city to help plan improvements. The app is ideally suited for these sorts of tasks because it doesn’t require any special equipment beyond a basic smartphone.

Street level imagery is reconstructed by creating point clouds from photos.

Street level imagery is reconstructed by creating point clouds from photos.

Mapillary is free to use for individuals and for non-profit or educational purposes. For commercial solutions, ranging from embedding a photo-map into a webpage to extracting specific data from images, Mapillary has several pricing plans available.

Westchester County GIS is using the Mapillary app to inventory hiking trails in County parks

Westchester County GIS is using the Mapillary app to inventory  hiking trails in Westchester County parks

To find out more about Mapillary, visit their website.

CONTACT: 

hello@mapillary.com
Bredgatan 4, 211 30 Malmo, Sweden
www.mapillary.com