Campus Planning and Geospatial Technologies at UAlbany

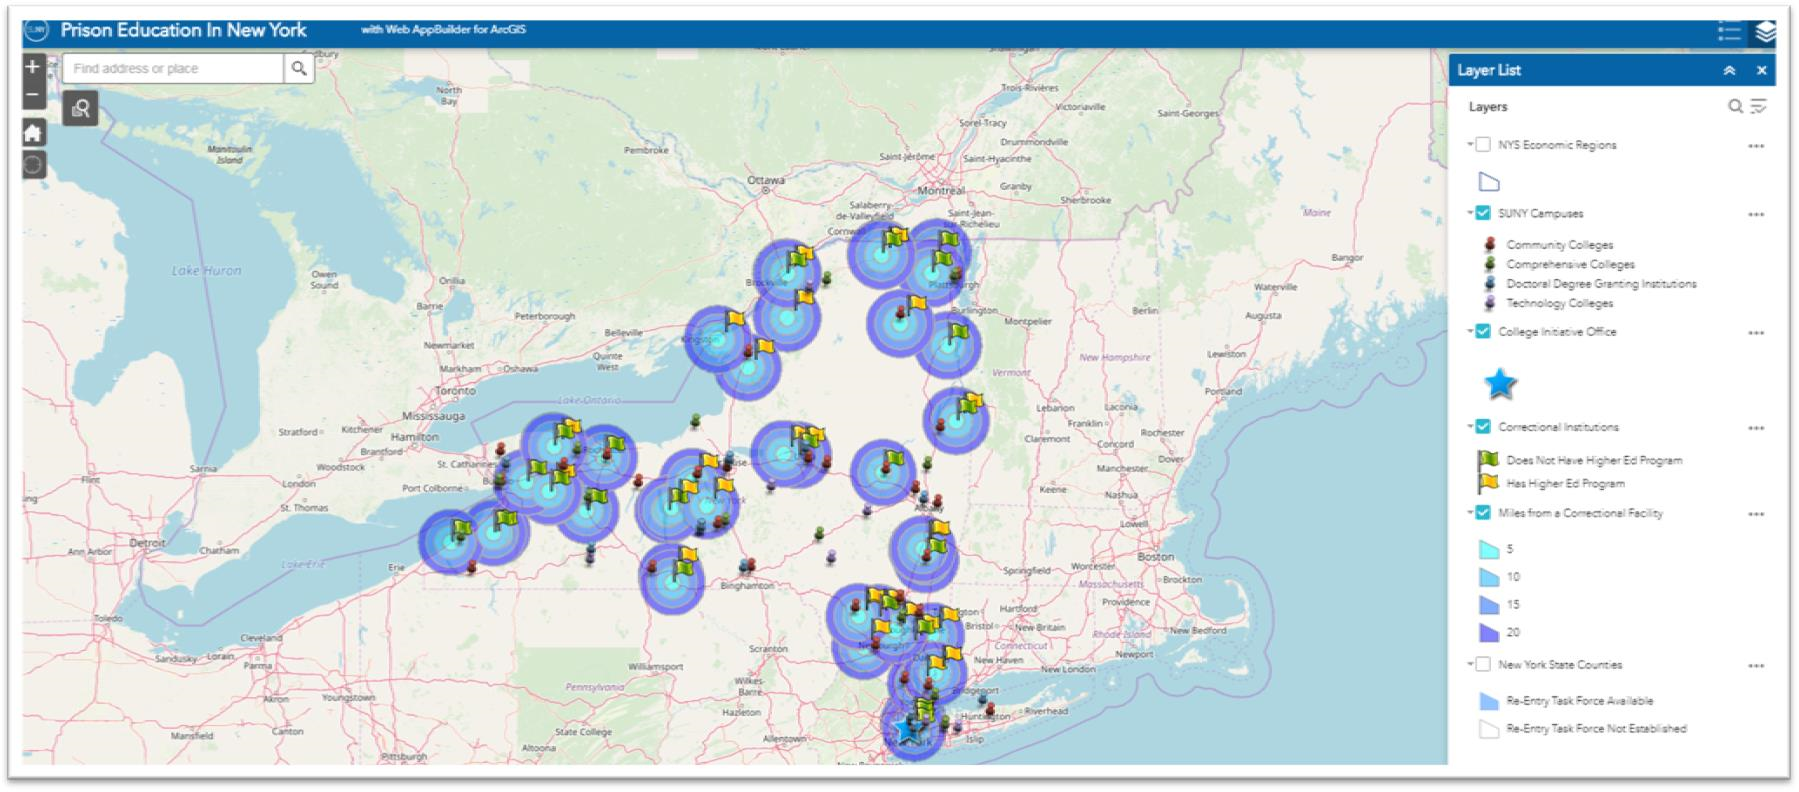
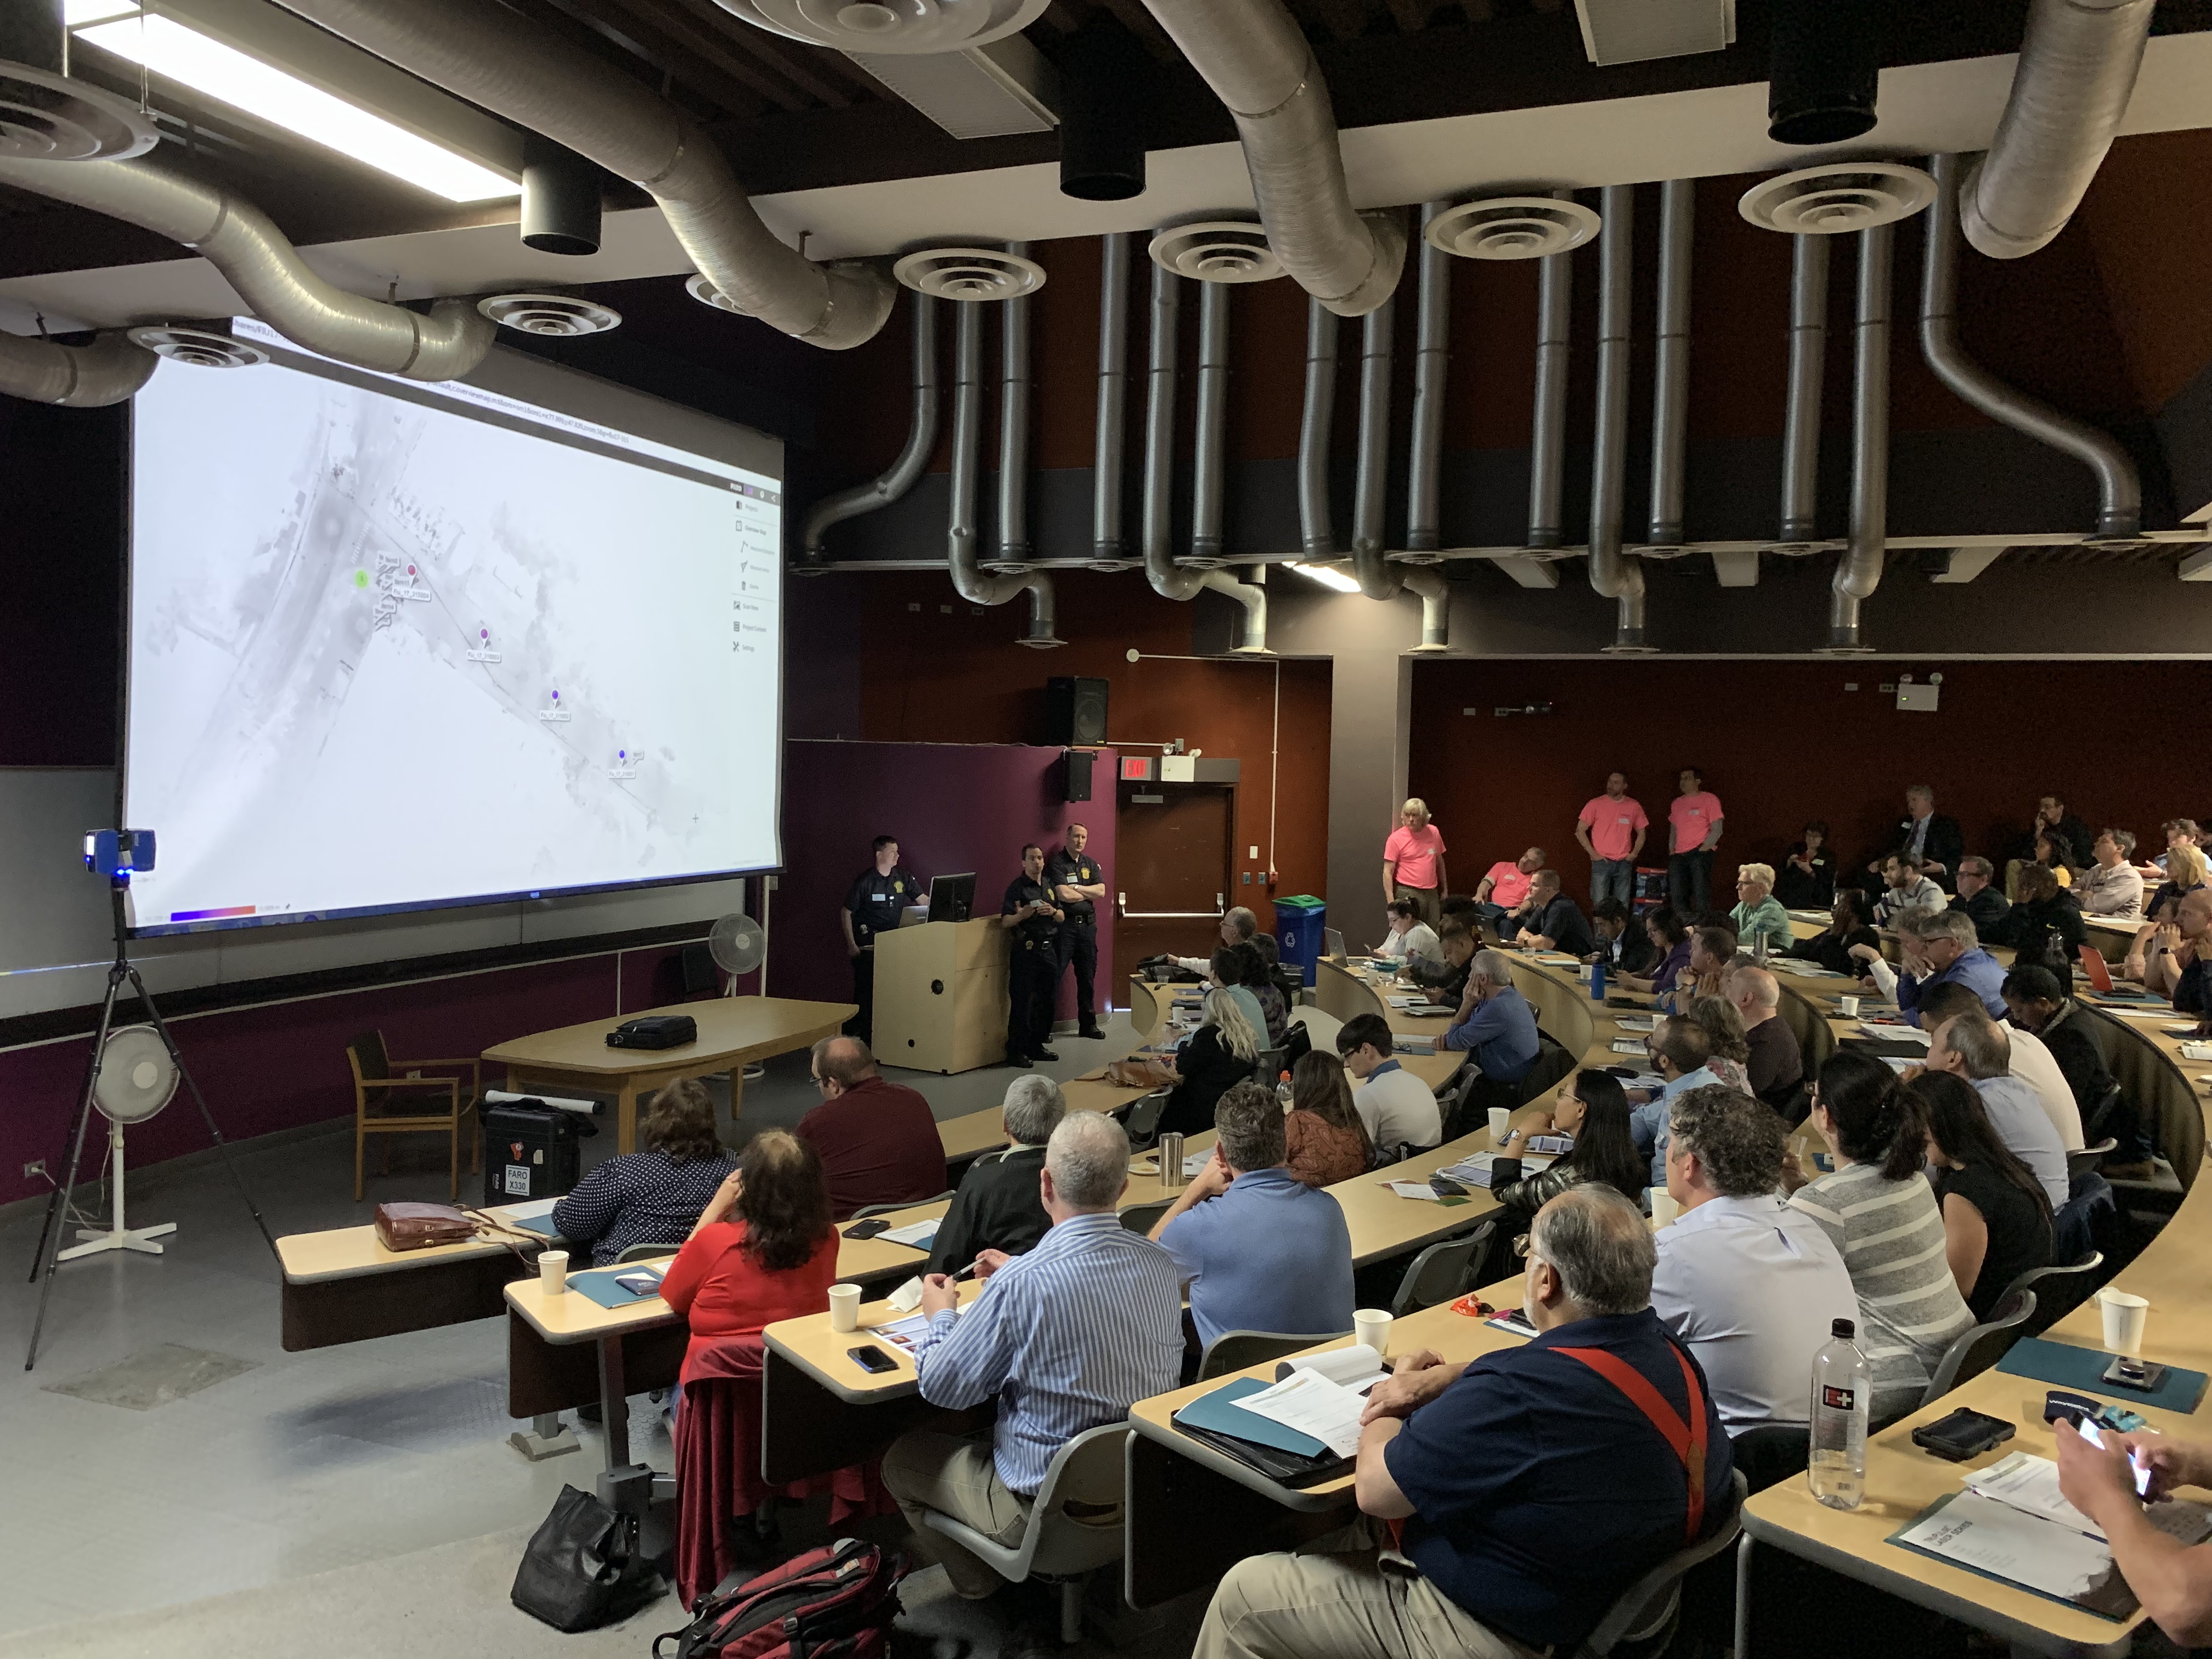
GIS used in many areas alongside engineering and architectural applications

College and university campuses are the home for a vast amount of geospatial data covering both the natural and built environments.  Whereas at the beginning of geospatial era there was a clear and defined digital divide – GIS vs. CAD –  today these technologies have evolved to be used and managed together almost seamlessly.  In this space since the early 2000’s we’ve seen the evolution of the Building Information Model (BIM) in along with drone, GPS, and laser scanning technologies serving as a means to capture and generate additional types of geospatial data both indoor and outdoor.  GIS concepts are also important elements integrated into Enterprise Asset Management (EAM), Computer-Aided Facilities Management (CAFM) and Computerized Maintenance Management System (CMMS) solutions.

Built around the geospatial framework which also includes standards for both data collection and data management, GIS applications in campus settings are leveraged by both GIS specialists and engineers alike.  Common program areas include covering areas such as master plan support, space programming, work order management, asset management, emergency management, real estate and portfolio management, environmental and regulatory compliance, and site selection studies among others.

While traditional GIS and engineering software applications such as ArcGIS and AutoCAD support much of the outdoor mapping, facility managers increasingly use a more indoor specific software programs such as Revit, Autodesk BIM 360 Ops, Cartegraph, and ESRI’s relatively new entry into this space ArcGIS Indoors, among others.   In reality, automated systems at large facilities involve a combination of the programs noted above and often also integrate other monitoring and SCADA systems.   If you are new to GIS and geospatial applications to the campus setting, here is a good overview presentation.

Campus Planning at UAlbany

Many of these geospatial-related disciplines intersect directly – and indirectly-  in the Office of Campus Planning at UAlbany which is charged with the overall planning of physical space on campus (indoor and outdoor), capital and operating funding, and supporting the strategic plan of the University.   The office currently has a team of eight which includes Jessie Pellerin who serves as GIS and Signage and Wayfinding Manager.

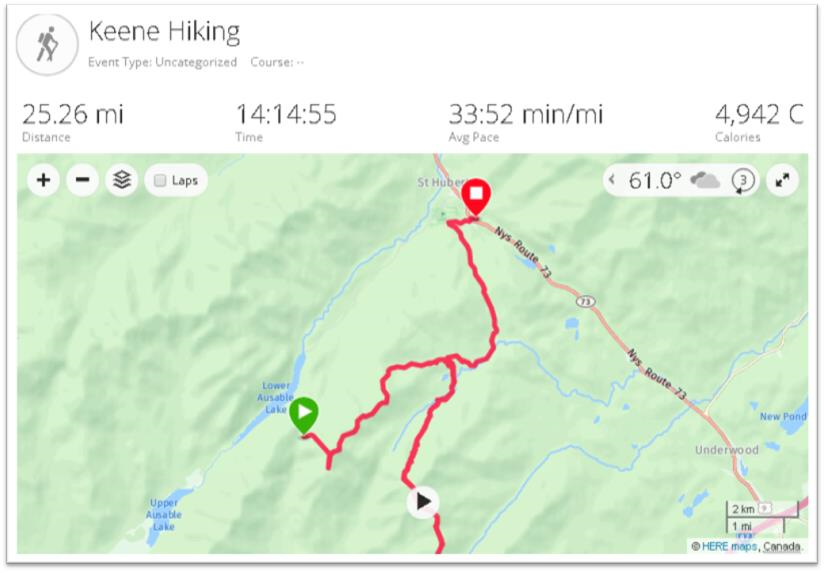
Jessie is involved with several elements of GIS data collection and cartographic products associated with the UAlbany facilities for the uptown, downtown, and Alumni Quad campuses – including the production of hardcopy maps which are still an important communications and outreach component for visitors and students new to campus.   Nearly all of her day-to-day work is done with ArcGIS Pro.  Field data collection is normally supported with Collector for ArcGIS on an iPad and for offline viewing.

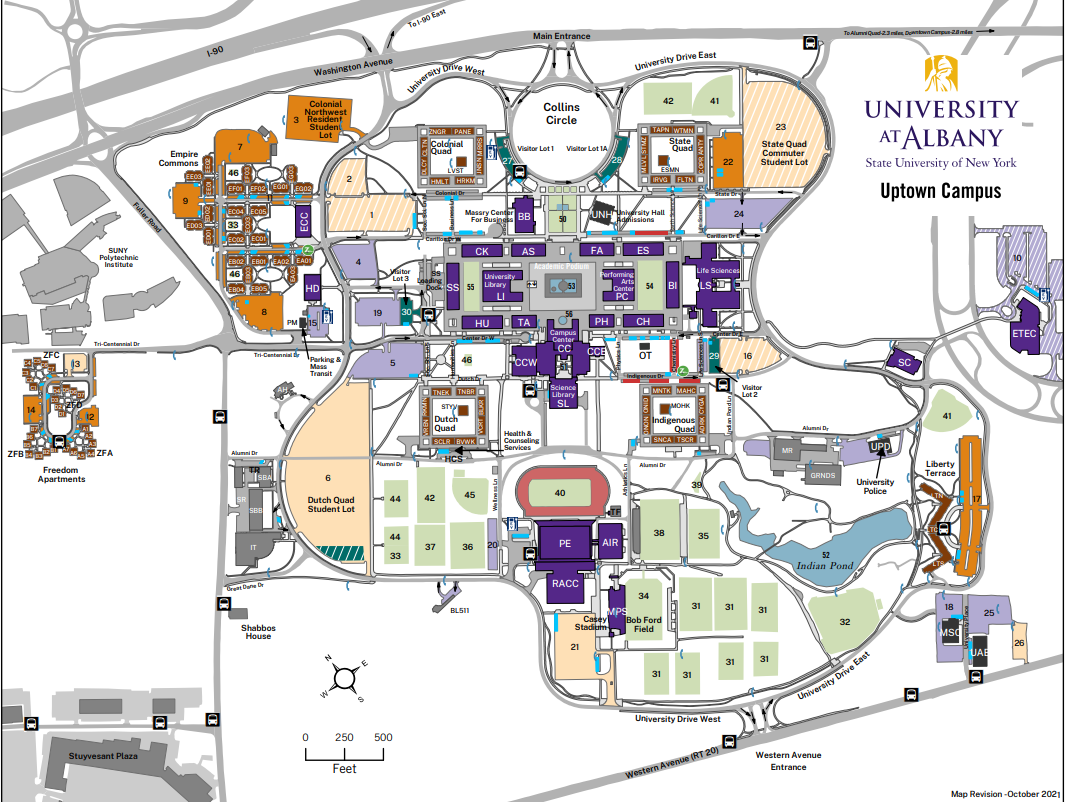
Jessie produces all of the UAlbany maps using just ArcGIS Pro without the use or addition of any desktop publishing software

With regard to above and underground features on, the 500-acre uptown camps, she helps manage a GIS database which includes 122 emergency blue light phone locations, 16.5 miles of storm sewer pipes and 760 catch basin, 6.4 miles of sanitary sewer pipes, 1500 light poles and 12 miles of roads among dozens of other features. Jessie also oversees individual data collection projects conducted by vendors such as the campus wide light poles and irrigation system.   She serves as the ArcGIS Online Administrator for the Office supporting and maintaining several customized viewers for 50 staff across campus in specific work program areas.

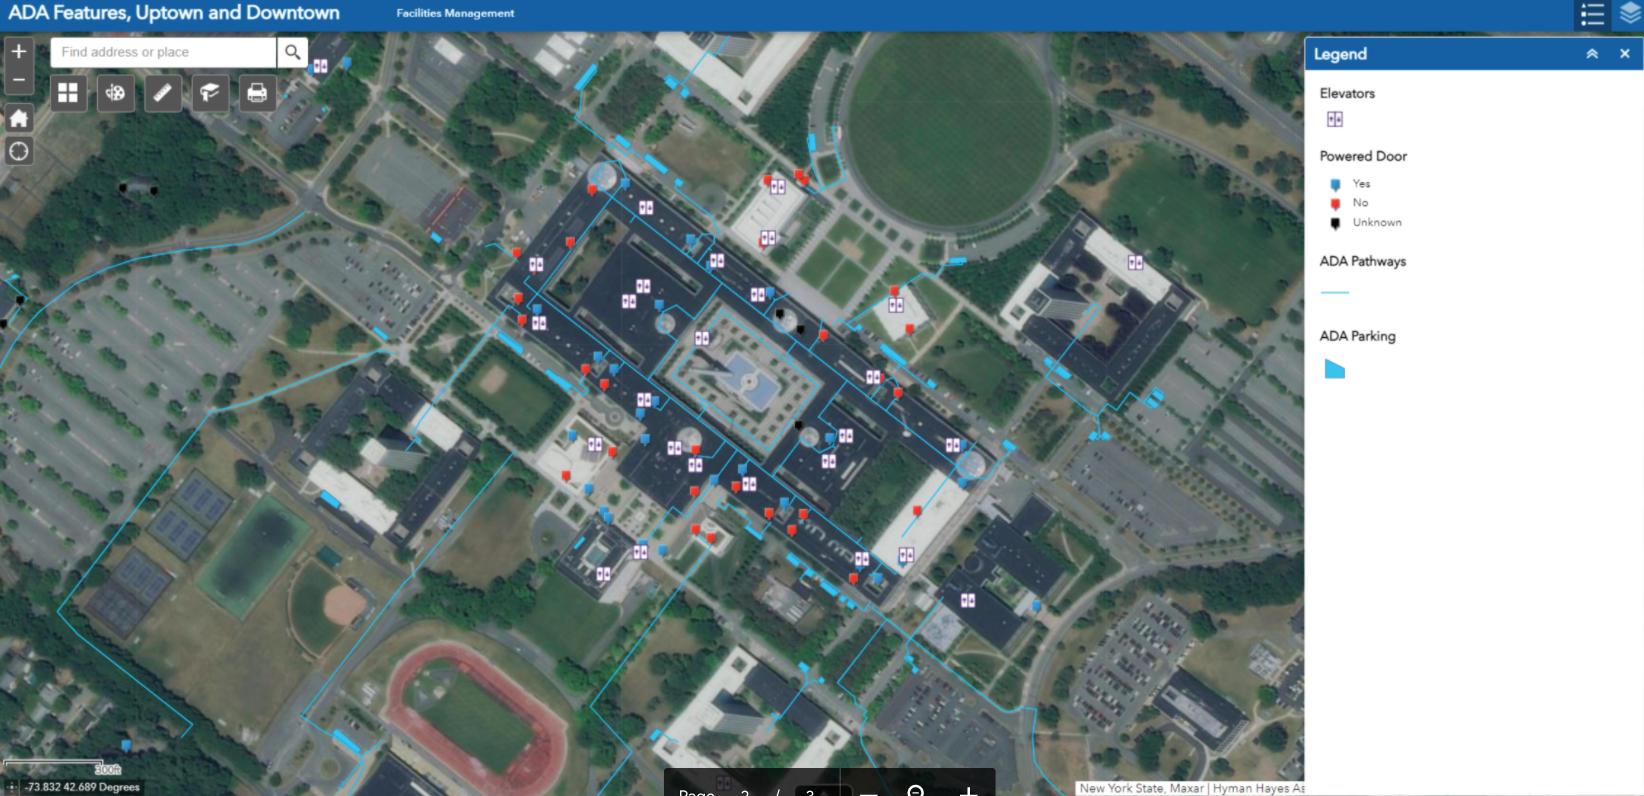
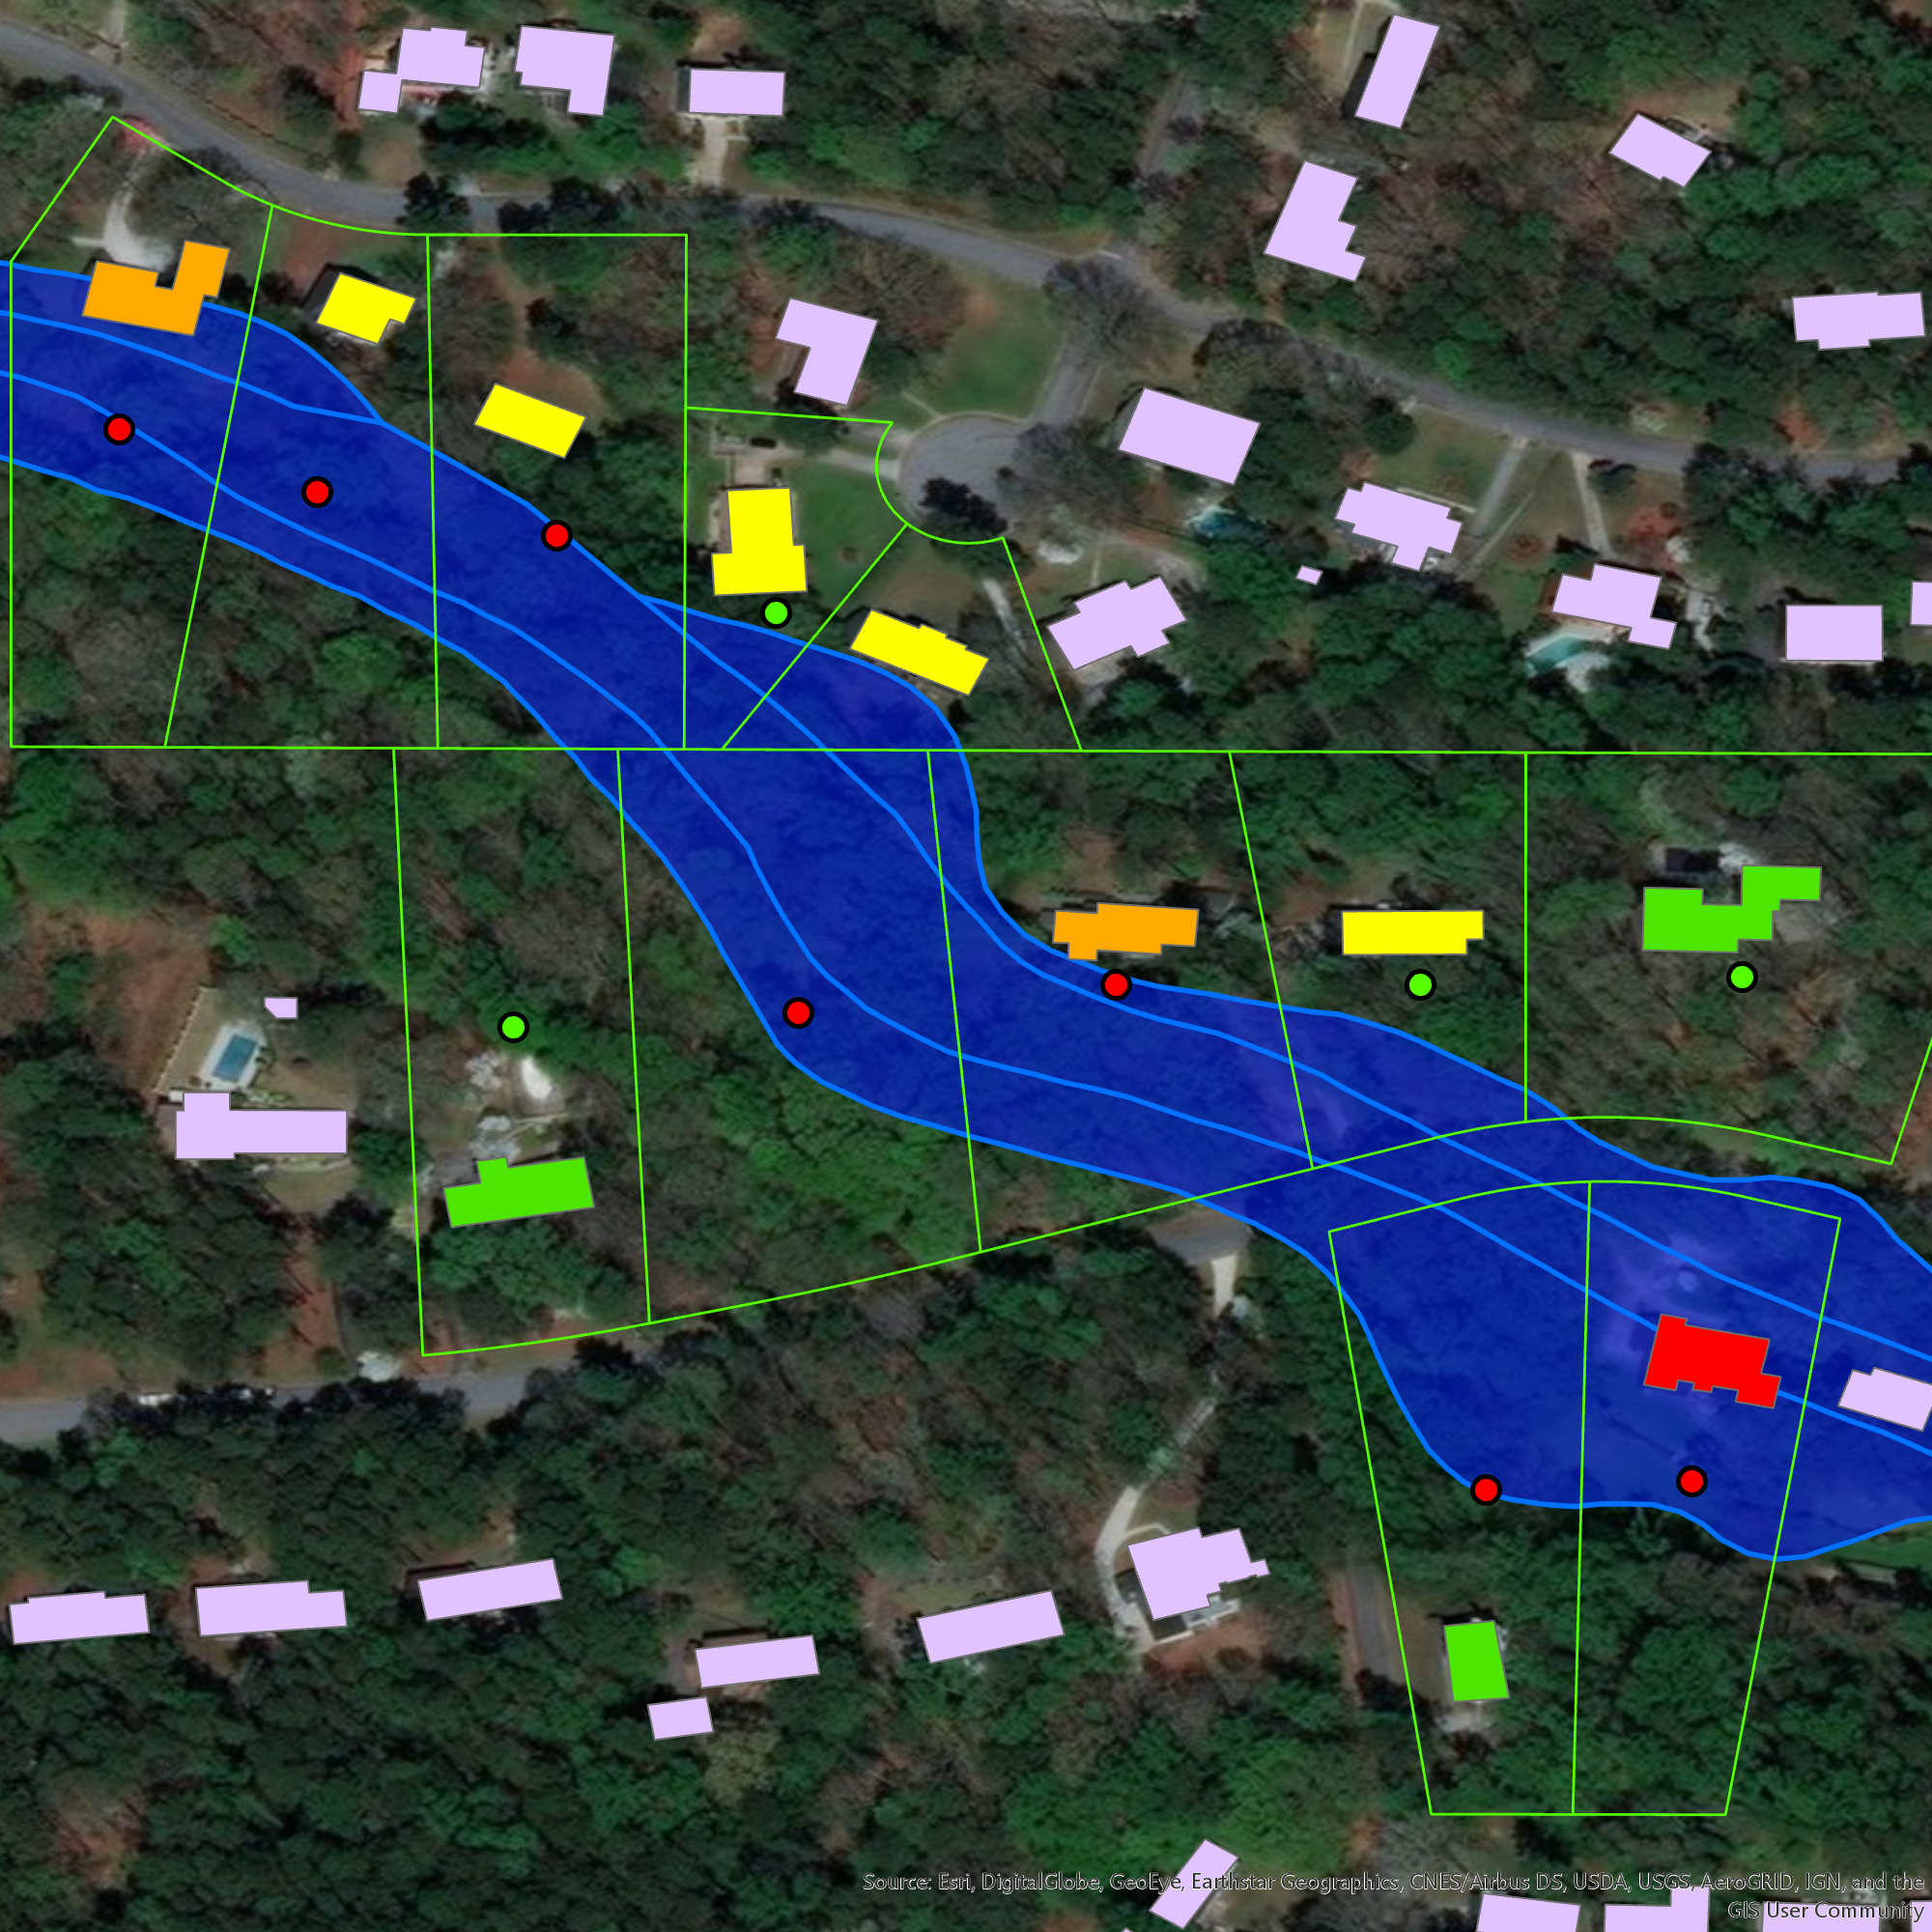
One of internal AGOL viewers Ms. Pellerin supports focuses on the locations of accessibility features on the Uptown and Downtown Campus. Pop-ups include more information for each feature. Data was developed from a campus-wide accessibility study.

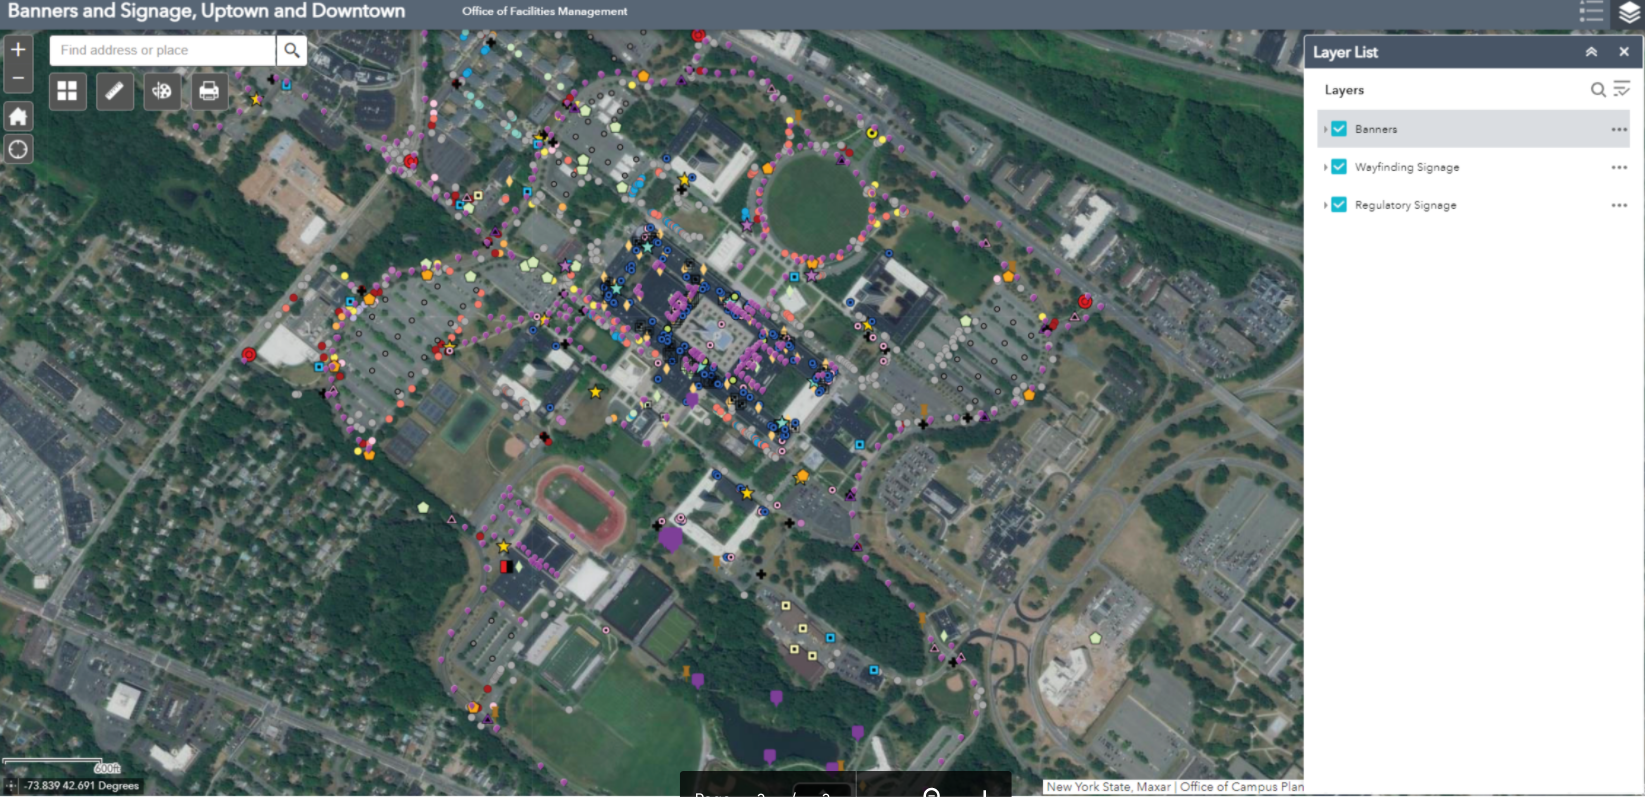
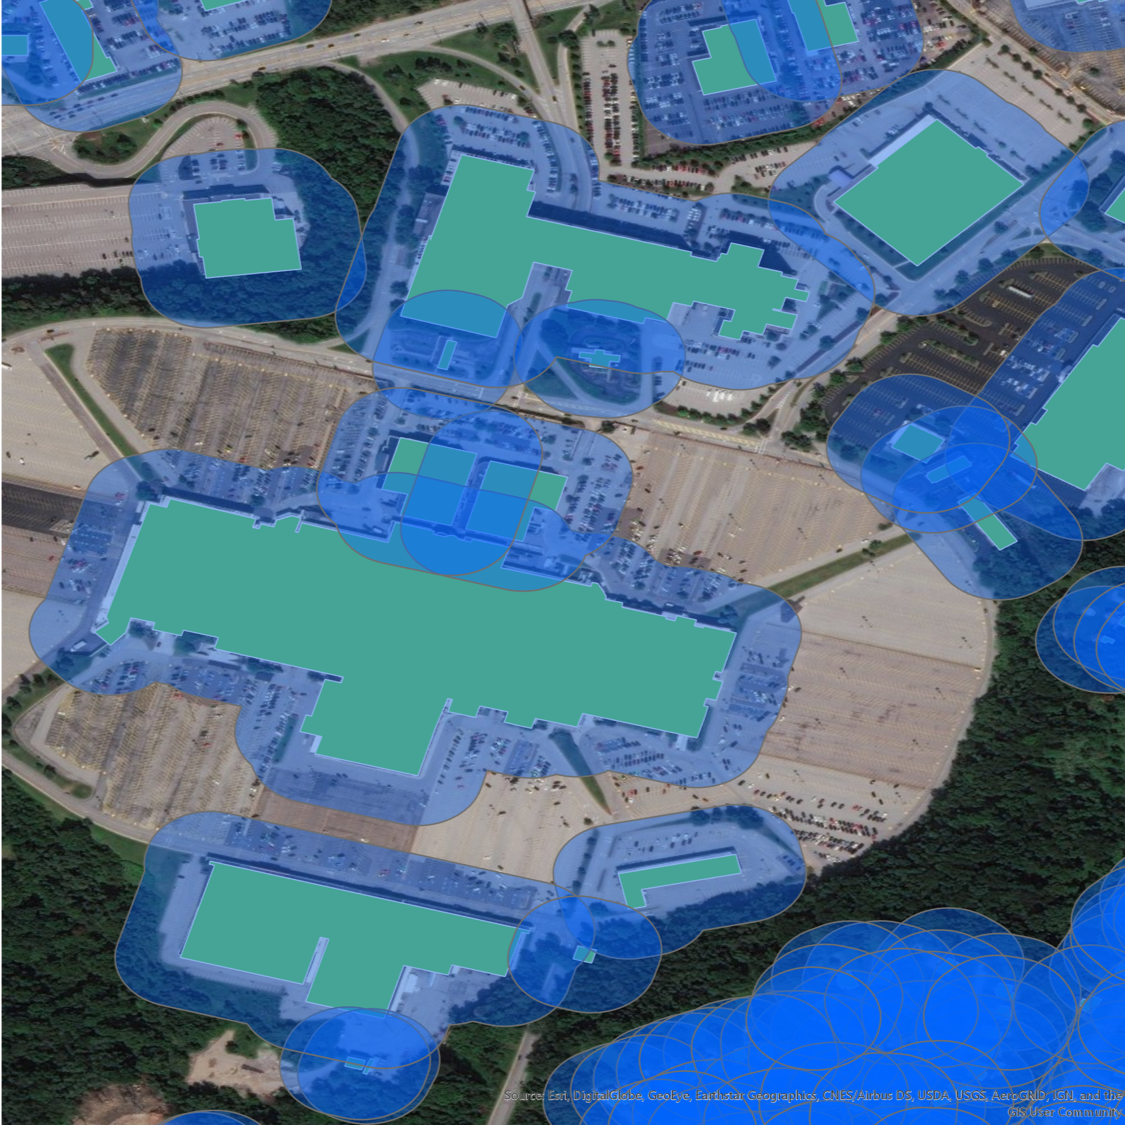
Another viewer shows the location of the exterior wayfinding and regulatory signage and banners on campus. With over 500 exterior wayfinding signs, 750 regulatory signs, and 550 banners, GIS has been essential in keeping track of sign content and condition for aiding in preventative maintenance, site planning, and branding initiatives. Both of the above viewers were built with Web App Builder.

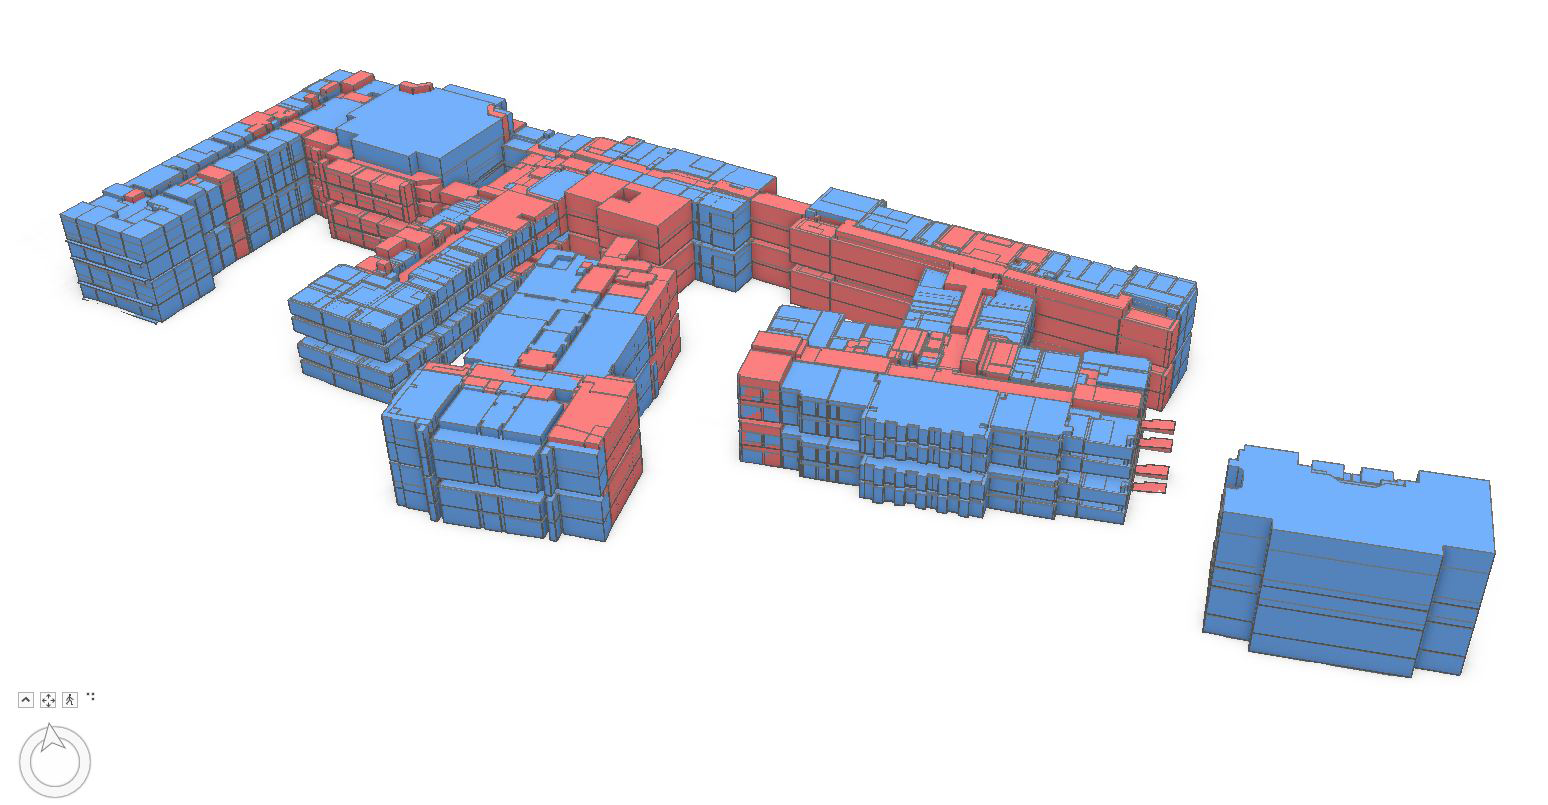
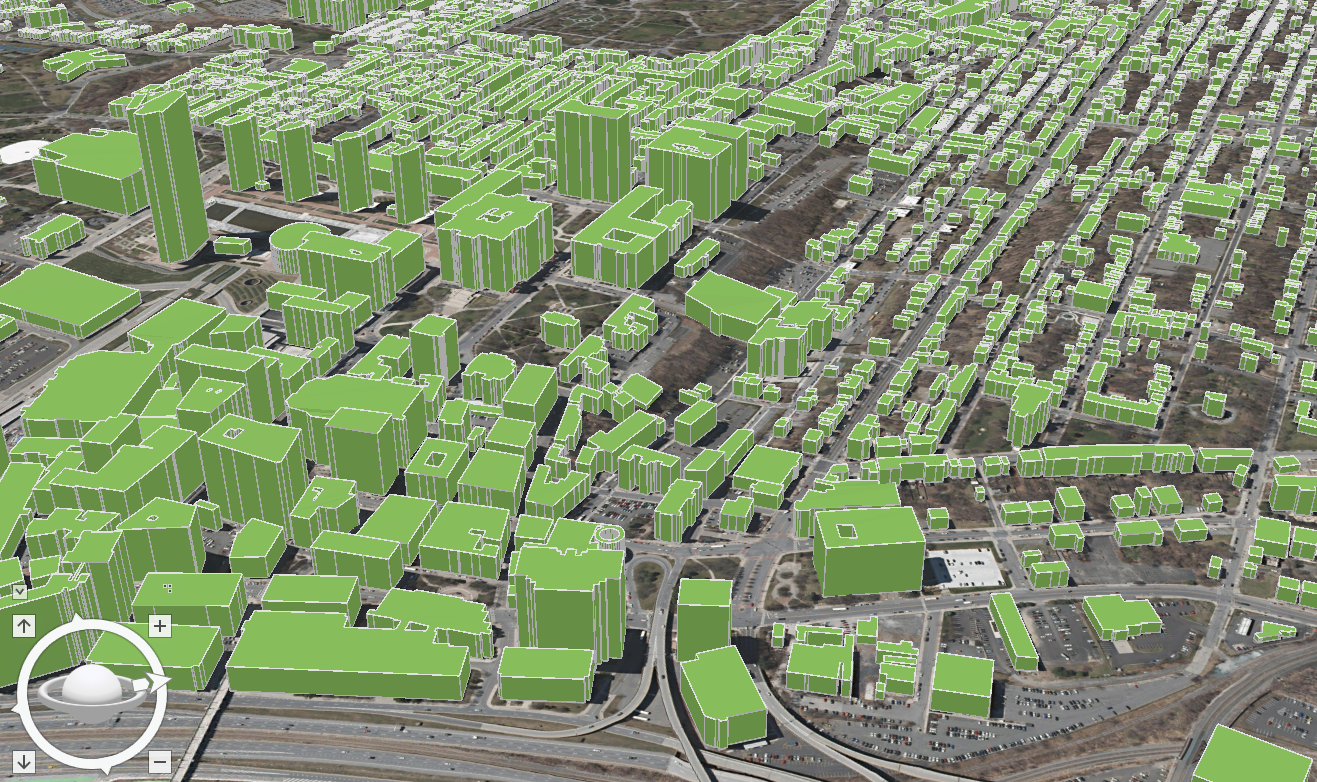
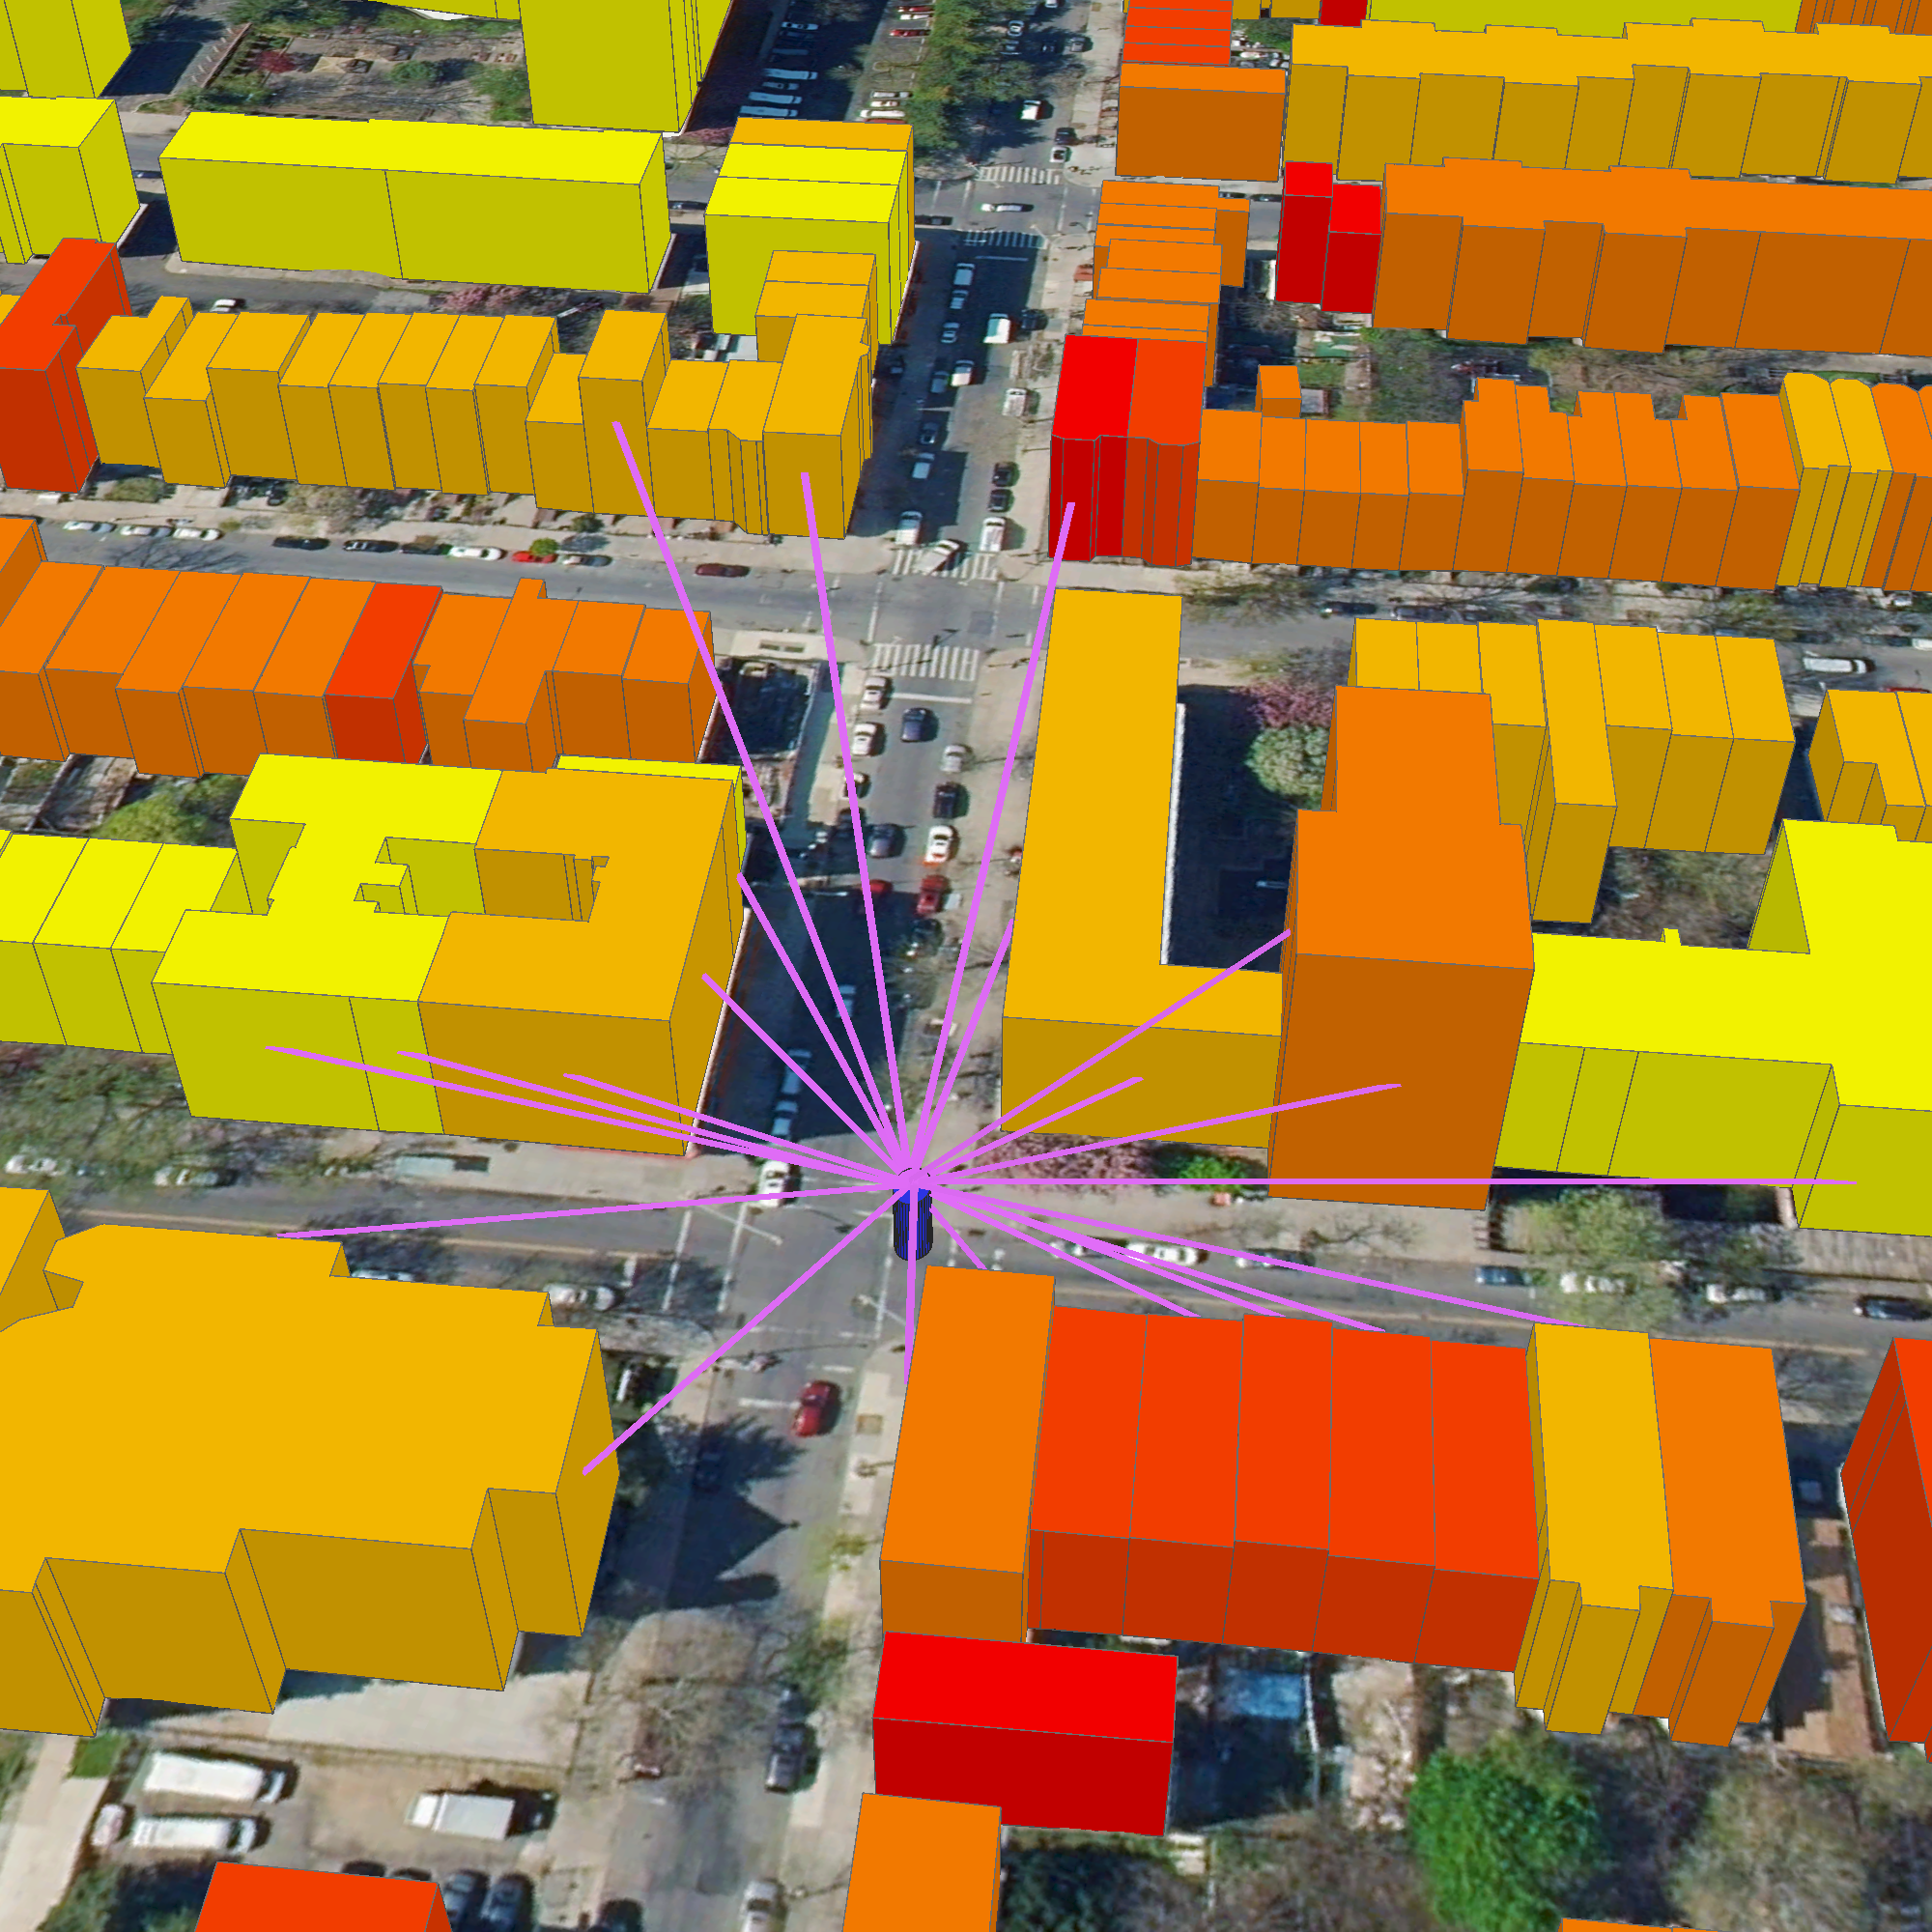
An example of how space planning is supported using GIS at UAlbany. This graphic shows a 3D visualization of assignable space on the Downtown Campus

As part of supporting the university’s COVID-19 response, Jessie assisted with others by using combining mapped sewer line and manhole data with the occupancy count of each of the residential dorms, to determine the optimal locations for the waste water testing sites in 2020. There ended up being six manholes selected (out of the 282 on campus). Maps were shared with other stakeholders in the project.    

As it relates to campus settings, GIS use is growing and being used more often in buildings and facilities planning by campus staff” notes Stu Rich, Director, Buildings and Infrastructure at Cartegraph.  Initially, as outdoor GIS concepts and technology were beginning to be applied to the indoor environments, cost was often a barrier to get started in building BIM and interior models for many organizations.  “Those barriers are beginning to change” Rich further adds, “While precision indoor mapping will always require higher-end instrumentation, recent products such as MagicPlan and IndoorVu, as well as falling software prices, are making interior mapping and data capture more affordable for large facilities management programs.   All of these products and technologies are now broadly used in facilities management and integrated with GIS applications.”

Recognizing the importance and growth of using digital data both in-house and with the numerous engineering companies performing work on campus, both the Office of Campus Planning and the Office of Architecture, Engineering, & Construction Management (AECM) have developed digital data standards for BIM, GIS, and AutoCAD.

Summary

Large campus facilities such as SUNY Albany bring together the intersection of several geospatial technologies.  Individually each seemingly used or applied for one specific purpose (and often at varying levels of spatial accuracy) but when mashed together in a just web viewer, provide easy access to a wide range of authoritative digital content for decision-makers. Sure signs of the growing maturity and acceptance of geospatial technologies.

Contact:

Ms. Jessie L. Pellerin
GIS and Signage and Wayfinding Manager
Office of Campus Planning
University at Albany, State University of New York
jpellerin@albany.edu

Cash Savings: Affordable Geospatial Bachelor Degrees in New York State

While putting together my last article (GeoSpatial Student Spotlight), I came across a related article that’s worth a quick mention.  In the same academic space, it is an article by the online site Affordable Schools which is essentially a clearinghouse of sorts, inventorying and ranking schools  on a wide range of academic programs and professional fields on three core metrics:   Cost (affordability), class size (student-to-faculty ratio) and student success (graduation rate).  The report is entitled: “30 Best Affordable Geographic Information Science and Cartography Degree Programs (Bachelor’s) 2020”.

Albeit not in the same conversation as the more esteemed college ranking reports by Forbes, U.S. News and Word Report, or Niche, the Affordable Schools evaluation approach is relatively simple in how data is collected/evaluated and from what sources.  And yes, the bottom line focusing on affordability.  Best yet, it paints an outstanding picture of affordable traditional geographic information science/system (GIS) bachelor degrees in New York State when compared against the field across the United States.  Interesting results with four New York State schools in the top thirty with three in the top ten.  All are SUNY schools which speaks volumes to the affordability of higher education opportunities in this space across the Empire State.

Points for ranking the schools and their affiliated geographic information science/system programs were allocated in the following manner:

Those schools in New York State identified in the “30 Best Affordable Geographic Information Science and Cartography Degree Programs” (2020) include:

#30      Farmingdale State College
Farmingdale, NY 11735
Points:  6
#6        SUNY Cortland
Cortland, NY  13045
Points:  7
#3        University of Buffalo
Buffalo, NY  14260
Points:  8
#2        SUNY College at Potsdam
Potsdam, NY  13676
Points:  8

Potsdam and Buffalo ending up with the same point total but Potsdam most likely getting the slight higher ranking due to a slightly lower in-state tuition fee and Buffalo having a much higher out-of-state tuition price tag.  While University of Buffalo has been a mainstay on the Empire State higher education geographic information science/system stage for over three decades – the Farmingdale, Cortland and Potsdam programs are of more recent development. The University of Buffalo is one of the three original universities associated with the The National Center for Geographic Information and Analysis (NCGIA) formed in 1988.

Again, the caveat here is that this is 2020 data and for traditional, on-campus bachelor degree programs – which almost seems like an oxymoron in July 2021.  So while there may be some resemblance to a “return to campus” in the years ahead, the COVID pandemic has most probably changed the delivery of higher education classes and programs to some extent for good.  And with it, creating more educational opportunities, all levels,  in the online environment.  For 2020 affordable online bachelor geospatial programs, there is the OnlineU website though only with ten schools identified and none within New York State.  Though the good news with online opportunities is that there is a growing acceptance and presence across the Empire State in certificate programs and perhaps even the availability of an online Associate Degree in the future.  Such discussion will be the subject of a future eSpatiallyNewYork blog post.

Of course the programs itemized above are not the only schools in the state which offer bachelor programs in geography information science/systems, geography, and  related technologies. Four-year, masters and PhD programs are available at universities in the New York City as well as other SUNY campuses which can be identified by using the SUNY “Find Your Major” search widget here.

Spread the news.


Geospatial Student Spotlight: Ge (Jeff) Pu

Academic Institution:

SUNY College of Environmental Science and Forestry
Department of Environmental Resources Engineering
Ph.D Environmental Resource Engineering (Dec 2020)

Drexel University
Department of Civil and Environmental Engineering
B.S. & M.S. Environmental Engineering

Research Focus:

Ge’s doctoral research focused on monitoring riparian vegetation conditions overtime and quantifying correlations to selected water quality variables. In addition, he focused on quantifying the impact of riparian vegetation presence on river channel boundary changes. Such riparian vegetation environments have a significant role in filtering contamination and maintaining water quality in riverine and stream systems. His research involved the use of high spatial resolution aerial photos to detect and delineate riparian vegetation status. Riparian ecosystems across New York State remain under stress from climate change, agricultural practices and urbanization.

Study Area and Background:

Ge’s study areas included the Genesee River which originates in Gold, PA flowing north to Rochester, NY and ultimately into Lake Ontario.   Land cover in the study area is dominated predominately by agriculture and forest, with smaller amounts of developed land, including a mixture of residential, commercial, transportation, and other non-developed lands.  Various parts of the Genesee River are currently listed as impaired on Section 303 (d) of the Federal Clean Water Act based on the presence of various pollutants, which includes phosphorus, sedimentation, oxygen demand, and pathogens.  Riparian buffers along the Genesee River play a significant role in improving the overall condition of the river and help combat many of the water quality related problems through filtering various contaminations, trapping sedimentation and ultimately improving river water quality.

The Mount Morris gravity dam on the Genesee River was utilized as a separation point when comparing the results of riparian vegetation indices. This separation formed a logical break since upstream of the dam the channel follows its natural path, whereas flow downstream of the dam is regulated by the dam instead of natural flow regimes.  An interactive web map of the study area is here.

The Genesee River watershed stretches from Lake Ontario in the north to Northern Pennsylvania in the south.

Data and Software:

 Data:  Central to Pu’s research was the use of the Google Earth Engine (GEE) which includes two freely accessible image programs: (1) United States Department of Agriculture National Agriculture Imagery Program (NAIP) imagery, and (2) Landsat products.  The NAIP images are airborne color-infrared orthorectified images acquired at 1 meter ground sampling distance. This fine spatial resolution enables interpolation of detailed information on the boundaries of river channels and riparian vegetation. The NAIP program collects imagery on a regular basis, with images of the study area available from 2003–2015. GEE provides access to Landsat 5 and 8 8-day Normalized Difference Vegetation Index (NDVI) and Enhanced Vegetation Index (EVI) composites.                                                     

Other geospatial datasets also utilized included USGS water quality data, and (2) National Oceanic and Atmospheric Administration (NOAA) weather data. Downstream water quality data was collected by the USGS in the Genesee River at the Ford Street Bridge in Rochester, NY and downloaded through the USGS Water Data for the Nation.  Parameters collected include water temperature, specific conductivity, pH, turbidity and dissolved oxygen.  Daily weather data is collected by the National Oceanic and Atmospheric Administration (NOAA) at three airports within the watershed: Greater Rochester International Airport, Cattaraugus County Olean Airport, and Dansville Municipal Airport. Weather parameters recorded include daily mean precipitation and daily cumulative air temperature. Weather parameters across the three stations were averaged to eliminate micro climate effects. Water flow/gauge data provided by the U.S. Army Corps of Engineers.

 Software:  Data was examined and processed in a variety of desktop software packages and cloud platform including, as previously identified, Google Earth Engine as well as  ArcMap, QGIS and R.

 Project Findings:

This project developed a new method to extract multi-temporal riparian vegetation indices directly from satellite image composites which included five major steps: (1) Identifying the channel boundary, (2) creating a buffer around the channel, (3) classifying land cover within the riparian buffer, (4) converting pixel-based vegetation buffers to polygons, and (5) generating final riparian buffer boundaries.

Pu’s Genesee River riparian mapping was based on GEE’s multi-petabyte catalog of satellite imagery and geospatial datasets which are available for scientists, researchers, and developers to detect changes, map trends, and quantify differences on the Earth’s surface.

The project utilized GEE for both image processing and spatial analysis processes, along with some usage of QGIS.  GEE was found to provide an efficient means to perform environmental data monitoring because it eliminates the processing time and effort involved with downloading, sorting, and combining datasets in order to perform the calculations and other processes necessary to obtain time series vegetation index data calculations.

Findings indicate that downstream water temperature and dissolved oxygen have moderate to strong correlation to riparian vegetation index (magnitude of Spearman’s correlation coefficient generally above 0.5), while other water quality parameters do not. Water temperature was positively correlated with the vegetation index values, while dissolved oxygen was negatively correlated. There were no significant differences in terms of correlation between the two sections of the river.

Analyzing nearly a decade of imagery covering the Genesee River footprint, Pu’s research shows the meandering of both the main river channel and at major river bends both of which impact adjacent riparian habitats.

Overall, the study developed a new method to rapidly extract time series of riparian vegetation indices directly from satellite image composites.  In delineating the main channel of the Genesee River and mapping riparian vegetation within 90 meters of the channel the research observed the expected annual trends, where the index rises in the summer season while falling in the winter season.

Findings will be useful to riparian stakeholders and managers to conduct informed riparian vegetation management and restoration. Delineating riparian vegetation extent from higher resolution imagery allows one to identify riparian zones that have significant riparian removal or channel variations and to prioritize restoration sites considering both spatial and temporal scales. Results drawn from Pu’s research has been and will continue to be presented at local and international conferences for improving current riparian management approaches.

A more complete and detailed document on Pu’s research containing further discussion/analysis, statistics and graphs, and summary details can be downloaded here.

Google Earth Engine (GEE):

 Jeff’s extensive use of GEE as part of this doctoral work led to additional work which was primarily funded through AmericaView and SUNY-ESF.  Funded primarily through a grant from the U.S. Geological Survey, Ameriview is a consortium comprised of university-led, state-based consortia working together to sustain a network of state and local remote sensing scientists, educators, analysts, and technicians.   The state’s AmericanView affiliate is New York View   (NYView) which is administered through the Department of Environmental Resources Engineering (ERE) at SUNY-ESF.  The NYView academic consortium includes the State University of New York (SUNY) College of Environmental Science and Forestry (ESF), the Institute for Resource Information Sciences (IRIS) at Cornell University, SUNY Fredonia, and SUNY Plattsburgh.

Through this NYView project, Jeff developed a series of 16 free-to-access Google Earth Engine online training videos (available on YouTube) for the beginner to advanced which demonstrate applications to support teaching, research, and outreach in remote sensing and image processing.  GEE is a cloud-based platform that combines a catalog of satellite imagery and geospatial datasets with planetary-scale analysis capabilities. This platform is available for academic, non-profit, business, and government users to analyze and visualize the Earth’s surface.  He was able to also work closely with the Google Earth Engine development team which provided access for development and programming assistance.  A one-page summary of the NYView 2019-2020 Mini-Grant project can be downloaded here.

Summary:

Jeff is currently preparing for a postdoctoral research position. He hopes to become a professor in the future based on his of research and associated work in academia.  His research interests continue to evolve in the realm of water resource engineering with a focus of utilizing the latest technologies to help solve water resource challenges across both urban and rural environments.

Contact:

Ge (Jeff) Pu
State University of New York – College of Environmental Research and Forestry
Department of Environmental Resource Engineering
gpu100@syr.edu

Dr. Lindi Quackenbush
Associate Professor
State University of New York – College of Environmental Research and Forestry
Department of Environmental Resource Engineering
ljquack@esf.edu


Geospatial Student Spotlight: Christopher Plummer

Academic Institution:

The University at Albany, SUNY
Department of Geography and Planning
Pursuing M.S. in Biodiversity, Conservation, and Policy

B.S The College at Brockport, SUNY, Environmental Science and Biology

Research Focus:

Using drones to assess white-tailed deer abundance and habitat preference in the Albany Pine Bush Preserve

Plummer’s overall research goal was to use thermal imaging drones to perform aerial surveys of white tailed deer and associated drone technology to produce an up-to-date habitat assessment of the study area to assess both white-tailed deer abundance and associated habitats. Plummer’s research proposes drones:

  • Offer a faster and lower cost of aerial data capture
  • Can be flown with lower detection from wildlife
  • Can be equipped with thermal sensors to aid in wildlife detection
  • Offer high accuracy population data with robust statistical strength

Study Area and Background:

Located northwest of Albany, the Albany Pine Bush Preserve (APBP) is approximately 3,350 acres supporting a broad variety of habitats highly fragmented by roads developed areas.  Hunting, fishing and trapping are recreational activities that are carefully regulated in the preserve following relevant APBP and New York State Dept. of Environmental Conservation (NYSDEC)  rules and regulations.

Historically, the monitoring of whitetail deer (WTD) has been difficult to establish due to obtaining reliable abundance estimates as traditional survey methods are normally very work intensive and/or expensive.  In the past such estimates have been done within the preserve with spotlight surveys and camera trap surveys.

(Historically, obtaining reliable abundance estimates of white-tailed deer has been difficult to establish, with more traditional methods being work intensive and/or expensive, and having issues with imperfect deer detection. In the past such estimates have been done within the preserve with spotlight surveys and camera trap surveys. Plummer plans to use the findings from the previous work to help understand how the use of drones compares to the more traditional survey methods.

Unmanned Aerial Vehicles (UAV) technology, more commonly called drones, was chosen as a means to facilitate WTD data collection and analysis in the Preserve.  Specifically, DJI Mavic 2 Enterprise Dual was used for the thermal deer survey while other DJI drones (Phantom 4 and  Insprie 2) were used to help create the orthophoto map.  A MicaSense RedEdge 3 multispectral camera which was attached to one of the drones helped pick up additional reflectance characteristics of varying vegetation types.  This camera has 5 bands, with the two additional bands sensing red edge (~715 nm) and near infrared (~825nm) wavelengths.

Universal Ground Control Station (UGCS) and DJI Pilot software was used to develop flight plans over three distinct focus areas in the Preserve.  Multiple flights were made to acquire enough images with sufficient overlap.  Plummer used Agisoft photogrammetry software to generate orthophotos of the study areas.

ENVI software was used to generate a supervised canopy cover classification of the study area.  Plummer was able to classify the entire orthophoto with >95% accuracy into herbaceous/open canopy, deciduous canopy, coniferous canopy, bare ground/no canopy, and developed canopy.  ArcMap 10.6 was used in a variety of ways as well as R-Studio and Microsoft Excel for data analysis.

Three flight plans in Blueberry Hill East and West and the Kaikout Kill Barrens

The research team flew a total of 34 surveys between March 9th and May 22nd 2020 with all flights occurring within 1 hour of sunrise collecting over 950GB of imagery files.  A total of 405 deer were spotted and identified in 143 unique locations.

Silhouettes of five deer as seen through Plummer’s use of thermal imaging photography

Project Findings

Plummer’s initial calculated observed average density of 13 deer per sq. km is unlikely to be uniform over the entire Preserve due to varying  landscape dynamics and various habitat types. The abundance within their study area varied widely over time, which Plummer suggests  is explained by daily movements made by individual groups into the nearby residential areas.  With regards to habitats, deer were more frequently found in the following areas of the Preserve:  (1) areas of recent timber harvest, (2) Pitch Pine cover and in the pitch-pine scrub oak barrens, (3) areas with significant dune activity, and (4) close to the edge of Preserve boundaries. He believes this new method for assessing white-tailed deer abundance has high potential in the wildlife monitoring space and hopes  his findings about deer within the Preserve will help generate well informed deer management decisions.

Plummer generated a habitat classification map based on the percent of each canopy type within a 50m x 50m grid covering the entire study area. The Pitch Pine Dominant Forest habitat along the southern border of the Preserve was one of the areas with the highest WTD counts.

Actual WTD observed during any given survey varied over time. Over the near three month data collection period in early 2020, WTD observation counts ranged from 1 to 30

Summary

Plummer’s SUNY Albany graduate work suggests that thermal drones are a viable tool to assess WTD population dynamics and can generate reliable abundance estimates.  Drone deployment provides the ability to survey large geographic areas in a small amount of time and a cost effective manner.  Results show that deer use a variety of habitat types in the Preserve and numbers at any one location varies temporally.  A detailed video presentation Chris made outlining his work to the members of the APBP is available here on YouTube.

Post-graduate work, Plummer would welcome the opportunity to work for an agency such as U.S. Fish & Wildlife Service or NYSDEC Division of Fish and Wildlife. He’s not opposed to going back to school for a PhD but not anything immediately.  He is also very interested in public policy related to climate change and sustainability.

Contact:

Chris Plummer
Graduate Student
University of Albany
Geography and Planning
ccplummer@albany.edu

Dr. Alexander Buyantuev
Associate Professor
University at Albany
Geography and Planning
http://www.albany.edu/gp/Buyantuev.php

Geospatial Business Spotlight: Adirondack Research

Location:                      Saranac Lake, New York

Website:                       https://www.adkres.org

Employees:                  3 Full-Time / 6 Seasonal

Established:                 2012

The Company

Adirondack Research is a small business located in Saranac Lake which focuses on building expert-backed and science based geospatial solutions.  Currently the firm’s primary focus is on applications and work involving invasive species, climate change, and socio-economics.  Adirondack Research staff includes GIS specialists, web developers, and field technicians and the company produces a retail line of recreation and way-finding maps under the brand Green Goat Maps.

Geospatial software used inside the company  includes ArcGIS Pro on the desktop and ArcGIS Online for a variety of web maps and viewers.  Field data collection is also supported by ESRI tools including Collector and Survey123.  For hardcopy map production both, Adobe Illustrator and Adobe InDesign are used.

Adirondack Research’s Director is Ezra Schwartzberg who received his undergraduate degree from SUNY College of Environmental Science and Forestry (ESF),  graduate degree from University of Kentucky, a doctorate in Entomology  from Penn State and additional post-doctorate work at the University of Wisconsin.

To date,  Adirondack Research clients include the U.S. Forest Service, Adirondack Council, Lake Placid Land Conservancy, Food and Agriculture Organization of the United Nations, U.S. Department of Agriculture, ADK Action, the New York State Department of Environmental Conservation which it has contracted for several invasive species projects, and others.   While most of Adirondack Research’s work is focused in New York State and across New England, their work has taken the firm to Lebanon as well as assisting to the development of a science curriculum for elementary schools in China.

Geospatial Products and Services

  • Environmental mapping using geographic information systems (GIS)
  • Biological inventories
  • Field experiment logistics
  • Ecosystem services assessment
  • Long-term ecosystem monitoring
  • Invasive pest management planning and analysis
  • Comprehensive management plans
  • Public outreach and stakeholder engagement
  • Citizen science
  • Grant writing
  • Expert witness testimony

Schwartzberg uses research expertise to guide processes, including program design, data analysis and project evaluation.  By combining ecological research with print and digital media, Adirondack Research is able to communicate science to help our clients reach their policy goals.

Illustrative projects include:

Surveying Adirondack Lakes for Invasive Species

Over the past several summer field seasons of 2018 – 2020, Adirondack Research was contracted by the Nature Conservancy’s Adirondack Park Invasive Plant Program (APIPP) to survey lakes throughout the Adirondacks.  Data collected during these surveys was used to produce individualized lake maps of aquatic invasive species (AIS) distribution. Objectives for these efforts were twofold:

  1. Detect and delineate any new or existing invasive plant or animal infestations within prioritized lakes.
  2. Utilize a Lowrance ELITE-7Ti fishfinder to map the vegetation beds, contour lines and bottom substrate hardness of a select set of those lakes as a way to gather important data on plant distribution and other physical parameters that influence aquatic plant invasion.

In 2018, Courtney Pond in Essex County was the first year this pond was surveyed and no AIS  detected.

Mapping invasive plant beds is accomplished using a suite of software and hardware tools including GPS, sonar detecting units, C-Map by BioBase, and ArcGIS Pro.  Data from sonar units such as Lawrance Fishfinders can be translated using third party software platforms, including C-Map BioBase and ReefMaster into a format which can be interpolated with ArcGIS Pro to create visualizations of the lake bottom.  This enables staff to assess exactly where an AIS infestation is located within a larger bed of native plants and useful overtime to monitor AIS beds and their spread.  Raster layers generated as part of the work flow are then used to generate maps in ArcGIS Pro and Adobe Illustrator for final reports.  The 2019 report is complete with maps of all lakes or ponds surveyed and can be downloaded here.

Additional information on this and similar Adirondack Research invasive species projects, visit this page.

Lake Placid & Saranac Lake Winter Trails Map

While Adirondack Research makes maps for a variety of purposes to support  geospatial analysis,  ecological species distributions and for land acquisition and conservation easements, the firm also produces a line of recreation and way-finding maps under the brand Green Goat Maps.

As part of this effort, Green Goat Maps emphasizes responsible recreation and environmental stewardship by partnering with organizations to promote principles like Leave No Trace.  Maps also make reference to the proper etiquette for publicly accessible trails, how to prevent the spread of invasive species, and information and regulations specific to the areas covered in each map. Green Goat Maps has  partnered with organizations such as Barkeater Trails Alliance, the Adirondack Land Trust, and The Nature Conservancy Adirondacks in these efforts.

One example of a Green Goat map is the region’s “go-to” map for winter recreation – The Lake Placid and Saranac Lake Winter Trails Map  – which offers all of the area cross country ski, snowshoe and fat bike trails in one document.  The map highlights the Jackrabbit Ski Trail and covers ski trails from Paul Smiths to Wilmington including the popular Hayes Brook Truck Trail, Deer Pond Trails, Moose Pond Trail, Brewster Peninsula Trails, Henry’s Woods, Heaven Hill and more.  The map also includes commercial ski centers, including the Paul Smith’s College VIC, Dewey Mountain Recreation Center, Cascade X-C Ski Center and Mt. Van Hoevenberg.  For the Winter Trails Map, Adirondack Research also added trails on private and municipal land with permissions well as adding gates and parking areas which were mapped from ground research. The top banner on each map inset also shows info about what activities people can do on each individual trail network

Additionally, Green Goat gives 1% back on the sale of its maps to nonprofits through 1% for the Planet.

For more  information on this and similar Green Goat Maps products, visit this page.

Mapping Broadband Infrastructure for Essex County

A current project Adirondack Research is working on is with Essex County (as well as four other counties) and local community leaders towards designing and implementing web mapping  visualization tools which will help support and guide expanded broadband installation across the County.   These easy-to-use geospatial tools are intended to be used by local officials in multiple governments to pinpoint gaps in infrastructure coverage. Other aspects of the project include mapping the boundaries of current broadband contracts with providers across the County, checking and verifying property addresses, and performing quality assurance on plan of record build-outs.

Broadband is only available is specific areas of Essex County. Mapping at the street level by Adirondack Research will enable government officials to work with broadband providers to expand coverage.

Contact:

Ezra Schwartzberg, PhD
Adirondack Research
73 Church St
Saranac Lake, NY 12983
www.akdres.org

10 Questions: Larry Spraker

My guess the name Larry Spraker doesn’t need much of an introduction across the New York State and New England GIS landscape.   His work and contributions since the late 1980s to the geospatial community are many and have included efforts from academia, government, and for many years the private sector.  As well as a ton of volunteer work with GIS user groups and the like. It has been an privilege crossing paths with him in so many ways over the years.  

So depending on the time of day, I recommend grabbing your favorite beverage, pull up a chair and continue reading.  There’s a lot here.  And after you are done, close your eyes and envision Mr. Spraker in another time or comos. Or, as the immortal Rod Sterling would say on the Twilight Zone “Another Dimension”.  Under the bright lights, behind the desk, and waving his hands fevorishly.  Yup, that’s him in his new gig – performing his best Chris Berman “Swami Sez” imitation as he hosts the 6PM ESPN SportsCenter broadcast.

Enjoy.

eSpatiallyNewYork:  Let’s start from the beginning.   The Albany-area boy goes to SUNY Albany for undergraduate and then on to Indiana State for graduate work.  How and when did geography become your educational and professional focus? 

Spraker:  I originally went to UAlbany as a Communications major with aspirations to be a sportswriter. After realizing that was a tough gig that didn’t pay particularly well (at least back in the early 80’s), someone recommended Computer Science. After a few courses, I really liked programming, but hated the high-end math courses such as Calculus and Differential Equations. A minor in Computer Science didn’t require the math courses, so I went to my advisor and asked “What would be a good major with a Computer Science minor?”. He listed a number of majors that included Physics, Math, and the last one he mentioned was Geography. I had already taken 6 credits in Geography as electives, so I asked for more details and somehow this guy had a fair bit of knowledge in this area and explained just enough of cartography, GIS and remote sensing to pique my interest. I registered for Intro to Cartography and Intro to Remote Sensing the next semester and fell in love with the both courses, and quickly found my new major. I focused primarily in Remote Sensing as an undergrad, and my professor, Floyd Henderson, really encouraged me to go graduate school. At the time Indiana State University was a leading remote sensing program, having the first remote terminals into the mainframe computers at Purdue which was the state of the art for image processing software. Floyd knew the professors at ISU, wrote me a recommendation and helped me get a Research Assistantship, so I packed up my car with everything I owned and drove to Terre Haute, Indiana for 2 years and finished my Masters. Although I focused a lot on Remote Sensing, I got exposed to a lot of GIS as well, and by the end of grad school had really got the GIS bug.

As an aside, after I graduated from ISU and came back to the Capital District, Floyd called me and asked me if I would teach his Intro to Remote Sensing and Aerial Photo Interpretation classes while he was away on sabbatical that year. So I returned to SUNY Albany as an adjunct professor and taught his classes that year. When Floyd returned, I stayed on as an adjunct faculty member and transitioned to developing and teaching several GIS courses. I really enjoyed working with the students and ended up teaching at SUNY Albany for 17 years.

Continue reading

Geography as a Factor in Accessing Educational and Human Services

Focus on SUNY Campuses and NYS Correctional Facilities

In recent years I had a close college friend incarcerated in the New York State prison system and during this time I became interested in rehabilitation and re-entry programs offered to inmates.  Particularly in context of encouraging and helping my friend to focus on a path which would lead him to a better space, a new beginning, and away from the dark past.  My friend Bob (not his real name) actually became a shining example of what is possible in context of educational degrees and technical skills that are offered by the state as part of in-prison and reentry programs.  The intent of both which are to help incarcerated individuals to a successful transition to personal and community life after being released.  Bob became a minister while in prison and then was able to finish up his undergraduate degree and earn a Masters in social work from the City University of New York (CUNY) after his release.  Unfortunately these personal educational accomplishments did not change the trajectory of his life as what ultimately followed after prison were years of living in transitional housing and homeless shelters.  Never really able to rid himself of the many demons within that had haunted him most of his adult life.  Bob died of a heroin overdose four years ago.

Not long after one of my last correspondences with Bob’s family, I came across Mapping the Landscape of Higher Education in New York State Prisons (February 2019) published by the Prisoner Reentry Institute (PRI) at the John Jay College of Criminal Justice in New York City.    It’s a noteworthy report with plenty of content and includes an interesting reference which discusses the availability of educational opportunities for inmates which can depend, in part, on the geographic proximity between the locations of State University of New York (SUNY/CUNY) institutions and the statewide network of correctional facilities as administered by the New York State Department of Corrections and Community Supervision (DOCCS).  While I was able to establish communication with staff at the PRI, I had hoped to establish more in-depth discussions with staff at the two state departments (SUNY and DOCCS) to further build the story of the campus-prison relationship.   It is unfortunate that I did not as there is evidence of mapping products/software in the departments based on graphics in the report which includes a SUNY published interactive online viewer.  These products illustrate the issue of geography as a potential factor in the delivery of educational services to the statewide inmate population.

Current Correctional Facilities Landscape

Per the image below, New York State maintains 52 correctional facilities in seven administrative regions across the state with approximately 46,000 individual under custody and another 35,855 parolees under supervision.

This map is better rendered by downloading the original PDF from DOCCS. Four of the seven administrative regions are in the metro NYC area.

There are now 15 college programs involving over 30 institutions of higher education operating in 25 DOCCS facilities. The report looks into the two systems – higher education and corrections – that are seemingly distinct, yet come together to provide access to college education for incarcerated people. It looks at the challenges, including geography, in meshing these two systems and how both corrections and college staff can work to overcome problems.

Good News Bad News

While the good news is there is generally good geographic proximity between SUNY (including the New York City CUNY system) campuses and statewide correction facilities – particularly in southeastern NYS, there is considerable variation in the operation of college-in-prison programs, including different types of administrative and financial structures, faculty, and pathways to higher education post-incarceration.  A detailed description of educational and academic opportunities for inmates is made available on this DOCCS webpage.   Of the participating colleges, roughly two-thirds are private institutions and one-third belong to the public sector.  Just over half of the maximum and medium security prisons in New York – 25 facilities – host some form of face-to-face college programming. Of the 54 DOCCS facilities, ten out of 16 male maximum security facilities and 12 out of 27 male medium security prisons house college programs. All three of the female prisons – two medium and one maximum – house college programs. The prisons with college education programs are shown in figure below (a clearer version of the map is found on page 27 of the report) and itemized in the following table.

Most of the in-prison college programs are in southeastern New York State with less in the northern and western part of the state. A somewhat clearer version of this image can be downloaded from the report.

Most prisons with college programs are clustered in the Hudson Valley near the New York metropolitan area. The prisons without college programs tend to be further from New York City, likely a function of the fact that incarcerated people in downstate prisons (Bedford Hills and Sing Sing) were leaders in working with community groups and colleges from New York City and its immediate environment, as well as the ability of the colleges and non-profit organizations to generate funding and support for such programs. Moreover, the political environment of these communities was and remains more supportive of college-in-prison programs.

The PRI report (Include report name here) highlights how geography can play towards the delivery of educational services in the statewide correctional system albeit there are many other factors in play.  Matt Bond, staff at PRI, reported that currently only about 3% of the 46,000 individuals incarcerated in Empire State prisons are able to take college classes. Geography certainly presents challenges to offering college classes in prisons, but there are numerous other challenges, including:

  • Difficulty getting materials approved to bring into prisons,
  • The lack of technology (particularly internet access) in prisons,
  • Other demands on students’ time (such as working in order to purchase essential items from the prison commissary),
  • The fact that incarcerated students can be transferred from one facility to another, which interferes with their educational progress,
  • The need for sustained funding to maintain and expand college in prison programs,

This interactive SUNY published viewer shows the locations of both SUNY/CUNY campuses and NYS Correctional facilities. Rather than clicking the Miles from Correctional Facility box (which makes the make very busy at large scales) simply click on a correctional facility to see the distance to the closest SUNY campus.

Even though both of the institutions in this scenario are state governed and administered, each are largely fixed/physically located assets which dictates how much the delivery of educational opportunities can change albeit there are increasingly more options of offering educational programs remotely.  However, technology and internet capacity inside prisons available to inmates continues to be an issue.

But the fact remains today there are thousands of current inmates in the NYS correctional system in 2019 – male and female – who do not have access to the educational opportunities where geography does matter on some level.  The PRI report did not provide a specific overview or comparison on the quantity/quality of educational programs in the 5, 10, 15, and 20 mile buffers around each of the correctional facilities which would have spoke more specifically to the geographic issue.

The Geography Factor in other Human Services

While the PRI report did not make reference to any significant “gaps” in the delivery of educational opportunities to inmates, the “gap” issue is becoming more of an issue (or reference) in context of delivering other important public services across the state.  Such “gaps” are now being referred to as “deserts”.  In New York State, it is not difficult to search for recent references to deserts in the areas of  child care, maternity and mental health care, food deserts, and the struggles of rural hospitals disappearing across the U.S. landscape.  Significant geographic rural areas of the Empire State  are increasingly losing access to essential human services to which the reasons are many.

This image is a subset from the larger statewide map published in the article Mapping America’s Child Care Deserts. According to the report California and New York have the largest percentage of people living in child care deserts.

Geospatial technologies can play a central role in helping solve geography issues associated with growing number of health and human service delivery “deserts”.  Route GIS-based optimization programs based population centers, road networks, geocoding, and other dependencies. Furthermore, identifying potential temporary or “pop-up” service center locations in areas of greatest need which constantly changing over time.  A more mobile service delivery framework which can be leaner and more efficient.  Avoiding the need to higher cost fixed and permanent facilities.

There is much that can be done to advance access to a wide range health and human services including educational options for those incarcerated in New York State correctional facilities.  We are fortunate there is a strong geospatial technology foundation across the Empire State to build out these opportunities.

The Geography of an Adirondack High Peaks Unsupported Thru-Hike Record

Background

Since early July this summer when our youngest son Lukas and close friend Mike Jock completed and established  a new record for an unsupported thru-hike of the 46 Adirondack High Peaks, I’ve been asked by various friends and colleagues across the region (who became aware of the accomplishment) as to whether or not any professional geospatial/GIS technology was used in some capacity in supporting the effort.   Each time my humbling answer has been pretty much the same:  Not Really.  However, they did carry some new gadgetry which is currently used ubiquitously across the adventure and extreme sports landscape to collect data that was used to authenticate their achievement.  But more on that later.

Starting their trek at the trail head to Seward Mountain at 3:30 AM Thursday, June 27th on the west side of the Adirondacks, the two covered the 46 High Peaks in 7 days, 2 hours, and 52 minutes finishing by summitting Mount Esther, on the northern shoulder of Whiteface shortly after 3 AM on July 4th. Ultimately making it down to the Mount Ester trail head at 6:20 AM to complete the trip.   All said, nearly 212 miles and 70,000 feet gained in elevation – more than twice the elevation of Mt. Everest.  They averaged well over a marathon a day, covering some 25-30 miles. On the final day they kept moving for more than 23 hours covering 45 miles.

Michael, left, and Lukas at the summit of Armstrong Mountain with Gothics Mountain in the background. The two were soccer teammates at SUNY Cortland. Mike King photo.

Preparation was more old school than one would think.  Nothing in this space replaces on-the-ground knowledge of the trails, trail junctions, where and when to bushwhack, locations of rock cairns for reference points, as well as planning and hiking/testing certain stretches of the route ahead of time.  Yeah, practice runs.  Luke had the benefit of many years of experience having first started ADK trail hiking since he was barely in kindergarten.  Like many other young children, his first “mountain” being Mt. Jo overlooking Heart Lake adjacent Adirondack Loj.  Safe to assume that through the family ties, his spatial orientation has always been pretty decent. Mike, a local boy, grew up in the Plattsburgh area.

This was their third attempt.   And such accomplishments don’t come without the element of good fortune avoiding injuries (which was the case in 2018) and a bunch of days with generally decent weather.  The 2018 attempt was also impacted due to an encounter with a black bear.  Yet another ADK backcountry hiker lesson in overnight food storage.

Given the enormity, location, and challenges of the effort, it would clearly not be safe, if not irresponsible,  to rely solely on the new generation of lightweight/handheld navigational devices as a means to lead one through the Adirondack Mountain wilderness.  There is no substitute for first-hand knowledge of the trail network and a pre-determined plan.  They carried only the essentials such as lighweight sleeping bags, tents, change of clothing, raingear, first aid/basic emergency gear, water filters,  and food.  Counting every ounce in keeping their backpacks to about 40 pounds.  Even omitting the weight of gas canisters/gas stove and in doing so did not prepare anything hot the entire trip.  Zero assistance.

Cool Gadgets

It’s amazing how far the adventure mapping and video/data collection market has evolved since GoPro technology was introduced nearly a decade ago, if not earlier.  The ability to playback Mike and Luke’s accomplishment – made available below via a series of links – is amazingly made possible by just a one simple mobile (wearable) component.  They used a Garmin Fenix 5 GPS Watch to collect X,Y and elevation data which, based on wireless connectivity, automatically uploads to Garmin Connect.  Upon completion of their hike, the entire trip dataset was downloaded to Relive an outdoor 3D video website which allows further rendering and interactive use of the data.    Two Anker PowerCore 26800 pre-charged power banks kept their phones and Garmin device charged.   Of sufficient size to recharge their phones/devices numerous times over.  They took two but in fact only needed one.   The Garmin app also collects heart rate, estimated calories burned, pace (minutes per mile), elevataion gain/loss, and total daily distance – all of which is made available in interactive and graphic form.  In addition to the default Google basemap, data can be rendered on other base maps including satellite, terrain, OpenStreetMap, and Here.  Amazingly compact, yet powerful tools.

The Daily Numbers

The following section includes a brief narrative – Mike’s own words- and links which can be used to highlight trail and body metrics as well as mapping visuals for each hiking day.  For those familiar with hiking and trekking in the Adirondacks, the visuals certainly help put Luke and Mike’s daily segments in better perspective.

Hold on to your seats.

Thursday June 27

Hiker Notes: 3:30 am depart from Corey’s Road.   Day consisted of seven mountains: Seward, Donaldson, Emmons, Seymour, Santanoni, Panther & Couchsachraga. Out and backed the first four.  Trekked approximately 10 miles to Santanoni range.  Set up camp at the base, then we went up the expressway to summit Santanoni first, followed by Panther, and then finished with Couchsachraga. We came down the Panther brook trail before staying at camp at base of expressway again. Approximately 37.84 miles.

Instructions for all similar images below: Click on map for additional graphics and daily metrics. Or click the black triangle button at the bottom of the screen to see hiker movement over the course of the day.

Instructions for all similar Relive 3D Interactive links below: Click on the icon circled in red to see daily hiker movement on top of a 3D base map and associated photos. Clicking on the “View Interactive Route” button enables the ability to interact with the map and trail data “twirling” the image to see from the north, east, south, and west perspective.

Friday June 28

Hiker Notes: From camp, hiked over to Allen mountain, out and backed it before moving up towards Colden/Avalanche Lakes. We out and backed Mount Marshall before setting up camp over the dam at Lake Colden. We summited two mountains and covered approximately 28.47 miles.

June 28thRelive 3D Interactive

Saturday June 29

Hiker Notes: The ADK Loj Loop day. Summitting eight mountains and doing a big circle before returning to the same place we camped the night before. We started by going up the backside of Colden, then Tabletop, Phelps, Street, Nye, Wright, Algonquin and finishing on Iroquis. Approximately 32.18 miles

Note: The only day “noise” was either user generated or introduced by the Garmin device itself. In the vicinity of Street and Nye – Illustrated by the “straight” additional red line. Also reflected in the Relive 3D viewer.

June 29thRelive 3D Interactive

Sunday June 30

Hiker Notes:   Audible day. Started by moving to the base of Cliff and Redfield (out and bacs), then trekking up towards Gray, Skylight, Marcy, Haystack, Basin and finishing with Saddleback. Due to it raining all day, made the game time decision to check out and head towards Johns Brook Lodge where we camped at the trailhead of Big Slide Mountain (setting ourselves up the next day to finish the Great Range and start moving east). Summitted eight mountains and covered approximately 22.5 miles.

June 30th:  Relive 3D Interactive

Monday July 1

Hiker Notes:  Out and backed Big Slide early in the AM, before climbing up towards Great Range. First we summited Lower Wolf Jaw, then Upper Wolf Jaw, Armstrong, Gothics and Sawteeth. We then headed down trail to Lower Ausable Lake. Next we did Colvin and Blake before camping between those two mountains.   In total we summited eight peaks again and covered 23.97 miles.

July 1st:  Relive 3D Interactive

Tuesday July 2

Hiker Notes: Started by ascending Nippletop, moved on over to Dial, then bushwhacked down towards the Dix Range. Once we got down from bushwhack/brook we dropped bags and then out and backed the entire Dix Range: Dix, Hough, South Dix, Grace Peak & Macomb. From there we got our bags again and then moved our stuff over to Roaring Brook and the base of Giant Mountain. In total we covered 25.26 miles and summitted seven peaks.

July 2nd:  Relive 3D Interactive

 Wednesday July 3

Hiker Notes:  The 24 hour day. Woke up at 3 am and went to get Giant and Rocky Ridge Peak (out and backs). From there we picked up our stuff again and schlepped ourselves 5.5 miles down route 73 toward Marcy airfield. Next up was cutting from one side of 73 to the Lake Placid side of 73 along the ridge trail that summitted Porter and Cascade Mountains. Off of those we had then a 10 mile stretch on route 73 and then River Road towards the trai lhead to Whiteface mountain. Using the trail by Connery pond we entered that portion at 1030 PM and was able to summit both Whiteface and then Esther by 3:15 am. About 23 hour and 30 minutes of moving time we summitted our final 6 peaks and covered 44.18 miles. Passed out for an hour and reached Memorial Highway by 06:22 AM, where a time-stamped photo was taken.

July 3nd:  Relive 3D Interactive (Part 1)  Incredible day!!

July 4th:  Relive 3D Interactive (Part 2)

Summary

Quite an effort  and on top of setting the record, between this trip and last year’s attempt, the two helped raise nearly $18,000 for the Dubin Breast Center at Mount Sinai Hospital in New York.  Their accomplishment was covered by Backpacker Magazine as well as a selected number of upstate New York online publications (UpstateNewYork and NNY360) among others.  The articles are generally similar in content though do offer more details about food and other daily nuances/items which I omitted here.  Choosing rather to highlight and focus on the immense geographic element of the effort.

Both Luke and Mike are personal trainers living and working out of New York City.  More information can be found on their website Team Adventure Portal.

BuildingFootprintUSA: Setting the Foundation in Albany

Somewhat fitting a new geospatial start-up would emerge in the Albany area.   The region being home to MapInfo, an early player in the desktop GIS software market appearing at number 23 in Inc. Magazine’s annual list of the 500 fastest-growing private companies in the U.S. in 1992.   While the software product is still around, the company has since been acquired by Pitney Bowes.  Across the Empire State geospatial landscape it’s not uncommon to bump into someone working in the GIS space with ties to MapInfo.

Case in point, in 2016 four ex-MapInfo colleagues, each with over 25-years of experience in the geospatial space focusing largely on data development, went out on their own and launched BuildingFootprintUSA with the intent of providing to the geospatial industry spatially accurate and attribute rich building footprints covering the United States.  Their initial focus has to been to provide data to the location based advertising, insurance, and telecommunications industries.  In January of this year, Geoawesomeness included BuildingfootprintsUSA (BFUSA) in the 2019 Top 100 Geospatial Companies and Startups List.

BuildingFootprintUSA’s 3D model of Albany including the Empire State Plaza. Buildings are commonly attributed with addresses and assessment data.

Given that the company is only three years old and has only a handful of full-time employees, BFUSA might be considered a typical tech start-up.  However, co-owner Scott Robinson notes that the company is in the midst of significant growth with a growing list of clients nationwide.  The company is an ESRI Emerging Business Partner and is part of the START-UP NY Program in a partnership with SUNY Albany.

The fast-growing company’s catalog already includes over 90 million footprints covering 75% of the US population, several large clients and to date has not required any external funding.  Using an addressed building footprint as the foundation of their product line, BFUSA routinely connects a wide range of attribute data to the footprint including, but not limited to, census designations and demographics, assessment files, property and facility information, and business characteristics such as category and size of company.  For residential structures, detailed demographics (i.e. age, race, income, education, etc) and household profiles on consumer behavior and lifestyles are also available.  Structure height (z-value) is also included in the footprint dataset which is derived from available LIDAR databases as well generated from their own photogrammetry or other BFUSA business partners.

We are committed to data integrity”, notes co-owner Scott Robinson, “our work is essentially a  huge data curation effort – blending and harmonizing data from many different sources including open data portals, government websites, and commercial data services”.   Specific and very detailed attention is given to the spatial/positional accuracy of the footprint as well as the numerous data fields associated with the footprint.  Robinson points out that not all building footprints are created alike noting that many “single” footprints can be comprised of several offices or living spaces such commercial buildings and/or condominiums and apartment buildings.  Similarly the same footprint can have different heights (z-value) which factors into line-of-sight analyses and wireless signal studies.  He continues “It’s not uncommon to find at least 25% of the building footprints we receive from others to be off at least 100 feet”.

Specific examples of how BuildingFootprintUSA products and services are used include:

Insurance

In assessing structural risks in designated flood plains, using building footprints versus parcel centroids provides a more informed evaluation. In this example, dots represent parcel centroids. In some instances where parcel centroids are located in the flood plain, associated parcel structures may/may not be (orange and yellow) vulnerable to flooding. Both a red dot and red footprint indicate a more vulnerable property while both a green dot and green footprint imply major property assets are not subject to flooding.

Telecom

A Telco company uses BuildingFootprintUSA data to understand optimal placement of 5G network towers in NYC; based identifying what buildings the signal can reach and what are the characteristics of the building itself. In this picture residential buildings are shaded by affluence of the residents.

Location Based Advertising (AdTech)

Detailed business data attributed to building footprints can then be integrated with consumer movement data generated by mobile devices. Buffers around specific buildings can support a variety of pattern analyses which provides a very educated guess on where a mobile device has been over a period of time. Using both store visit insights and foot-traffic data, building footprint data empowers retail analytics firms and real estate asset managers to conduct live trade area analysis and give retailers insights on the characteristics of these people, and know the reasons that are drawing people to those locations.

BuildingFootprintUSA data products are currently available via ESRI Shapefiles and geodatabase (GDB) and MapInfo TAB in Coordinate System WGS84.  Later in 2019 the company plans to offer data via an API. Datasets are typically sold as nationwide coverages though smaller geographic footprint are available as well.  Data is offered by annual license with quarterly updates.

Summary

Refreshing to see a geospatial start-up emerge in Albany only minutes from the Empire State Plaza.  With the UAV technology well recognized and established from Syracuse into the Mohawk Valley Region, we can be optimistic that BuildingFootprintUSA’s success – and perhaps by extension its association with START-UP NY – will be recognized and brought to the attention of the state’s elected officials.  Highlighting both the company’s contribution to the local and state economy and illustrate how geospatial marketplace commodities are routinely produced and made available by industry.

Perhaps a start to similar industry growth in the greater Albany and Hudson River Valley region.

Contact:

Scott Robinson, VP Strategy
scott@buildingfootprintusa.com
BuildingFootprintUSA
200 Great Oaks Blvd, Suite 214
Albany, NY 12203
518-218-4444

2019 Westchester GIS User Group Meeting

Making it the largest annual event to date, nearly 200 individuals attended the 2019 Westchester GIS User Group Meeting May 16th at Purchase College. The annual event included a diverse mixture of user presentations and demonstrations for attendees representing local and county government, utilities, nonprofits,  business and industry, and academia (both college and high school programs). Faculty and facility support from the College’s Environmental Studies program and sponsorship from twelve vendors again helped enable the Westchester County GIS community to meet and discuss the countywide geospatial agenda.  And by virtue of the venue, promoting SUNY GIS educational opportunities as well.   It was a great GIS day for all attending and participating.

As the day progressed, nearly 200 registrants assembled as part of the 2019 Westchester GIS User Group Meeting at Purchase College. The main lecture auditorium was filled to capacity with standing room only by mid-morning.

2019 Agenda and Speakers

While the 2018 agenda had a specific theme, this year’s agenda was intended to be more diverse covering a wide range of topics including health and human services, pavement management systems, oblique imagery applications, training workshops, forestry inventories, public safety, mapping and visualizing the human brain, the 2020 Census, and a special presentation by ESRI focusing on accessing the County’s new planimetric datasets via web services.

Session I:  Allison McSpedon and Jeff Worden from the Westchester County Continuum of Care Partnership for the Homeless led the day off with a presentation focusing on the use of mobile technology as part of the annual Homeless Point in Time (PIT) Count taken in January 2019.  This was followed by Nancy Birnbaum, Manager of Software Architecture, Westchester County Dept. of Information Technology who presented the new Westchester County Online Community Mental Health Directory.

Managers from the Continuum of Care Partnership for the Homeless detailed the pros and cons on the use of mobile data collection technology as part of the January 2019 count. They anticipate even better results and ease of use when deployed in the next count.

Andrew Reinmann, Advanced Science Research Center, Graduate Center of CUNY and Department of Geography, Hunter College followed with the use of geospatial tools as part of the Westchester County Forestry Inventory: Mapping and Ecosystem Services Assessment.  The morning session ended with a series of lightning talks highlighting the use of the County’s new oblique imagery.

Session II: After intermission, VHB and staff from Westchester County Dept. of Public Works and Transportation discussed the new Smart Asset Management and Inventory System (SAMIS) application which was followed by an excellent demonstration on the use of Laser Scanning technology by the Westchester County Police Forensic Investigations Unit.  Patrick Gahagan, Technical Analyst at ESRI finished the morning session discussing advancements in civil engineering and surveying integration between the Autodesk and ESRI platforms.

Detectives from the County Police Forensic Unit captivated the audience on the use of laser scanning in crime scene investigations. GIS staff is now working with the Forensic Unit on integrating laser scanning data into the enterprise GIS environment.

Session III:  After lunch – and an audience participation session of GeoJeopardy – Jonathan A. N. Fisher, Ph.D., Director of the nearby Neurosensory Engineering Lab at the  New York Medical College in Valhalla provided an overview of his project called Neurodome which centers on the mapping of the human brain with an assortment of technology and visualization tools.   Daniel Wickens, Solution Engineer from ESRI then gave two overviews on “What’s New with ArcGIS Field Apps and ArcGIS Online.”  Concurrently in separate locations training classes were offered on how to use the new online CONNECTExplorer oblique imagery viewer and the ESRI “Explore Future Climate Change” tutorial.

Session IV:  The last section of the agenda was brief and included an update on mapping efforts association with the 2020 Census by Margaret Baker, Geographer, from the U.S. Census Bureau Manhattan office.  The final presentation by Westchester County GIS staff included the latest developments and anticipated upgrades to the Westchester County GIS website including the scheduled launch of the Westchester GIS Geospatial Gateway

Individual meeting presentations can be accessed and downloaded using this link.

The U.S. Census Bureau is ramping up for the 2020 Census and has a variety of mapping and geospatial products in their toolbox. GIS technology is essential in helping identify areas which have had low counts and responses.

Little Things Make it Work

I’ve written before about the small details which we believe enable the Annual Westchester GIS User Group Meeting to continue to be successful – and we’re the first to admit there is always the element of luck.  Even the weather matters.  To the extent possible, elements such as keeping the content and speakers “Westchester” focused, minimal –  if any –  registration fees, lots of time for interaction with the sponsors on the exhibit floor, and the centrally located venue at Purchase College – all matter. One of the ironies, and downsides, of having the show on a college campus in mid-to-late May is that spring semester is already over and students have fled campus.  However,  there is normally a handful attending looking for summer or full-time work and passing out resumes.    The naturally lighted vendor area in the Natural Sciences Building, albeit small, adds to the personal “feel” of the show.    Easy access and plenty of parking is also essential.  And don’t forget lots of proactive outreach to the professional organizations and societies  we work with on a day-to-day basis:  police/fire, engineering, surveying, public works, assessors, nonprofits, and the planning community.   The added message here is to encourage consultants which are supporting local governments across the county – to attend the meeting.  To learn more about accessing and leveraging Westchester County GIS products and services and how this improves service and cost efficiencies to municipalities they serve.   Individually, any of these items listed above may seem trivial,  but they all add up in delivering a show that will bring the same people back next year.

The exhibit floor was busy (and loud!) during breaks with all vendors noting interaction with attendees was good and productive. All attendees can complete a Vendor Bingo Card and be eligible for a raffle prize at the end of the day. This year’s prize was a vendor donated iPad!

Summary

Over the next couple weeks, conference organizers will be sending out a survey to both attendees and vendors to gather more detailed information on the various elements (presentations, speakers, refreshments/breaks, vendor interaction/feedback, facility issues and the like) of the show.  This information will help guide decisions about content and any changes that may need to be made, if any, about the structure of the show.

Staff will take a few months off and begin planning for the 2020 show in the fall of this year.  In doing so, we look forward to the continued relevance and position of the Westchester GIS User Group Meeting in promoting countywide geospatial development and use.