
Established by Nancy S. Jones, JD Godchaux, and Lela Prashad in 2007, NiJeL is a company founded on the goal of helping organizations and communities building interactive dashboards, infographics and maps, building strong advocacy tools, and to connect with their communities and sponsors. Ms. Prashad (CEO) currently leads NiJeL, while Mr. Godchaux (CTO) serves as the primary interactive developer, and Ms. Jones provides management oversight and strategic direction. NiJeL began after the three had volunteered as American Friends for the International Rescue Committee (IRC) in Phoenix, Arizona while attending Arizona State University as graduate students.
After the successful launch of one of their early online mapping applications in support of Duet – a metro-Phoenix nonprofit dedicated to supporting and improving the quality of life for senior citizens – NiJeL relocated main staff in 2011 to Brooklyn, and since then have been engaged in a number of Empire State oriented geospatial projects.
NiJeL uses standard statistical, mapping, and database software, and develop custom open applications for websites, mobile devices, and desktop computing. “What makes us different from other groups like us in this space is our custom process to assess current data, metrics, and technology workflows with regards to the organization’s culture and specific goals” notes JD Godchaux . NiJeL works with a wide variety of organizations and their focus on using open-source components allows the firm to be flexible in how projects are approached and ultimately designed. Their commitment to open-source tools allows to provide training for technical staff to manage and make changes to the technology solution they deliver to the client. Illustrative projects include:
United Nations
Some of their earliest New York-based projects were internal projects with the United Nations Population Fund (UNFPA) though one public facing application includes POPClimate which is a Q&A site for population statisticians related to research on uses of climate change adaptation and mitigation.
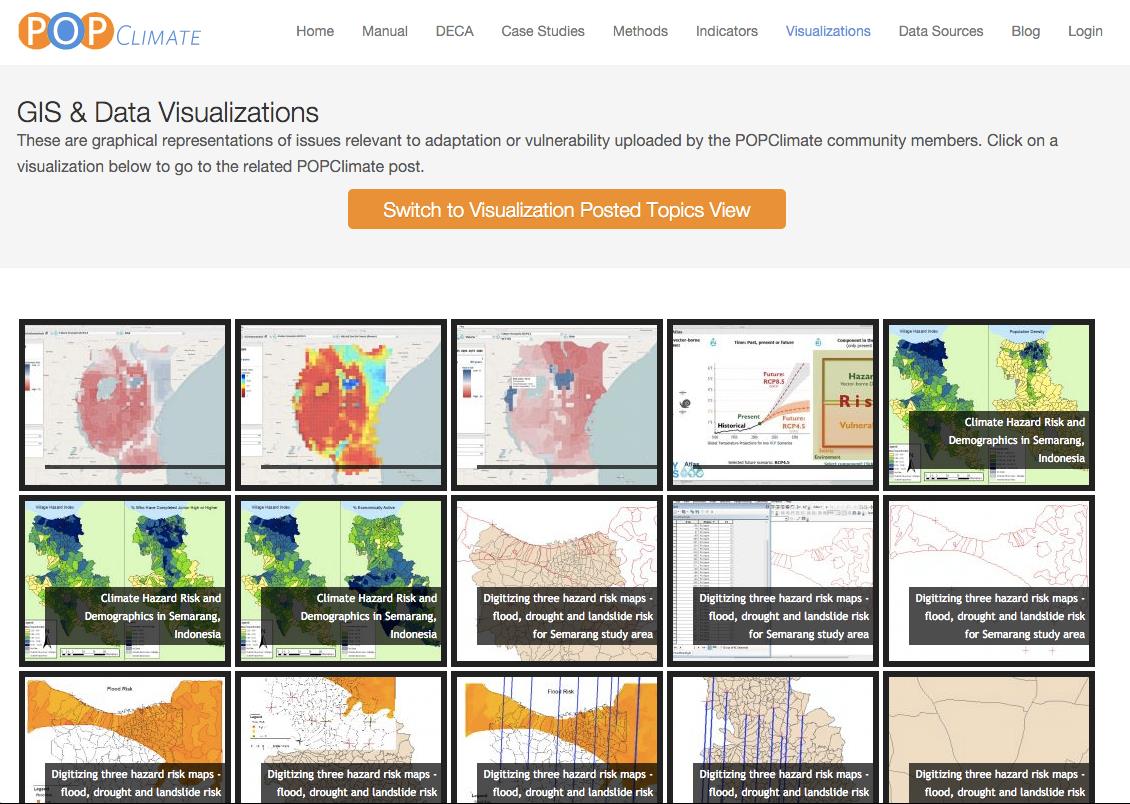
POPClimate is the United Nations Population Fund’s (UNFPA) population dynamics and climate change adaptation online platform. Researchers, practitioners, and the public can connect to each other through this platform and contribute to a body of knowledge on best practices for adaptation.
Riverkeeper
In 2013, NiJeL partnered with mWater, a leader in global mobile technology for water monitoring, to develop integrated, interactive public dashboards and maps for Riverkeeper, an organization dedicated “to protecting the environmental, recreational and commercial integrity of the Hudson River and its tributaries, and safeguard the drinking water of nine million New York City and Hudson Valley residents.” NiJeL produced a series of dynamic maps, tables, and charts highlighting water quality and its relationship to rainfall along the Hudson River and its tributaries.
The Riverkeeper team samples the Hudson River for enterococcus, a marker for fecal contamination, and other water chemistry variables, like pH and salinity. The NiJeL application uploads data for display in maps and tables highlighting recent enterococcus values for designated sampling locations along the river. Visitors can see trends over time for all sites and get more detailed data and information on any specific location. The application highlights unsafe sampling values in red.
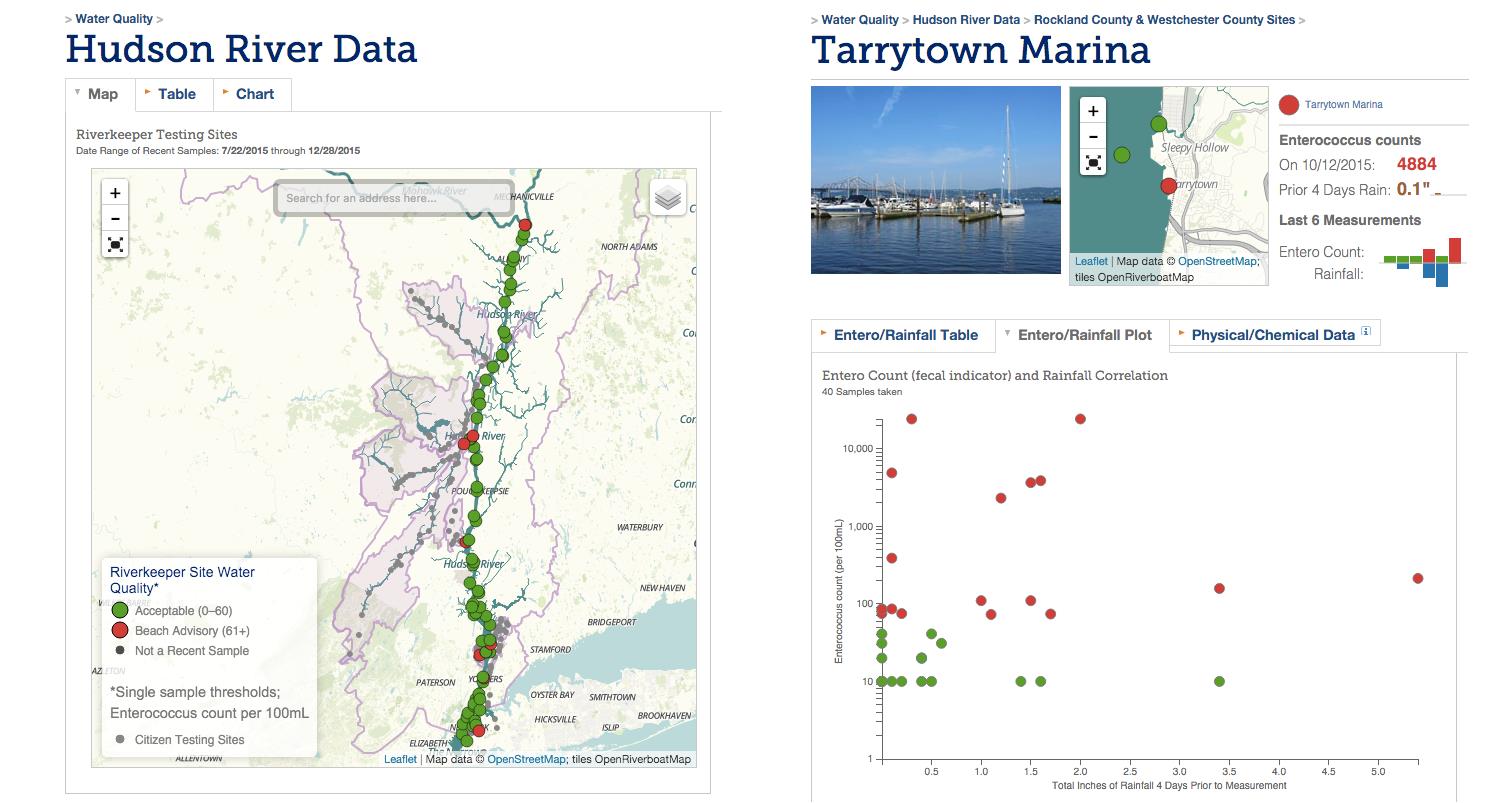
Left: Riverkeeper’s water quality data visualized across the Hudson River. Visitors see results from the most recent sample at each site, and can filter these data by choosing a time interval. Right: The page showing all data for Tarrytown Marinia with a map, a dashboard-style monitoring visualization (upper-right) showing the enterococcus count for the last measurement and last six measurements of pollution counts and rainfall, and a scatter plot of all samples from shown the enterococcus count and its relationship to rainfall.
Long Island Sound
Towards the same goal as their work with Riverkeeper, NiJeL also partnered with Connecticut Fund for the Environment and Save the Sound to build the Sound Health Explorer, which frames the historical water quality context for Long Island Sound’s 200+ beaches. The first phase included the gathering of over 10 years of EPA, state, and local data on water quality measurements focusing on the concentration and measurements of enterococcus during the swimming season (May – October). Work also included the gathering of tens of thousands of daily precipitation observations from nearby weather stations with the intent of showing the relationship of specific beaches suffering more from bacterial contamination during and/or immediately following wet weather than in dry weather. Wet weather contamination is typically associated with fecal pollution delivered by contaminated stormwater, a local tributary, and/or overflowing sanitary systems in the immediate area (i.e. failing septic systems and cesspools or leaking sewer lines).
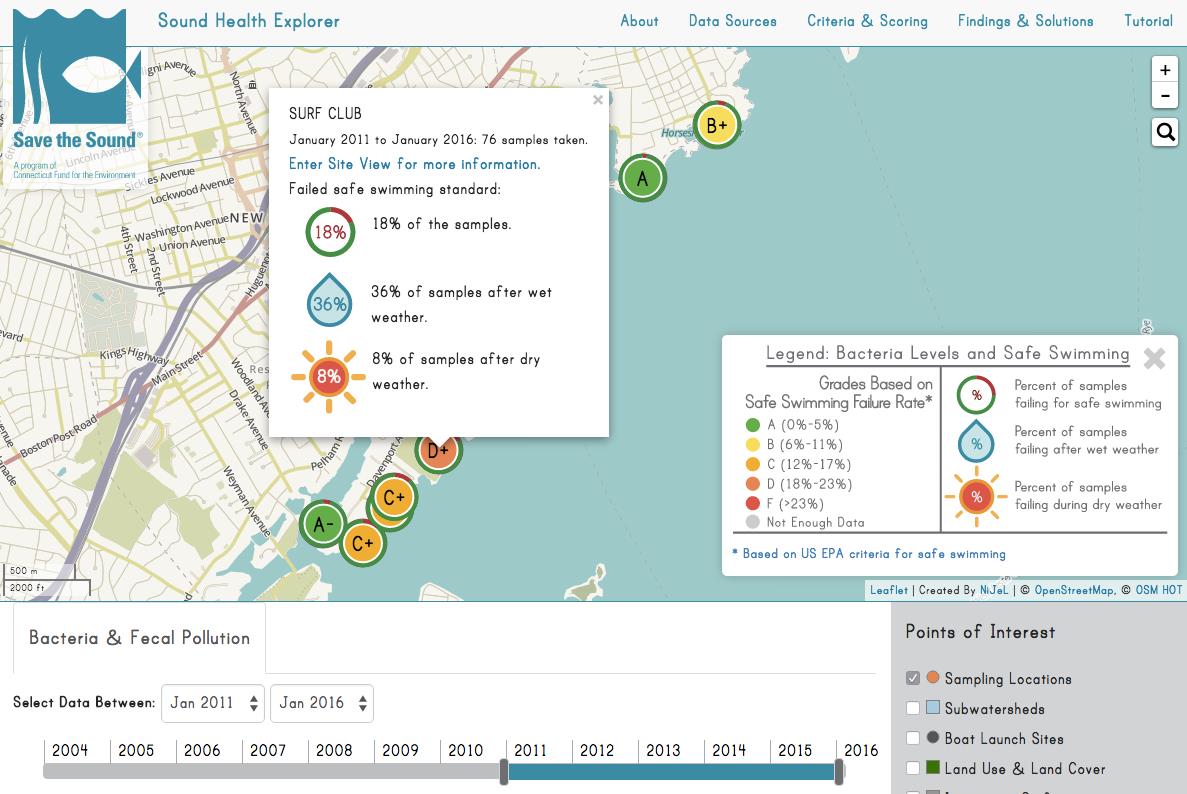
The Sound Health Explorer main landing page, zoomed in on Long Island Sound beaches in southern Westchester county. This view also shows the popup open for the Surf Club, showing a particularly strong relationship between rainfall and levels of enterococcus at the beach.
NiJeL employed a letter grade scoring system developed by Save the Sound and their science partners to provide a visual indication of how frequently beaches fail to meet the EPA mandated criteria for safe swimming. While the grade represents the overall view of a beach in wet and dry weather, one can see the failure rates for both wet and dry samples. NiJel also added other datasets such as impervious surfaces, land use and land cover, and watersheds that provide additional text for these scores.
Summary
Other ongoing NiJeL efforts include work with with DNAinfo, the hyper-local neighborhood new site of record for New York City and Chicago. With DNAinfo, NiJeL has built tools for New Yorkers and Chicagoans to draw where they think their neighborhoods are, understand their neighborhoods with demographic data, and track ongoing problems with crime. NiJeL is also working with the Global Architectural History Teaching Collaborative on a system for distributing and visualizing architectural survey course materials. They are also working with the NYU’s College of Global Public Health to create dashboards and infographics to visualize data from various studies on the public health at a neighborhood level.
Though to date, rarely seen within the traditional GIS circles across the state, NiJeL is nonetheless uniquely qualified and positioned to provide traditional GIS consulting support to clients. They also represent an expanding – and refreshing – effort among the new/next generation of geospatial consulting firms to extend conventional geographic data and geospatial “products” into the data visualization and infographics space. Many of the projects itemized on their homepage highlight and showcase this crossover. If you have time, it’s worth a few minutes to see the range of products and services they provide.
NiJeL is scheduled to present at the 2016 Westchester GIS User Group Meeting on May 12th at Purchase College and will provide a venue for the firm to share their business offerings to a larger audience. Upcoming information on the meeting can be found on the Westchester County GIS website.