I’ve recently been communicating with Ebrahim Afshinnekoo who is Project Director for the PathoMap project based at the Weill Cornell Medicine Mason Laboratory in New York City. Launched in the summer 2013, PathoMap was the first project of its kind, with the intent to comprehensively map and investigate the presence of bacteria and DNA on the surfaces of large urban, metropolitan environments such as New York City. And of course what better venue to collect bacteria samples in NYC than the subway system – the large subterranean behemoth home to 5.5 million riders on an average weekday.
I was drawn to the project in that it involves several common geospatial components the traditional GIS community is routinely involved with such as data collection/data validation, data analysis, mobile apps, web mapping and visualization. To date, discussion on this geospatial research effort has focused mainly within the Cell Systems (scholarly journal) community, though with little exposure within the traditional NYS GIS community. While both the Wall Street Journal and the New York Times published articles on PathoMap in 2015 we’ve seen little work of this nature at statewide conferences or how it can promote similar geospatial analysis across the Empire State. With this in mind, eSpatiallyNewYork initiated this blog entry with the purpose of exposing the PathoMap project, and its subsequent global expansion (MetaSUB) to the larger statewide GIS community.
Data Collection
The molecular profiling initiative launched in the summer of 2013 with the help of undergraduates from Cornell University and Macaulay Honors College – which were soon to be given the appropriate moniker “Swab Squad”. To create a city-wide profile, the research team first built an Android/iOS mobile application in collaboration with GIS Cloud to enable real-time entry and loading of sample metadata directly into a database (Figure 1).
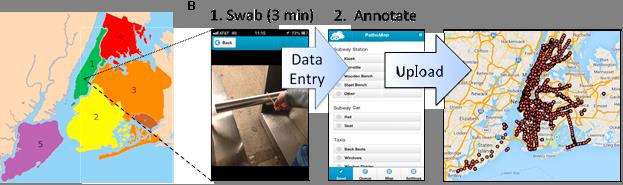
Figure 1: Data collection from the project included the “swabbing” of sites and subsequent analysis and data entry of the findings into a mobile app which are dynamically uploaded to the Cloud GIS database. Source: Afshinnekoo et al., 2015
Each sample was geo-tagged with longitude and latitude coordinates via global positioning system (GPS), time-stamped, and photo-documented, and collection fields were completed for data entry and included the swabbing time, the scientist performing the collection, and collection notes (Figure 2). This protocol enabled a built-in sample confirmation, wherein the research team could confirm that the sample ID of the swab in the laboratory matched the ID in the photo taken during the collection.
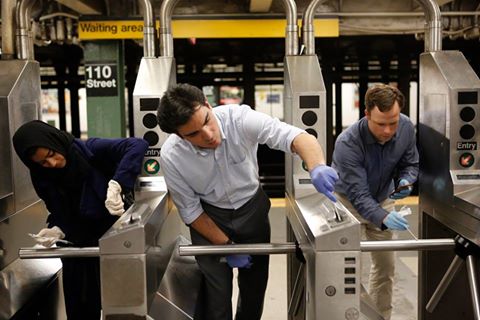
Figure 2: Data collection on turnstiles at the 110th Street and Broadway subway station, Manhattan
Field workers collected 1,457 samples across NYC during the summer of 2013 which continues to be replicated to the extent possible each season every year. Sampling includes data from all open subway stations (468) for all 24 subway lines of the NYC Metropolitan Transit Authority (MTA), the Staten Island Railway, 12 sites in the Gowanus Canal, four public parks, and one closed subway station that was submerged during the 2012 Hurricane Sandy. At subway and railway stations, samples were collected in triplicate with one sample taken inside a train at the station and two samples from the station itself, with a serial rotation between the kiosks, benches, turnstiles, garbage cans, and railings.
Data Collection Results
Samples collected across all surfaces in the city can be browsed on the PathoMap viewer (built with Leaflet) and in supplemental files. Results from the initial 2013 data collection effort found that nearly half of the samples (48.3%) did not match to any known organism, underscoring the vast wealth of unknown species that are ubiquitous in urban areas. Bacteria identified were also enriched to the most commonly associated body part (Figure 3) – especially skin.
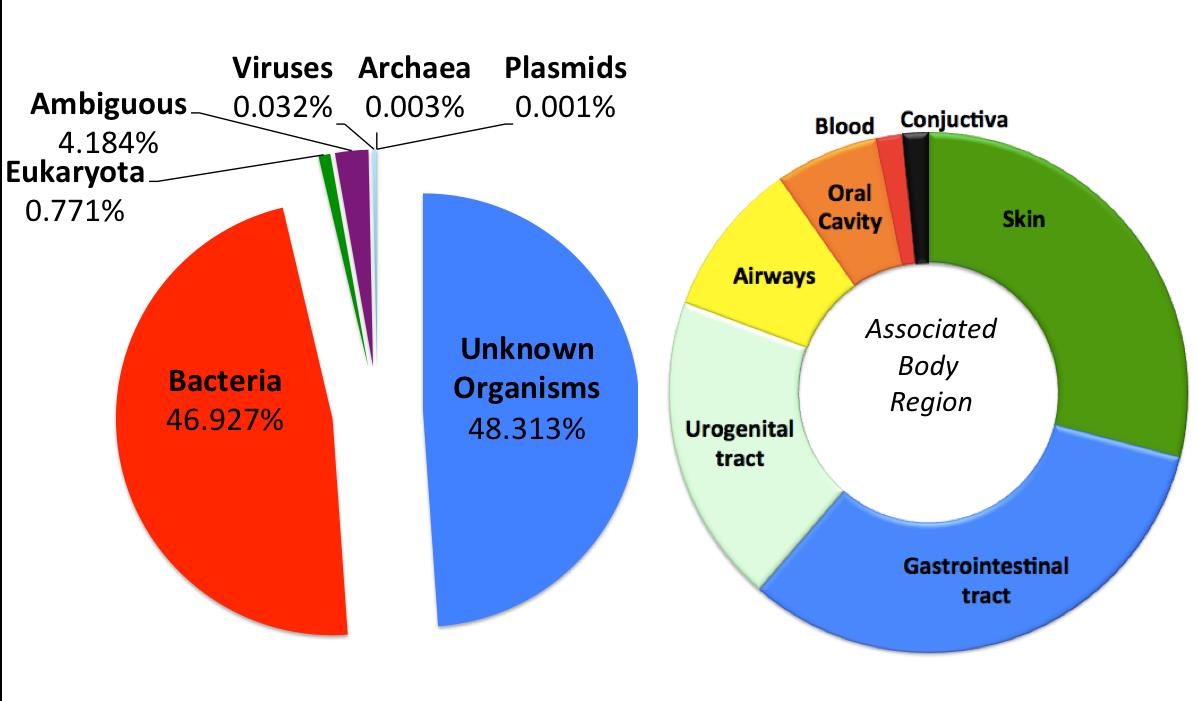
Figure 3: Nearly half of the samples collected did not match any known organism. Of the 67 human-related bacteria identified, occurrences were greatest for the GI-tract (blue), skin (green), and urogenital tract (white). The entire circle represents 100% of the 67 species, and the sizes of each color represent the proportion of each type of bacteria. Source: Afshinnekoo et al., 2015
Other notable findings include:
- Almost half of all DNA present on the subway’s surfaces match no known organism
- Hundreds of species of bacteria are in the subway though mostly harmless. More riders bring more diversity.
- One station flooded during Hurricane Sandy still resembles a marine environment
- Human DNA samples on surfaces can mirror US Census data of the neighborhoods the subway station is in.
- A lot of food-related bacteria including: pizza, cheese, humus, sauerkraut, and more!
From PathoMap to MetaSUB
In the summer 2015 Afshinnekoo and Mason expanded the PathoMap project through the founding of the International MetaSUB Consortium. The consortium consists of over 70 cities across the world that seeks to establish a world-wide “DNA map” of microbiomes in mass transit systems and urban biomes.
NYC is not the only city in the world that might benefit from a metagenomic profile of its subway and transportation systems. Although NYC subway has the most stations, it ranks 7th in the world in term of the number of riders per year. A wide variety of population density, length, and climate types define the busiest subways of the world, ranging from cold (Moscow) to temperate (New York City, Paris), to sub-tropical (Mexico City) and tropical (São Paulo).
Currently dozens of cities in North and South America, Europe, and Asia are involved in the project having participated in a global City Sampling Day on June 21, 2016 of which ongoing and updated results can be seen on the MetaSUB data map. A comprehensive list of researchers and cities worldwide involved in effort can be referenced on the MetaSUB website.
Summary
“We are at the cusp of a revolution with the advancements of sequencing technology, we are now able to explore the world around us at a molecular level like never before” says Mason. According to Afshinnekoo, “At the beginning, we were trying to create a baseline of the microbiome of these surfaces, now that we’ve begun to do that we can take the next step towards the applications of these data, both in the development of ‘smarter’ cities as well as the implications these microorganisms can have on our health.
Discussions are currently underway to have PathoMap staff present at the Spring 2017 Westchester GIS User Group Meeting at Purchase College.
For questions or information associated with the PathoMap or MetaSUB projects, contact Ebrahim Afshinnekoo at eba2001@med.cornell.edu and Christopher Mason at chm2042@med.cornell.edu