In January of this year, I published my first 2017 GeoCon wish list relative to geospatial mapping applications and topics I’d like to see as part of the Lake Placid October 17-19 conference. Since January, writing and publishing eSpatiallyNewYork has enabled me to communicate with a wide range of individuals and organizations involved in geospatial programs across the state – some of which are included in the list below. Others itemized on the list are new business start-ups, government and nonprofit initiatives, and programs involved in the emerging drone technology.
So without any further adieu, here is Part II itemizing geospatial topics and program areas I’m advocating for 2017 GeoCon in Lake Placid. Speakers, presentations, and ideas to mix things up and start some new discussion – and why.
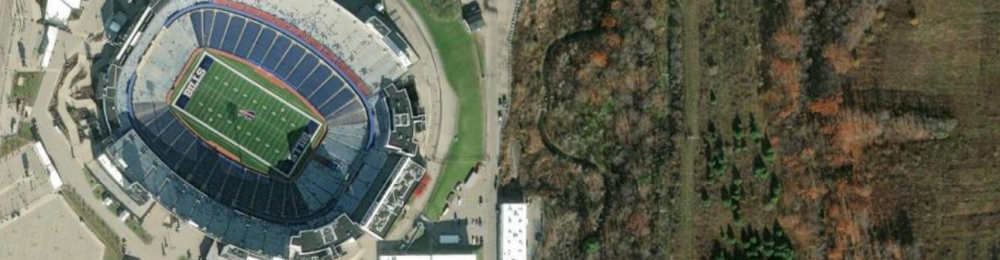
With the opioid crisis well documented in New York State, Story Mapping and data visualization help further detail the magnitude of this public health issue to a much wider audience. Story Maps also enable authors with much greater flexibility in developing a narrative to accompany the data which might be otherwise be difficult to interpret or understand with just a map by itself. Here in New York, it’s the hope to see greater use of Story Mapping (not just ESRI’s solution – all platforms) by agencies and organizations which historically have been reluctant to publish maps due to concerns of data which might be sensitive or misinterpreted. This Opioid Story Map provides a powerful message and can prove to be a catalyst in seeing other statewide public health data being published in a similar geographic format. It would be interesting to hear more from this Story Map author(s) about the datasets used (availability, sensitive/non-sensitive, sources, etc.) and possible collaboration with other GIS programs and agencies at the federal, state, and local level. See also the Northern Kentucky Story Map: The GEOStory of Opioid Addiction and The Urban Observatory: The Opioid Epidemic.
Story Maps provide an easy and powerful framework to combine narrative and maps which is often very helpful when publishing sensitive or “difficult” to interpret data. Publishing agencies have can better help how data is interpreted and read.
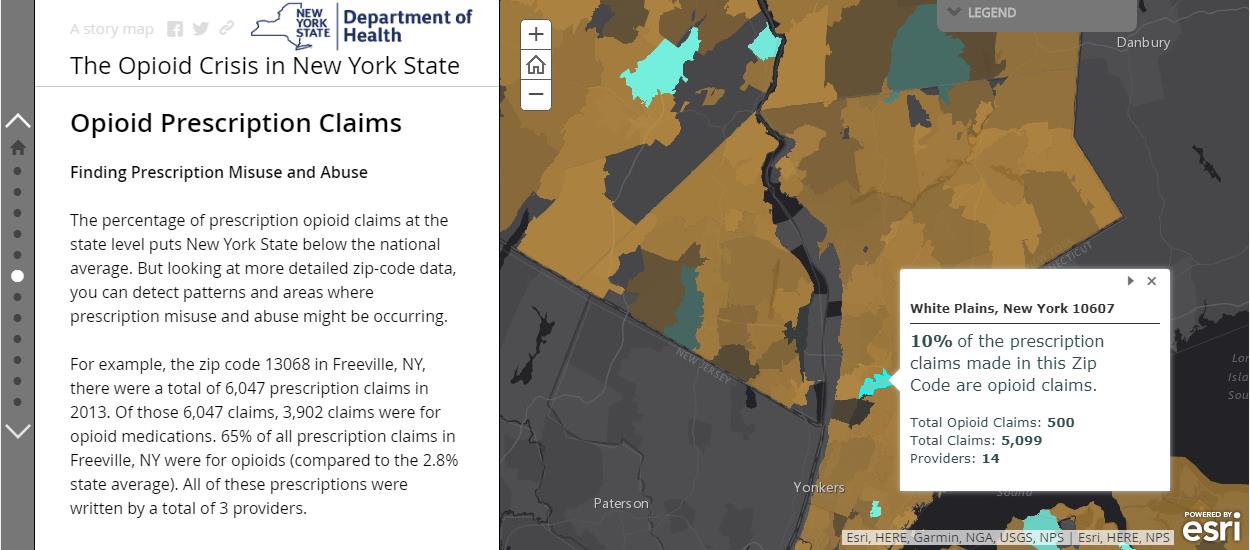
New York State Wildland Fire Mapping
Nothing special or cutting edge here geospatial, but I’ve always had a soft spot for wildland fire maps having served on U.S. Forest Service interregional fire crews back in the day in both Idaho and Montana. Though in context of publishing fire data, it’s unfortunate how little capacity New York State Department of Environmental Conservation (DEC) has built in context of publishing their data and products as services. Not that statewide wildland fire data and map services would be a top seller for DEC, but the image below (scrapped from the DEC website) speaks to the continued reliance on static maps and other enterprise map applications which cannot be consumed by other viewers. The map is actually interesting in showing how there are more fires per square mile closer to urban areas (red) than in the more forested areas such as the Adirondacks – where most would think wildland fires occur and with more frequency. Publishing this type of data as some type of map service would
enable users to mash-up wildland fire data with aerial photography, land use data, emergency services asset datasets, tax parcels, and other local information. Not looking for anything like the data and programs coming out of the National Interagency Fire Center in Boise, but it would be interesting to see and hear what kind of maps and geospatial tools are being made/used by DEC GIS staff to support decision making on or near active fires lines and in fire camp.
Status of New York State Wildland Fires and Fire Danger Maps are posted daily based on input and collaboration with several NYS agencies.
GISP vs. GEOINT vs. ESRI Technical Certification
My sense is that the Geographic Information Systems Professional (GISP) certification ship has left the Port of New York and is not coming back. Yup, GISP sway is long gone. Admittedly, this belief is really more of a feel opposed to any hard facts or statistics, though if I got my hands on the meaningless annual URISA survey on GISP certification and could filter out the responses from New York State, my bet says the metrics would probably be pretty revealing in context of how much (or really, how little) GISP has meant (i.e., increased salary, professional development/advancement, improved employment opportunities, etc) to the GIS community across the state over the last decade. I don’t see GISP being added to the New York State Education Department’s Licensed Professions registry anytime soon. With that in mind, a new certification program available is through the United States Geospatial Intelligence Foundation (USGIF) GEOINT Certification Program is now available. This looks interesting and promising for New York State GIS practitioners given the growing and uber presence of the upstate Unmanned Aerial Systems (UAS) industry and its close ties to the defense and intelligence community. If I was 5-10 years into my career I might give this one a look. And while there might be others, certification candidate number three is the ESRI Technical Certification program which covers several certifications in desktop, developer, web, and enterprise systems. Probably considered more “IT” than the other two certificates, this certificate option would add to the resume and vitae of any Empire State GIS professional pursuing to mix a career in GIS and information technologies.
Maybe conference committee planners can orchestrate a panel consisting of representatives from the certificate programs noted above, (as well as other programs offering similar “geospatial certificates”) to discuss and highlight their organization’s certificate credentials. Could and should pan out to be an informative session for conference attendees.
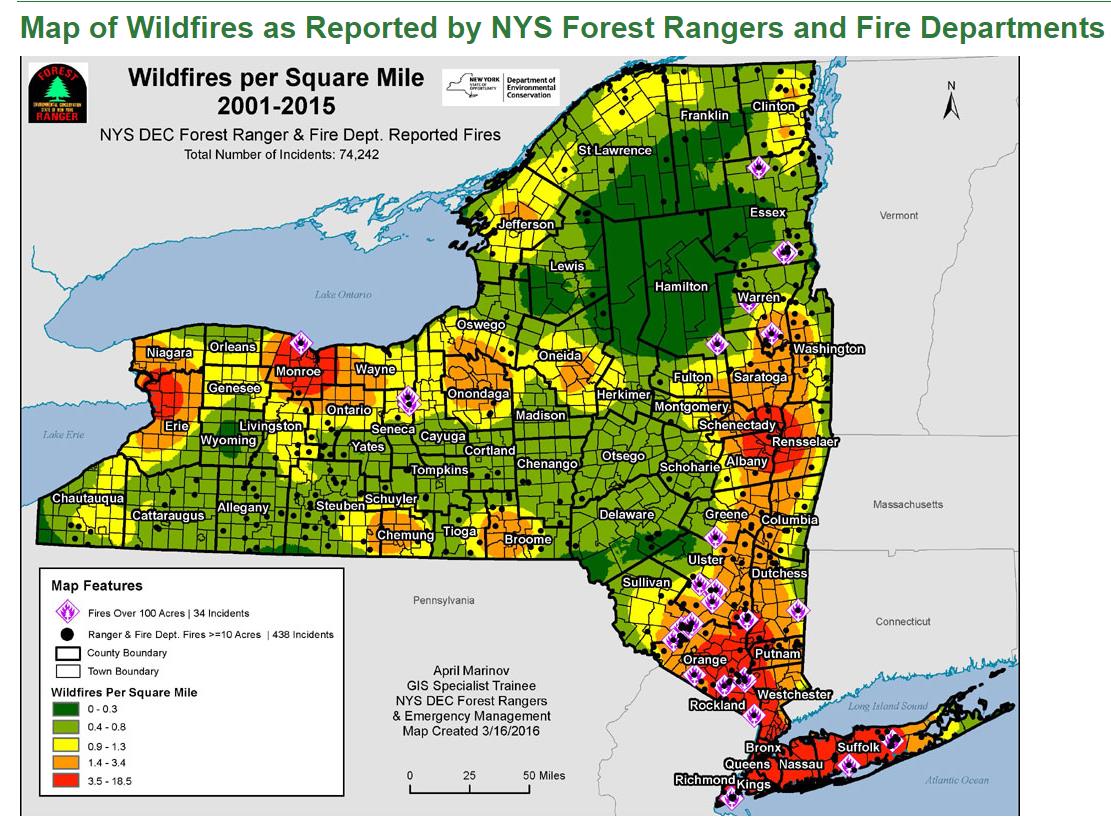
Airports? Yes, airports. There are nearly 150 airports across New York State designated as primary, non-primary, reliever, general aviation (including heliports and seaplane bases) and private. Airports range in size from the behemoth JFK on Long Island to dozens of smaller ones supporting smaller communities across the state. (A New York State Department of Transportation Aviation Bureau 2009-2010 Airport Directory provides similar data). With regard to the larger public facilities, the potential for expanded involvement by GIS practitioners has increased by the virtue of recent Federal Aviation Administration (FAA) advisory circulars (particularly the Series 150 Advisory Circulars (ACs) for Airport Projects) governing the development and management of geospatial datasets when federal funding is involved. Specifics to the regulations and circulars can be found at the FAA Airports Geographic Information Systems (Airports GIS) webpage. In implementing similar work here at the Westchester County Airport (HPN) GIS staff began to immediately realize expanded opportunities in working with airport management staff towards a more comprehensive facility management program – including data and document management, engineering compontents and even real estate/lease management activities. Certainly Airport GIS work will vary greatly across the state, but the fact is the opportunities do exist for government GIS staff (or contractors which manage the facility) at selected statewide government owned airports. Lake Placid (LKP) airport is considered a “general aviation airport” – perhaps we could get airport management or operations staff to the conference and present with regard to local mapping and geospatial activities?
The Federal Aviation Administration “Airports GIS” program provides a framework for local government GIS agencies to become involved in geospatial efforts at many New York State public airports. Working with ESRI, Westchester County GIS has developed a Westchester County Airport (HPN) viewer based on regulations itemized in FAA Advisory Circulars.
Data Visualization
Historically, traditional Empire State GIS shops haven’t gone too far into the data visualization space. In the not too distance past, the “visualization” of GIS data has consisted mainly of publishing hardcopy maps and now more often, web maps and applications. Though this is generally understandable, as data visualization products aren’t normally part of the traditional GIS technician tool kit or the job spec. Or for that matter, even requested of them. But within the larger GIS community, this is slowly changing. ESRI jumped into the fray with the release of ArcGIS GeoAnalytics Server and there are also a bunch of well documented free open source data visualization software packages available which several of the start-ups in metro NYC are using. Increasingly the data visualization platform of choice for Big Data. And while man GIS programs may find it difficult to render geospatial data other than the traditional map format, there are TONS of government and business program areas render the same geospatial data sets though in a different way. Lots of statistics: health, demographics, land values, water/gas/utility consumption, land use and cover type, traffic and public transportation counts, crime, and on and on and on. Great example for a major New York State industry? United States Department of Agriculture National Agricultural Statistics Service (NASS) New York Field Office. And by extension, though rendered on a national level, uber cool data visualization apps from the USDA Economic Research Service. (Note the use of tableau an industry leading data visualization software program.) Same concept different geography. And my recommendation for a primer on data visualization for our Lake Placid conference attendees? Staff from Rensselaer Polytechnic Institute (RPI) Institute for Data Exploration and Applications (IDEA) – stone’s throw from our state GIS Program Office. Maybe even James Hendler, Director of the Rensselaer Institute for Data Exploration and Applications (IDEA), has been appointed to the Homeland Security Science and Technology Advisory Committee.
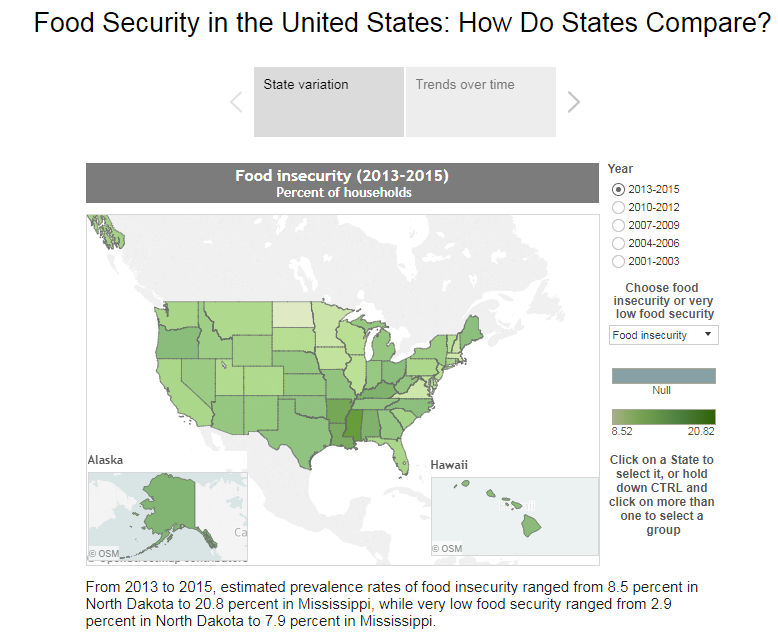
Data visualization software programs such as tableau provide the functionality to publish data in user friendly formats in both graphical (maps) and tabular format. While maps are often common – and best – to convey data patterns and support interpretation, accompanying bar and pie charts often augment the analysis.
Not sure if we’ll see dedicated tracks of business GIS presentations at Lake Placid, but an invitation to New York-based startup Sourcemap would be a good start towards filling out the guest list. Sourcemap focuses on supply chain mapping which in itself would bring a lot of out-of-the-box thinking and way of mapping to the GeoCon audience. Using Open Source components, Sourcemap uses proprietary database technology and visualization algorithms to model any supply chain, any industry, any complexity, from the unit level to the company level in industries such as agriculture, apparel and accessories, food and beverage, electronics and much more. Sourcemap started with a research project at MIT to automate supply chain risk analysis by combining real-time visualization of supply chains with risk exposure, risk probability heat maps and real-time alerts. You can even register for a free account to start your own supply chain mapping though of course, “Lite” and “Enterprise” licensing agreements are available for business and industry. The Sourcemap website is awesome displaying examples of supply chain mapping by both individuals and companies. Want to learn more about where the ingredients of Reese Peanut Butter Cups come from? (And btw – in a very nice Story Map format.) Made in New York. And a very informative and emerging use of geospatial technology which probably hasn’t seen much exposure at past New York State GIS conferences.

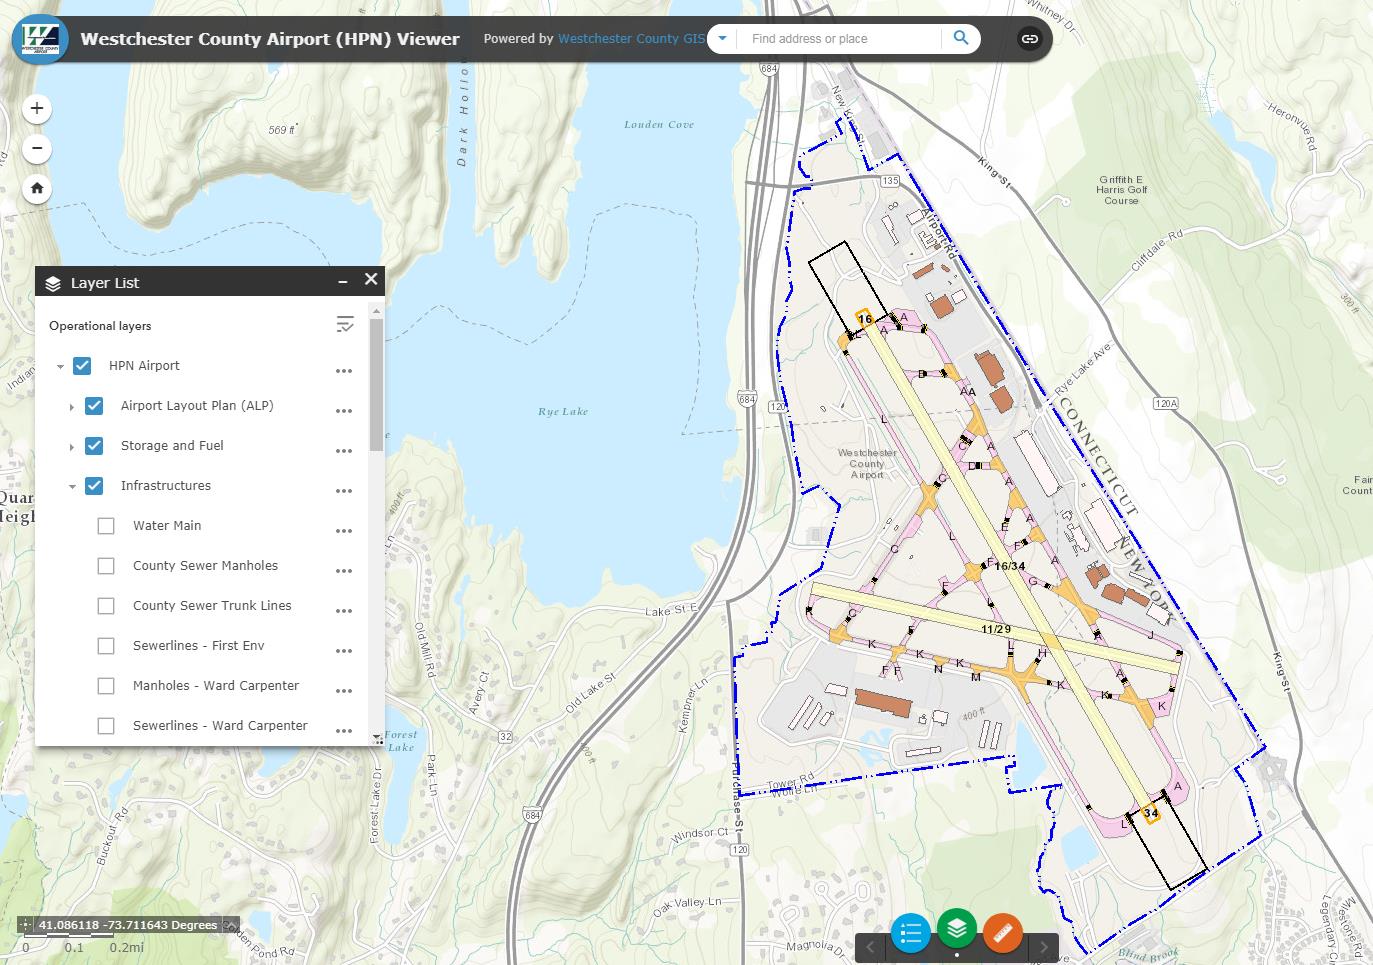
The Lyft app is available for download from both the Google Playstore and Apple
I was going to make this both an “Uber and Lyft” plug, but given the recent allegations and questionable ethical issues recently exposed in the Uber front office, I thought it wouldn’t be appropriate to give the firm any air time. As such, the concepts at Lyft are generally the same and touch many common geospatial components recognized by the Empire State geospatial community – Google Maps, addresses, proximity algorithms, optimal routes, and wireless technologies to name a few. And of course, not to minimize the incredible technology going on in the background to support the smartphone app and get you to where you want to go. No doubt, these ride sharing apps are going to become more functional and integrated in the public transit landscape (just Google “Lyft and Public Transit” and take a look at the search results). Liability and insurance issues will continue to limit the use of these ride sharing apps – though only for the short term – in context of providing support to government funded programs in the areas of transporting individuals with special needs, senior citizens, homeless programs, and perhaps even the paratransit systems. These ride-sharing apps will be public transit change agents.
Getting inside these organizations is difficult as there are limited ways to contact staff and personnel from the outside. I made some progress via a friend of a friend of a friend into Uber last winter trying to arrange a speaker to come to our User Group Meeting in May. However, after a series of emails I was informed they were just not positioned yet to participate or present in these types of User Group meetings and conferences. Perhaps the outcome would be different based on an invite to present at a larger venue such as 2017 GeoCon. Phenomenally different but conceptually similar geospatial technology components. Would be a great presentation just to show how all the geospatial pieces come together to make the app. Available now in a New York State metropolitan area near you.
NUAIR Alliance (Northeast UAS Airspace Integration Research Alliance)
With drones being the subject of so much discussion within the Empire State geospatial community and New York’s growing presence in the global Unmanned Aerial Systems (UAS) marketplace, it would be shortsighted not to include presentations and discussions, if not a keynote speaker, on this technology at the Lake Placid conference. And lucky us there is no lack of industry leading experts in the region many of whom are associated with the NUAIR Alliance headquartered at Griffiss International Airport, in Rome, New York. NUAIR is a New York not-for-profit coalition of more than 100 private and public entities and academic institutions working together to operate and oversee Unmanned Aircraft System (UAS) test ranges in New York, Massachusetts and Michigan. NUAIR Alliance is also responsible for managing a $30 million, 50-mile UAS flight traffic management corridor between Rome and Syracuse, which will allow for testing of Beyond Visual Line Of Sight (BVLOS) concepts and technologies, opening up the drone market for drone operators, pilots and engineers, and creating growth opportunities for commercial drone industry software and hardware companies with UAS applications that range from agriculture to construction. NUAIR also works in collaboration CenterState CEO, the region’s leading business leadership organization to advance the economic development opportunities that the UAS industry holds for the region, with a focus on business attraction and business development. Worthwhile information for any seasoned Empire State GIS professional to have ready for that impromptu 30-second “elevator pitch” when he/she suddenly finds oneself in the presence of elected-officials and politicians. Any of the staff profiled on the NUAIR website would be welcomed and qualified speakers. Recent changes in drone licensing for non-commercial use would provide timely discussion as well as the NUAIR relationship with the GeniusNY incubator in Syracuse which is currently home for six start-ups focusing on UAS technology.
Central New York is recognized as one of the major global centers investing and developing Unmanned Aerial Systems (UAS) technology. New York State GIS community outreach and collaboration with these established – and funded – UAS initiatives is important and critical in building professional credibility and relevance.
MS4 Hackathon
Not a real hackathon (though this would be awesome for an event like this to take place at the GeoCon) but a least an open forum or discussion on how to actually have one. A hackathon to build an app for a statewide program that touches and involves so many governments and facilities: MS4 (Municipal Separate Storm Sewer Systems) – as administered through NYSDEC. In general, the intent of MS4 is to “to develop a stormwater management program that will reduce the amount of pollutants carried by stormwater during storm events to waterbodies to the “maximum extent practicable“. And at the end of the day, it is pretty well recognized and accepted that complying with the regulations is largely a geospatial solution. There is much more to the program and I confess I am no MS4 regulatory expert, but I attend many meetings across different levels of governments and jurisdictions and there is one common element. No one shoe (or app) fits all, but most governments (yes, there are exceptions) have similar – if not identical – MS4 reporting requirements and business needs. All spending money in many different ways for the same outcome. The same product. Which is in stark contrast to the very recent Governor Cuomo Shared Services Initiative “requiring county officials to develop localized plans that find property tax savings by coordinating and eliminating duplicative services and propose coordinated services to enhance purchasing power.” Need more justification?
I’m sure the idea would hit many speed bumps along the way, but there’s enough known pieces now about the program to at least further the concept of building a statewide MS4 compliant mobile app (backend server-side requirements would need to be flushed out as well). Maybe conference planners could facilitate the discussion and get this piece on the agenda. My guess it wouldn’t be too hard to bring some of the software vendors to the table to see how they might contribute to the hackathon – providing services or infrastructure? To DEC’s credit, the agency has been very supportive over the last couple years in context of funding MS4 grants though with “data collection” the main (and only?) focus. Maybe through some Divine intervention allocate a small piece of these multiple funding sources, say, $20,000 (more/less?) to support the hackathon? First prize winner take all for the best designed and MS4 compliant app. Maybe the Association could jump in and coordinate donations and funding?
MS4 isn’t going away and governments are only going to continue to spend money to comply with the regulations. What does the statewide GIS community have to lose? Let the MS4 Hackathon discussion begin.