It was at the 2015 NYS GeoCon Conference in Albany that I saw only a portion of Dr. Tabassum Insaf’s presentation entitled “Lessons Learned in Small Area Spatial Analyses of Health Outcomes” which started an interest in the state of applied GIS/geospatial activity in medicine and health care across the Empire State. Having yet to approach the topic as part of eSpatiallyNewYork and finding an almost complete absence of health sciences content at the exact same state GIS conference this past fall in Lake Placid, I decided to circle back to Dr. Insaf to see if I could begin to scratch the surface on the use of geospatial in the NYS health sciences research communities.
The Albany Connection
After initiating my correspondence with Dr. Insaf, the use of geospatial technologies in academic health care research across the Empire State became apparent.. Given the presence of NYS Dept. of Health in Albany, research in this space at the SUNY Albany School of Public Health is an obvious location. Further review of the subject matter identified similar research programs at other academic institutions including Columbia University, New York University, and CUNY.
Like several other New York State Department of Health (NYSDOH) Research Scientists, Dr. Insaf holds an appointment at the School of Public Health. At NYSDOH, Dr. Insaf is the Acting Research Director at the Bureau of Environmental and Occupational Epidemiology. Her research interests are in understanding the role of environmental, social and behavioral factors in health disparities. Her work encompasses longitudinal and multilevel data analysis, Geographic Information Systems (GIS) technology and spatial epidemiologic methods.
With regard to the shortage of health sciences presentations at New York State GIS conferences, Dr. Insaf suggests the issue may be threefold: (1) While the use of geospatial technology is common in their work, results in this space are often not presented or used as maps or other visual aids. (2) Health data is often confidential and locations cannot be published, and (3) there may be more due to a lack of awareness in the health community that there may be interest and audience for this type of work in the GIS community.
Illustrative research efforts of Dr. Insaf include:
Social Determinants of Health for Low Birth Weight (LBW)
This research utilizes a variety of NYS public health records with the intent of better understanding and identifying potential social determinants of low birth rates focusing on data from selected census tracts in the metropolitan areas of Buffalo, Rochester, Albany, and Westchester/Long Island. Applying geoprocessing tools and analysis, research findings suggest that census tract-area proportions of LBW was highest in areas with larger Hispanic or Black populations and high smoking preferences. Spatial Regression analysis was used to predict prevalence of LBW based on these major social determinants to identify areas of high risk of LBW.
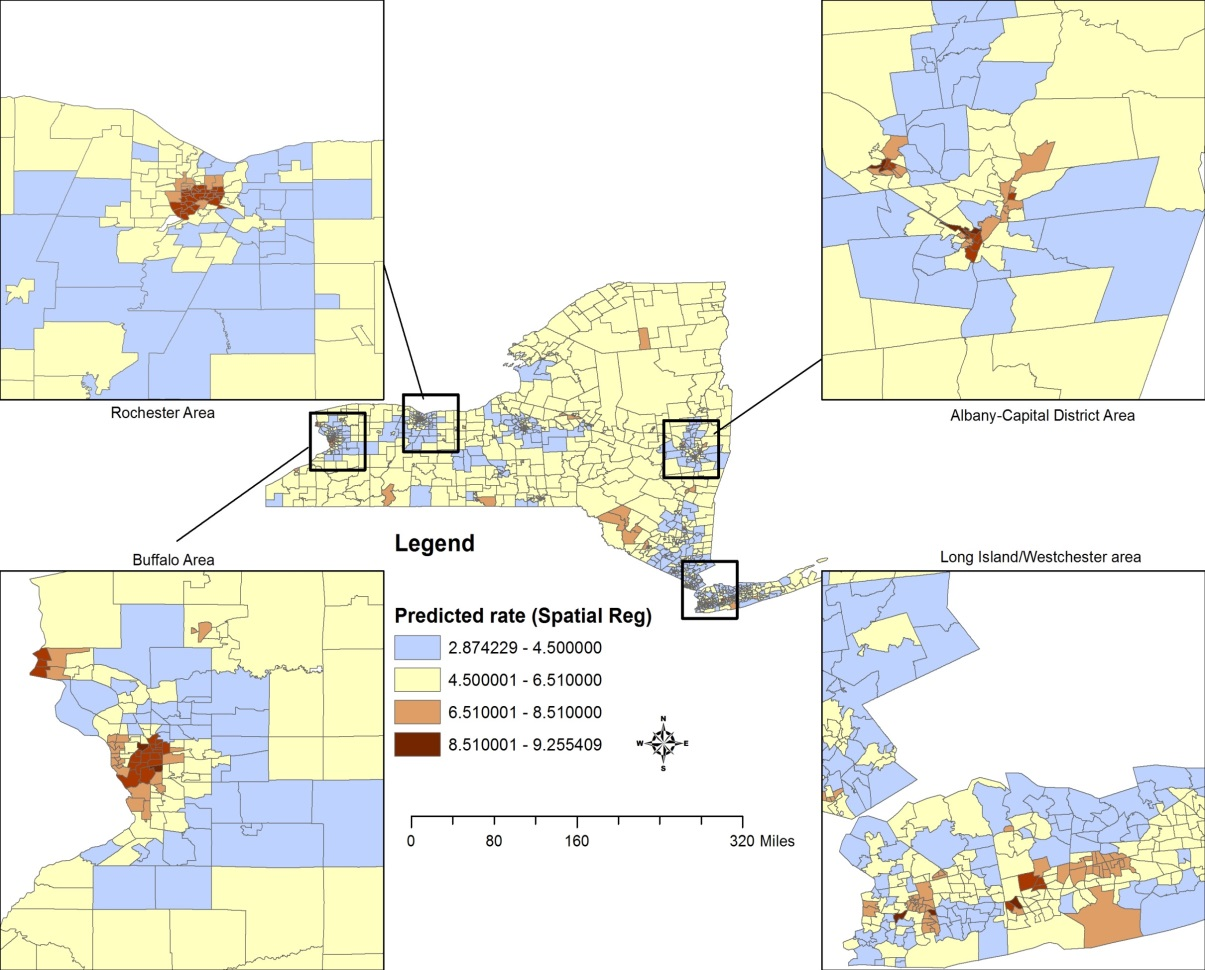
Predicted rates (%) for low birth weight prevalence based on a spatial error model that incorporates social determinants as race/ethnicity, prenatal care, smoking prevalence and maternal education.
It’s worth noting that her work in this space included collaborating work with Tom Talbot, now retired, who was an early champion of GIS technology in NYSDOH.
Health Impacts from Increased Temperatures Due to Climate Change
More recently Dr. Insaf has been working with several state agencies (bringing together New York State Department of Health, Florida Department of Health and New York City Department of Health) to develop indicators of localized climate trends, review and develop public health relevant heat warning messaging and develop local assessments of vulnerability to extreme heat for specific communities using remote sensing data from NASA satellites.
The team has worked with multiple stakeholders and collaborators including the CDC Environmental Public Health Tracking Network, State Climatologists, National Weather Service offices, NYS Department of Environmental Conservation, Office of Emergency Preparedness and local county health departments to develop climate information relevant to their mandates and jurisdictions. Researchers spatially linked satellite derived modeled data for air temperatures and heat index at a 12KM resolution with geocoded health outcome datasets (Hospitalization and Emergency Department visits for heat stress, renal disease and cardiovascular disease). The team then estimates the risk of adverse health outcome for each 5-degree change in temperature and have also developed heat health profiles combining heat, health and vulnerability indicators for each county. The county profiles will be available soon as downloadable pdfs at the NYS Department of Health Climate, Weather and Health website.
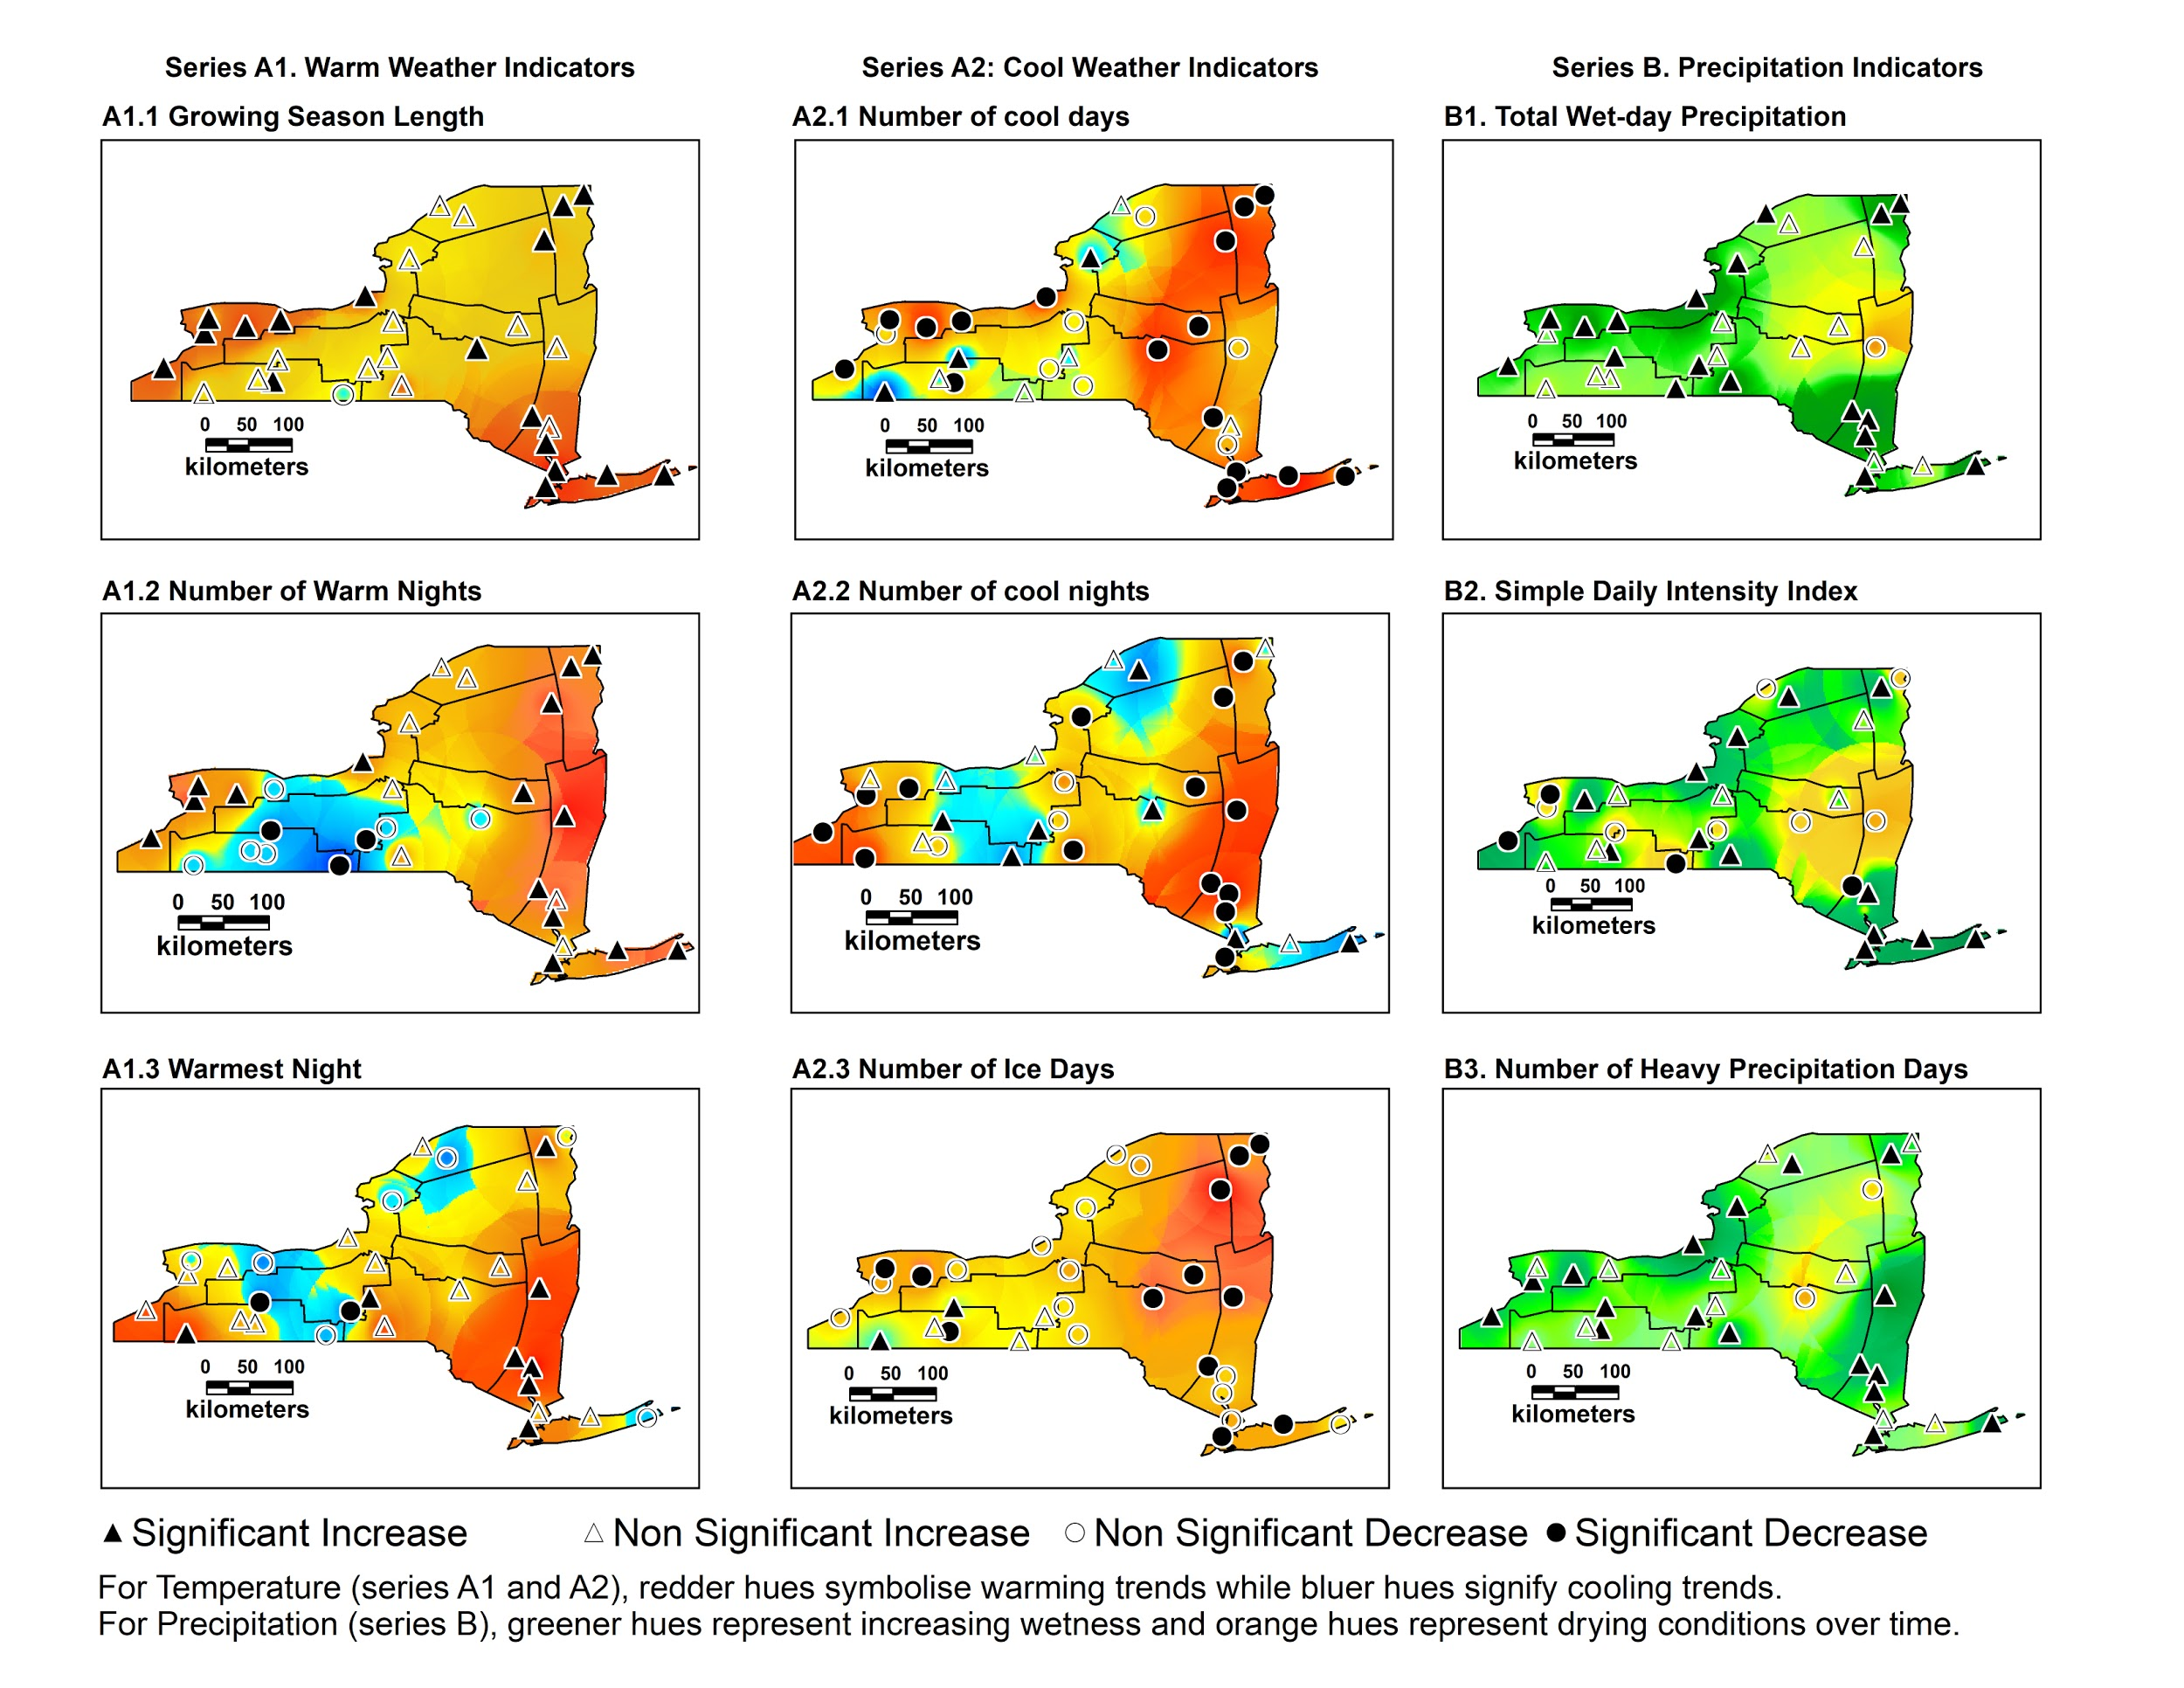
The initial assessment of Climate in NYS that was the springboard for this more recent work is published here. In an analysis of the U.S. Historical and Climatology network dataset for the 60 year period of 1948-2008 it was found that the most representative extreme weather indicators in NYS for warm weather are growing season length and warm nights. The most representative indicators during cold weather are a decline in cool days and ice days. Most other temperature indicators are also consistent with the warming trend. The precipitation indicators in the study report all point towards increasingly wet conditions over time. The most representative indicators were total precipitation and the simple daily index. Data also suggests the Great Lakes, Northern Plateau, Champlain Valley and Coastal New York regions may be particularly sensitive to changes in extreme climate events.
The map shows the predicted rates (in %) for low birth weight prevalence based on a spatial error model that incorporates such social determinants as race/ethnicity, prenatal care, smoking prevalence and maternal education.
Her team is currently using a spatially contiguous satellite derived dataset to build upon this work and to estimate health risks of heat exposures in rural and urban areas of New York. She is working with the National Weather Service offices to inform guidance on heat warning issuance in the area based on local thresholds. The ongoing work is sponsored through a NASA ROSES (Research Opportunities in Space and Earth Sciences) grant. A great poster presentation on this work can be found here.
Estimating Health Care Access Times
Dr. Insaf has been focusing research on data from a newly established congenital heart defects (CHD) surveillance program funded by the Center for Disease Control (CDC). Analysis uses geocoded data from surveillance datasets to determine patient access times to Cardiac Surgical Care facilities using the Google driving distance/time Application Programming Interface (API). These driving time estimates are then compared against travel times from the same address using public transit (where available in more urbanized areas). It is widely accepted that differences in travel distance to appropriate care among individuals with birth defects can have a significant impact on healthcare utilization, and it has been suggested that geographic barriers may play a role in cessation of care among those with CHDs.
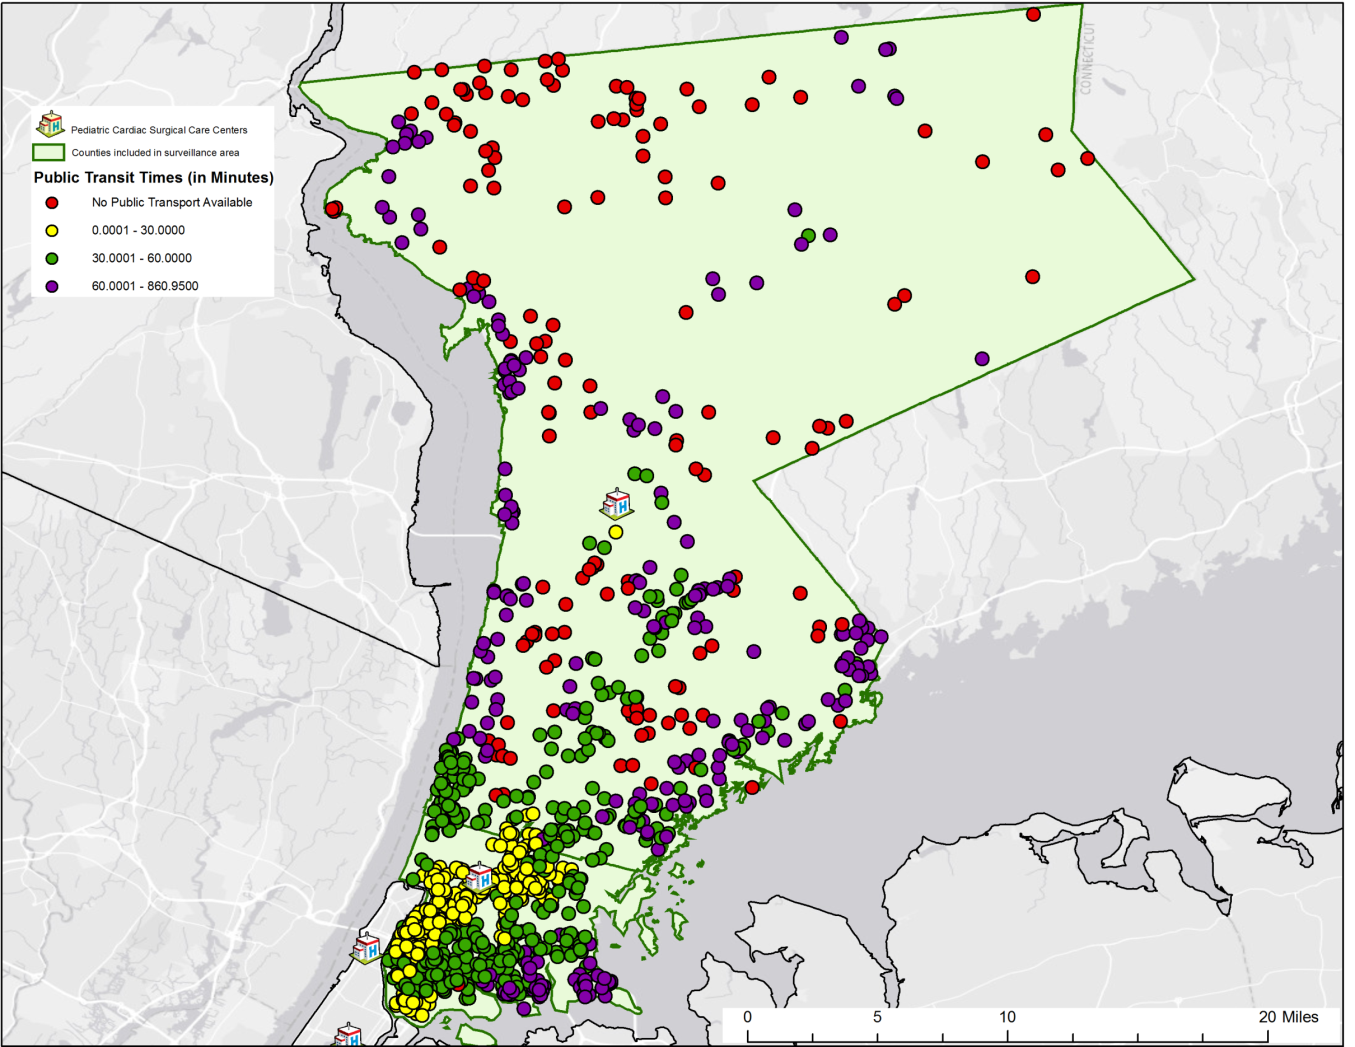
Calculated drive times in minutes for congenital heart defects patients to Cardiac Surgical Care facilities in Westchester County and the Bronx.
Other Representative Statewide Efforts
Dr. Glen Johnson, Associate Professor in the Department of Environmental, Occupational and Geospatial Health Sciences at the City University of New York School of Public Health, focuses geospatial aspects of health, with particular application to environmental and community-level social determinants of health outcomes. Research in the Bronx includes examining the relationship between walkable access to healthy food sources (HFS) and the risk of anemia in pregnancy. After geocoding patient residences, street network distances were obtained for the closest healthy food sources, which were identified from multiple databases. For lower-income patients, as indicated by Medicaid or lack of health insurance, those who lived less than 0.25 miles from a healthy food source were less likely to be anemic when compared to those who lived farther away. Patients with commercial insurance showed no effect. These results continue to help to understand how a nutritionally-mediated condition such as anemia during pregnancy can be affected by one’s built environment, while also highlighting the importance of conditioning on socioeconomic status for these types of studies.
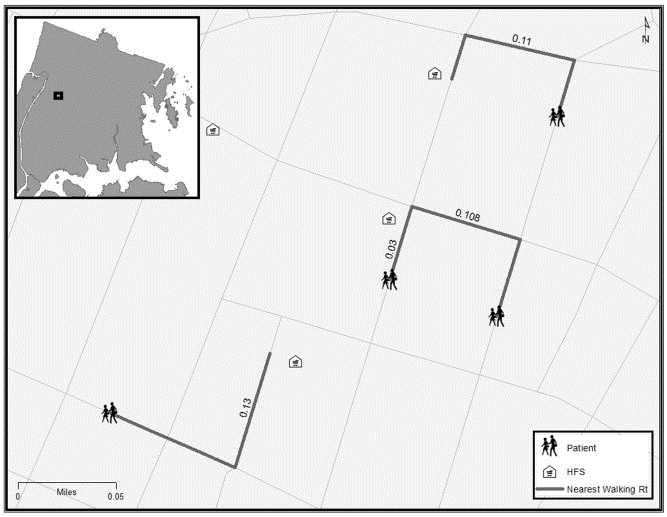
The primary variable of concern in the Bronx study: The street network walking distance to a Healthy Food Source (HFS) for a pregnant woman.
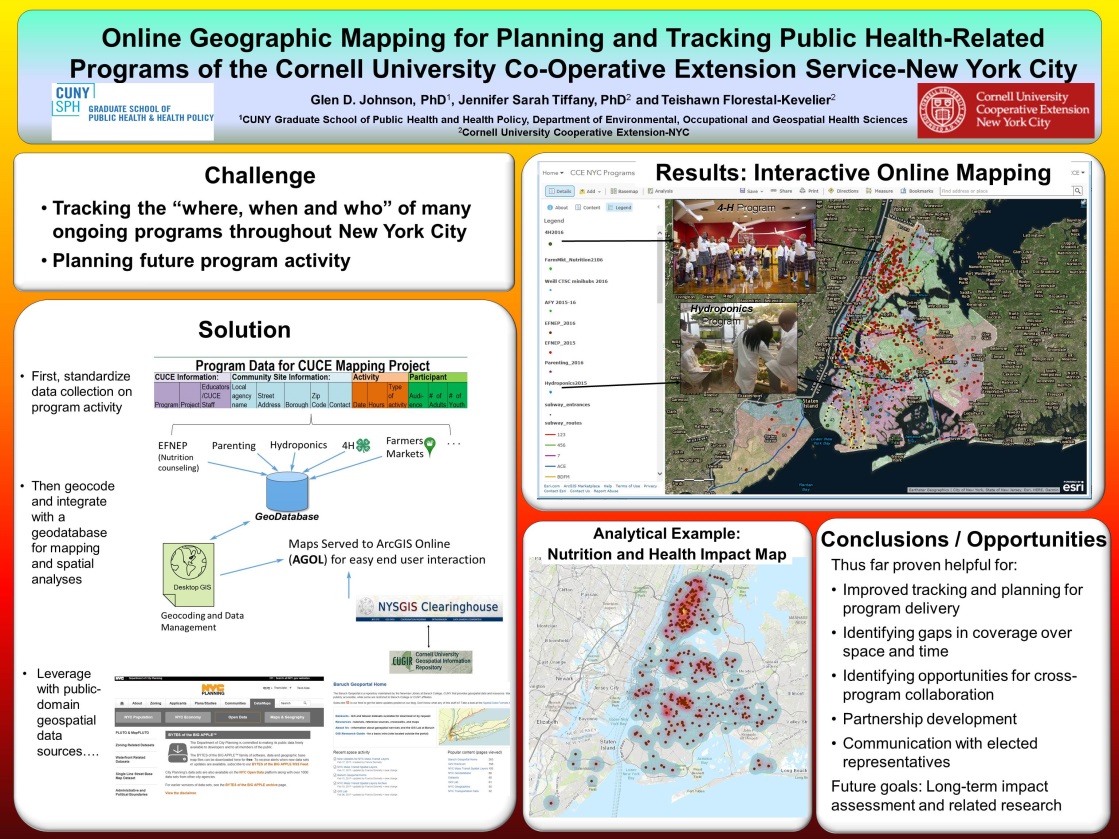
Most recently he has been working with the Cornell University Cooperative Extension (CUCE) who implement multiple programs aimed at improving overall population health in communities throughout NYC. Examples range from community-based educational programs in nutrition and parenting to 4-H STEM programs for children. Keeping track of the “where, when and who” of many ongoing programs in the largest city in North America is challenging. Online GIS mapping has provided a partial solution to this management challenge. The poster below was presented at the New York State Health Foundation conference last December.
Johnson’s work also appears as “A Community Needs Index for Adolescent Pregnancy Prevention Program Planning: Application of Spatial Generalized Linear Mixed Models” in . Maternal and Child Health Journal. He is a former biostatistician for the New York State Department of Health and a faculty member of the University at Albany School of Public Health.
Also at CUNY Dept. of Environmental, Occupational, and Geospatial Health Sciences is Dr.Andrew Maroko, Associate Professor. Past research involves the use of geospatial tools focusing on the health outcomes of (unhealthful) food-and-beverage advertising in subway stations This research focused on the correlations between ad exposures and sugary-drink consumption, fruit-and-vegetable intake, and diabetes, hypertension, and high cholesterol rates. Subway-station ads for “less-healthful” items were located disproportionately in areas home to vulnerable populations facing diet and diet-related-health challenges. The fact that uneven ad placement did not relate to total rider counts suggests ads were not directed at the largest possible audiences but rather targeted to specific groups.
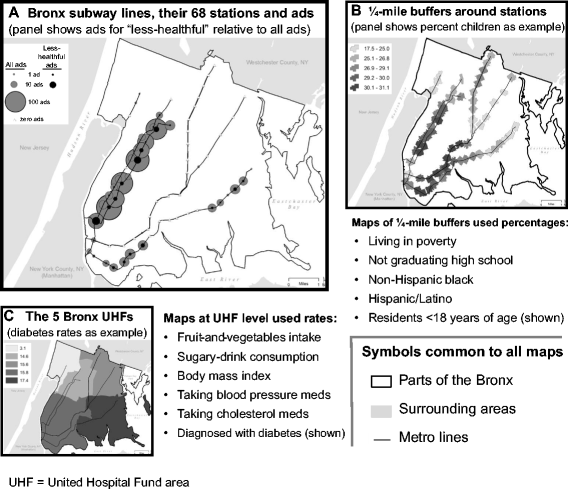
Ad placement did not relate to the number of riders entering at stations. Instead, exposure to food-or-beverage ads generally, and to “less-healthful” ads particularly (specifically ads in Spanish, directed at youth, and/or featuring minorities), was directly correlated with poverty, lower high-school graduation rates, higher percentages of Hispanics, and/or higher percentages of children in surrounding residential areas.
Other Maroko NYS geospatial-based research work includes “Integrating Social Determinants of Health With Treatment and Prevention: A New Tool to Assess Local Area Deprivation” and “Direct observation of neighborhood stressors and environmental justice in the South Bronx, New York City”.
Dr. Jessica Athens at New York University School of Medicine, Department of Public Health, is part of the Health Geographics Research Initiative (Health GIS). One of her primary focuses at the present is City Health Dashboard presents data on health outcomes and the upstream determinants of health for 500 Cities across the U.S. Her team produced a pilot version with four cities which can viewed at www.cityhealthdashboard.com. Starting on May 15, the site will include data for 500 cities will be available at the same URL.
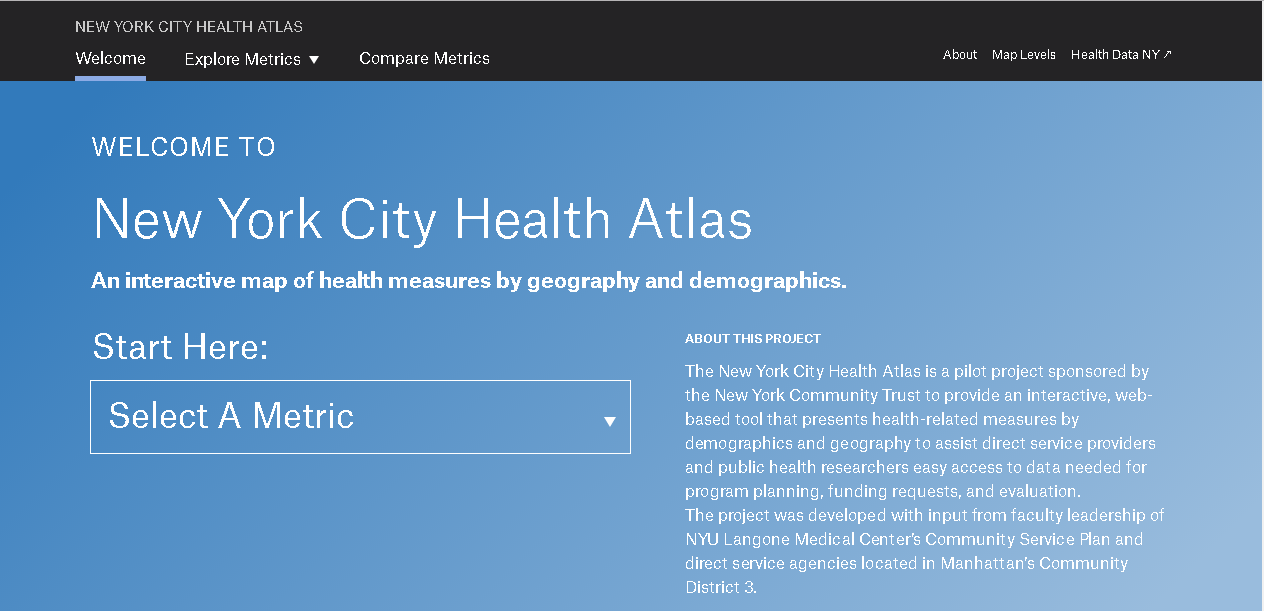
Dr. Athen’s other work includes the NYC Health Atlas which is sponsored by the New York Community Trust. The application provides direct service providers and public health researchers easy access to data needed for program planning, funding requests, and evaluation.
Also in the region at Columbia University, Department of Psychiatry, Division of Child and Adolescent Psychiatry, Drs. Christina Hoven, George Musa and Lupo Geronazzo-Alman are working on several projects using geospatial analyses to understand the effects of neighborhood quality, safety and socioeconomic status on psychopathology.
Summary
The combination of world renown medical research facilities and the growing use geospatial technologies at these organizations is an evolving environment the New York State GIS community should take advantage of and nurture. As we find ourselves amidst major public health challenges impacting our communities from issues such as the growing influence of Climate Change, the spread of infectious diseases, and the ubiquitous opiod crisis among others, the use of geospatial tools in collaboration with the health care research community will bode well for increasing the visibility of the profession across the Empire State.
