NYC-based nonprofit has developed extensive portfolio of educational products for all ages and settings
StoryMaps are such a great communication tool. Turning geographic and location-based features and concepts into an easy-to-understand medium for the much broader audience which help identify key community resources, assets and experiences that can inform planning and policy-making. By combining narrative text and other multimedia content with Geographic Information System (GIS) maps and data, story maps serve as an effective means of helping residents and developers visualize and understand projects with greater clarity. Increasingly becoming an art form unto itself. Broadly and increasingly used across the geospatial spectrum from the industry-leading ESRI StoryMaps platform to say the least of the versions being offered by others in the geospatial space including Google Earth, CARTO, or Tableau.
I’m sure its not the first time Story Map subject matter has found its way to be included in a more technical oriented conference, but I was nonetheless interested, if not surprised, to see a presentation by NYC H2O at the recent the September 9th New York City Watershed Science and Technical Conference. A conference historically the home for geospatial-based technical and scientific presentations by engineers, biologists, and others in the water science disciplines, NYC H2O’s presentation was entitled “Engaging an Urban Population With Water Engineering Utilizing a Virtual GIS Platform in the Pandemic Era”.
Having received its nonprofit 501(c)(3) designation in May, 2012, such work is not new to NYC H2O as it has built a niche in the environmental education space using the Story Map platform as its primary teaching and outreach tool. Story Maps augment and support their mission to “inspire and educate New Yorkers of all ages to learn about, enjoy and protect their city’s local water ecology. Since 2009, NYC H2O has offered over 120 educational programs focused on NYC’s water system and ecology to a combined audience of 4,000 people. Their StoryMaps often incorporate digitized historic maps, photographs, videos, and social narratives to tell the story of water‐related infrastructure.
A couple of NYC H20’s StoryMaps in the water sciences and environmental space include:
Water Systems Overview
I’ve often heard the New York City aqueduct system referred to as the “eight wonder of the world”. Maybe not as sexy and visible as the Great Pyramid but an incredible engineering marvel nonetheless. Conceived, designed and built in another era to support the drinking water lifeline of the city.
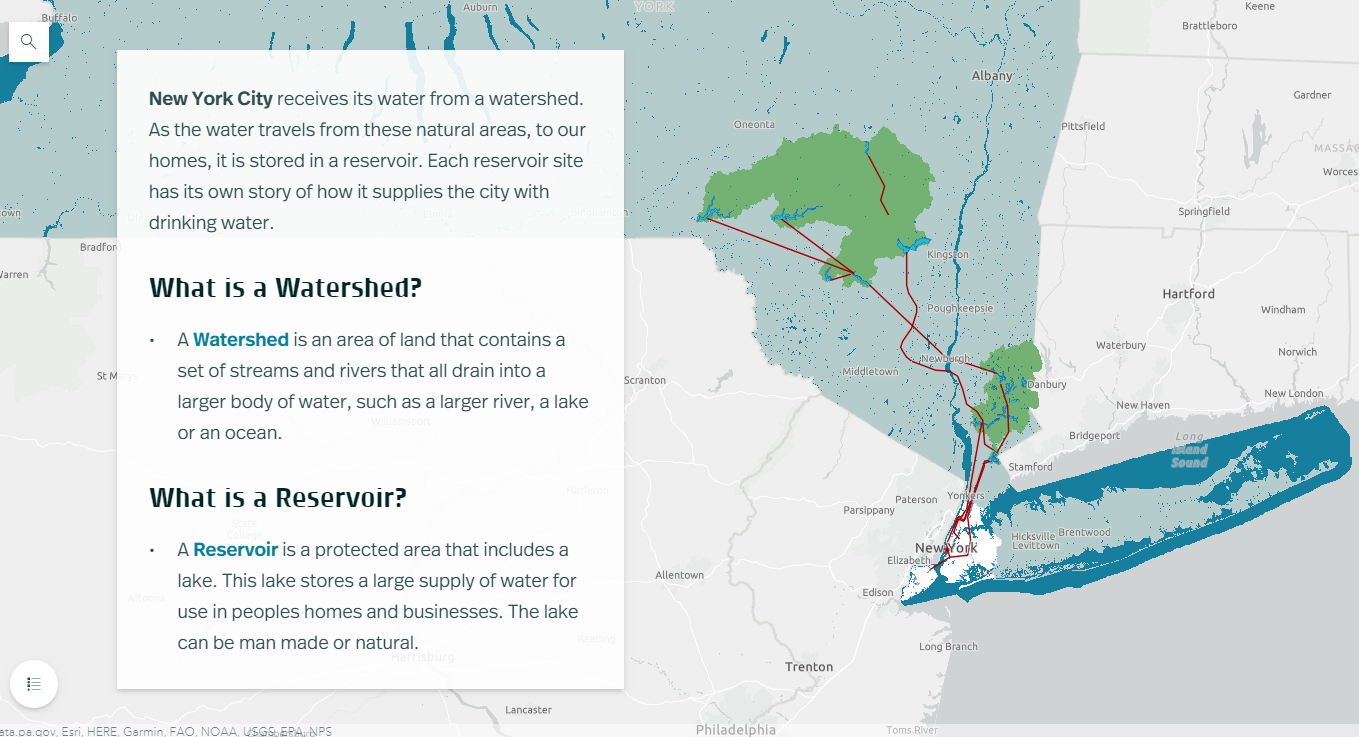
NYC receives 90% of its water from the Delaware and Catskill Watersheds. Aqueducts (red line work) transports the fresh water from a series of reservoirs in the Catskill Mountains over 100-miles from the city.
Fitting that the first StoryMap posted by NYC H2O on their “Hub” website is entitled Water Systems Overview outlining and showing the many geographies of the system which originates in the Catskills Region. An interactive StoryMap highlighting the major aqueduct systems (Catskill and Delaware – named for the watersheds where the water is collected), as well as the individual reservoirs both upstate and those in the city. Household water consumption stats are also included in the StoryMap as well as several interactive learning activities as illustrated in the application toolbar below. Included in the Site Specific Lessons is a StoryMap just for High Bridge and the Jerome Park Reservoir.
![]()
Sewer System and Stormwater Management
This StoryMap, focusing on the relationship between storm water and sanitary sewage, and its overall impact on water quality in the metropolitan region has lots more maps and associated data.
Beginning in 1850, NYC laid 70 miles of sewers, or underground pipes that carried away wastewater. Today the city has over 7,400 miles of sewer pipes. These pipes move wastewater with the help of 95 pumping stations to 14 sewage treatment plants located in all five boroughs. Each day, NYC wastewater treatment plants process, or “clean”, a total of 1.3 billion gallons of wastewater. Produceing about 1,400 tons, or 60 truckloads, of biosolids!
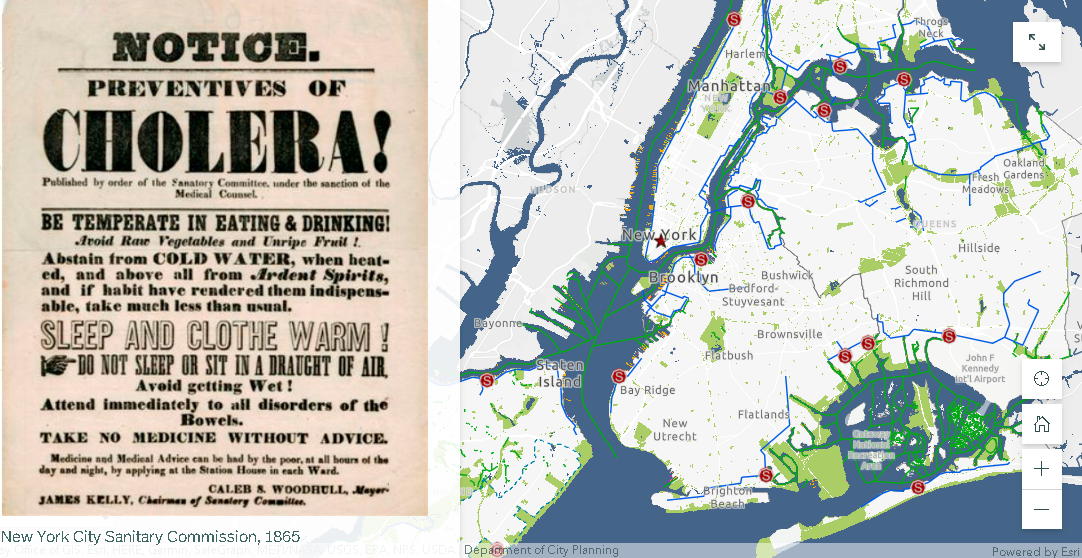
The city maintains 14 sewage treatment plants covering the five boroughs. Treated sewage effluent is discharged into the Hudson and East Rivers and Long Island Sound.
About 60% of New York City’s sewer system is a combined sewer system. This means that one single pipe carries both stormwater runoff AND sewage from city buildings. During heavy rainstorms, combined sewers systems receive more stormwater runoff and sewage. Wastewater Treatment plants have a capacity, or a limit, to how much water they can clean. When there is more water than the capacity, a mix of stormwater and untreated sewage empties directly into the City’s surrounding waterways. These wet weather events are called combined sewer overflows (CSOs).
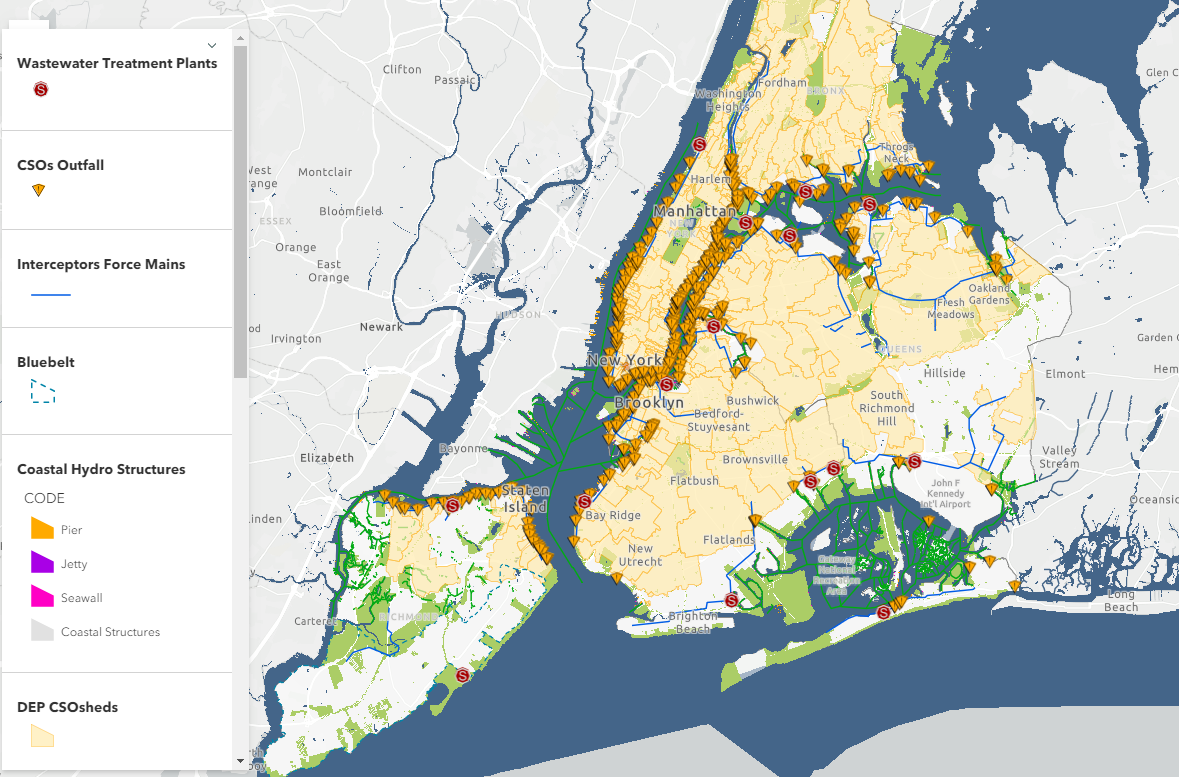
The presence of combined sewers are still very prevalent in the metropolitan region with the majority emptying into the East River and the east side of the Hudson River.
Also central to the long term management of clean water – are government regulated programs entitled Municipal Separate Storm Sewer System (MS4) programs. In populated areas many neighborhoods, including in New York city, as well as industrial areas along coasts, have deployed MS4 programs. A MS4 has one set of pipes that transports sewage to sewage treatment plants and another set of pipes that transports stormwater directly to local waterways. Unfortunately, many pollutants (like oil, trash, pet waste, pesticides, and fertilizers from lawns) are washed into this system when it rains. MS4 helps solve one problem (CSOs and sewage in the local waterways) but causes a similar, although smaller, problem since trash and pollution can still enter the local waterways when it rains.
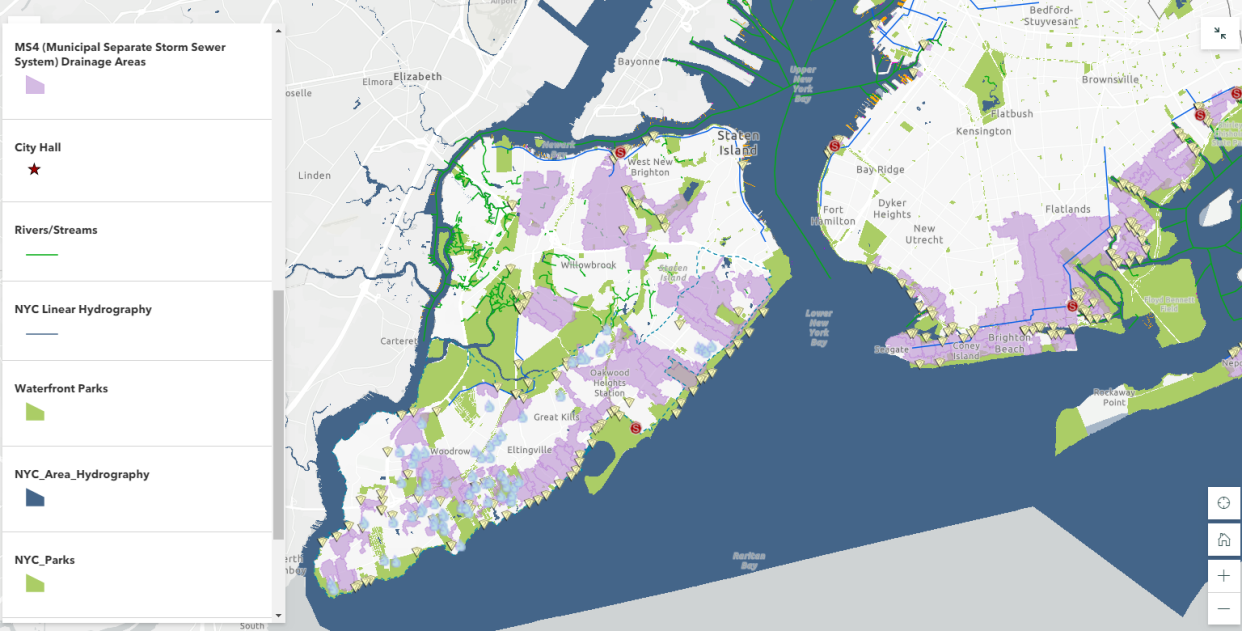
Currently, only about 40% of the NYC footprint is covered by an MS4.
As it relates to the collection of data for the purposes of monitoring citywide water quality, this StoryMap also includes interesting map displays of both fecal coliform (1985-2017) and dissolved oxygen (1909-2017) testing.
Summary:
It’s nice to see as part of such advocacy efforts the use of open data sets and geographic content as made available by government agencies and data portals. Much of which is included in many of the 21 StoryMaps listed on the NYC H2O HUB.
“StoryMaps allowed us to keep students engaged in learning about their local water issues throughout the challenges of the pandemic. The tool has been so popular with schools that this year we launched a curriculum introducing GIS and StoryMaps to several environmental science and environmental justice in high school classrooms”, notes Kevin Barrett who guides NYC H2O’s mapping instruction.
With regard to the September 9th New York City Watershed Science and Technical Conference, Stalin Espinal, School Program Manager for NYC H2O adds “The conference gave us the opportunity to share our work and programs to a community of our peers. We were delighted to have received such enthusiasm and interest in our work with GIS and StoryMaps. Even resulting in a new StoryMap collaboration in partnership with the Watershed Agriculture Council (WAC) which works with local farms on and around the upstate New York City watershed to promote Best-Practices and make improvements that help protect the water quality of our drinking water.”
Contact:
Kevin Barnett
GIS Education/Project Manager
kevin@nych2o.org
www.nych2o.org