Summer Reading: The Drones Are Amongst Us

Transformation geospatial technology is emerging as a “must have” in government GIS programs

Last month Governor Kathy Hochul announced the completion of the Skydome facility at the Griffiss Business and Technology Park in Rome, Oneida County. Located in a former airplane hangar, the indoor facility is the largest indoor drone test facility in the nation and a major investment in New York’s Unmanned Aircraft Systems (UAS) Test Site.  This investment adds to the already impressive UAS and high-tech ecosystem in the Empire State centered along the Syracuse-Rome corridorIts no news at this point that UAS are a transformation technology in the GIS and geospatial space with cutting-edge research and development going on right here in our backyard.  The Northeast UAS Airspace Integration Research Alliance (NUAIR) website provides a great example of this growing technology space which includes government, industry and academia.

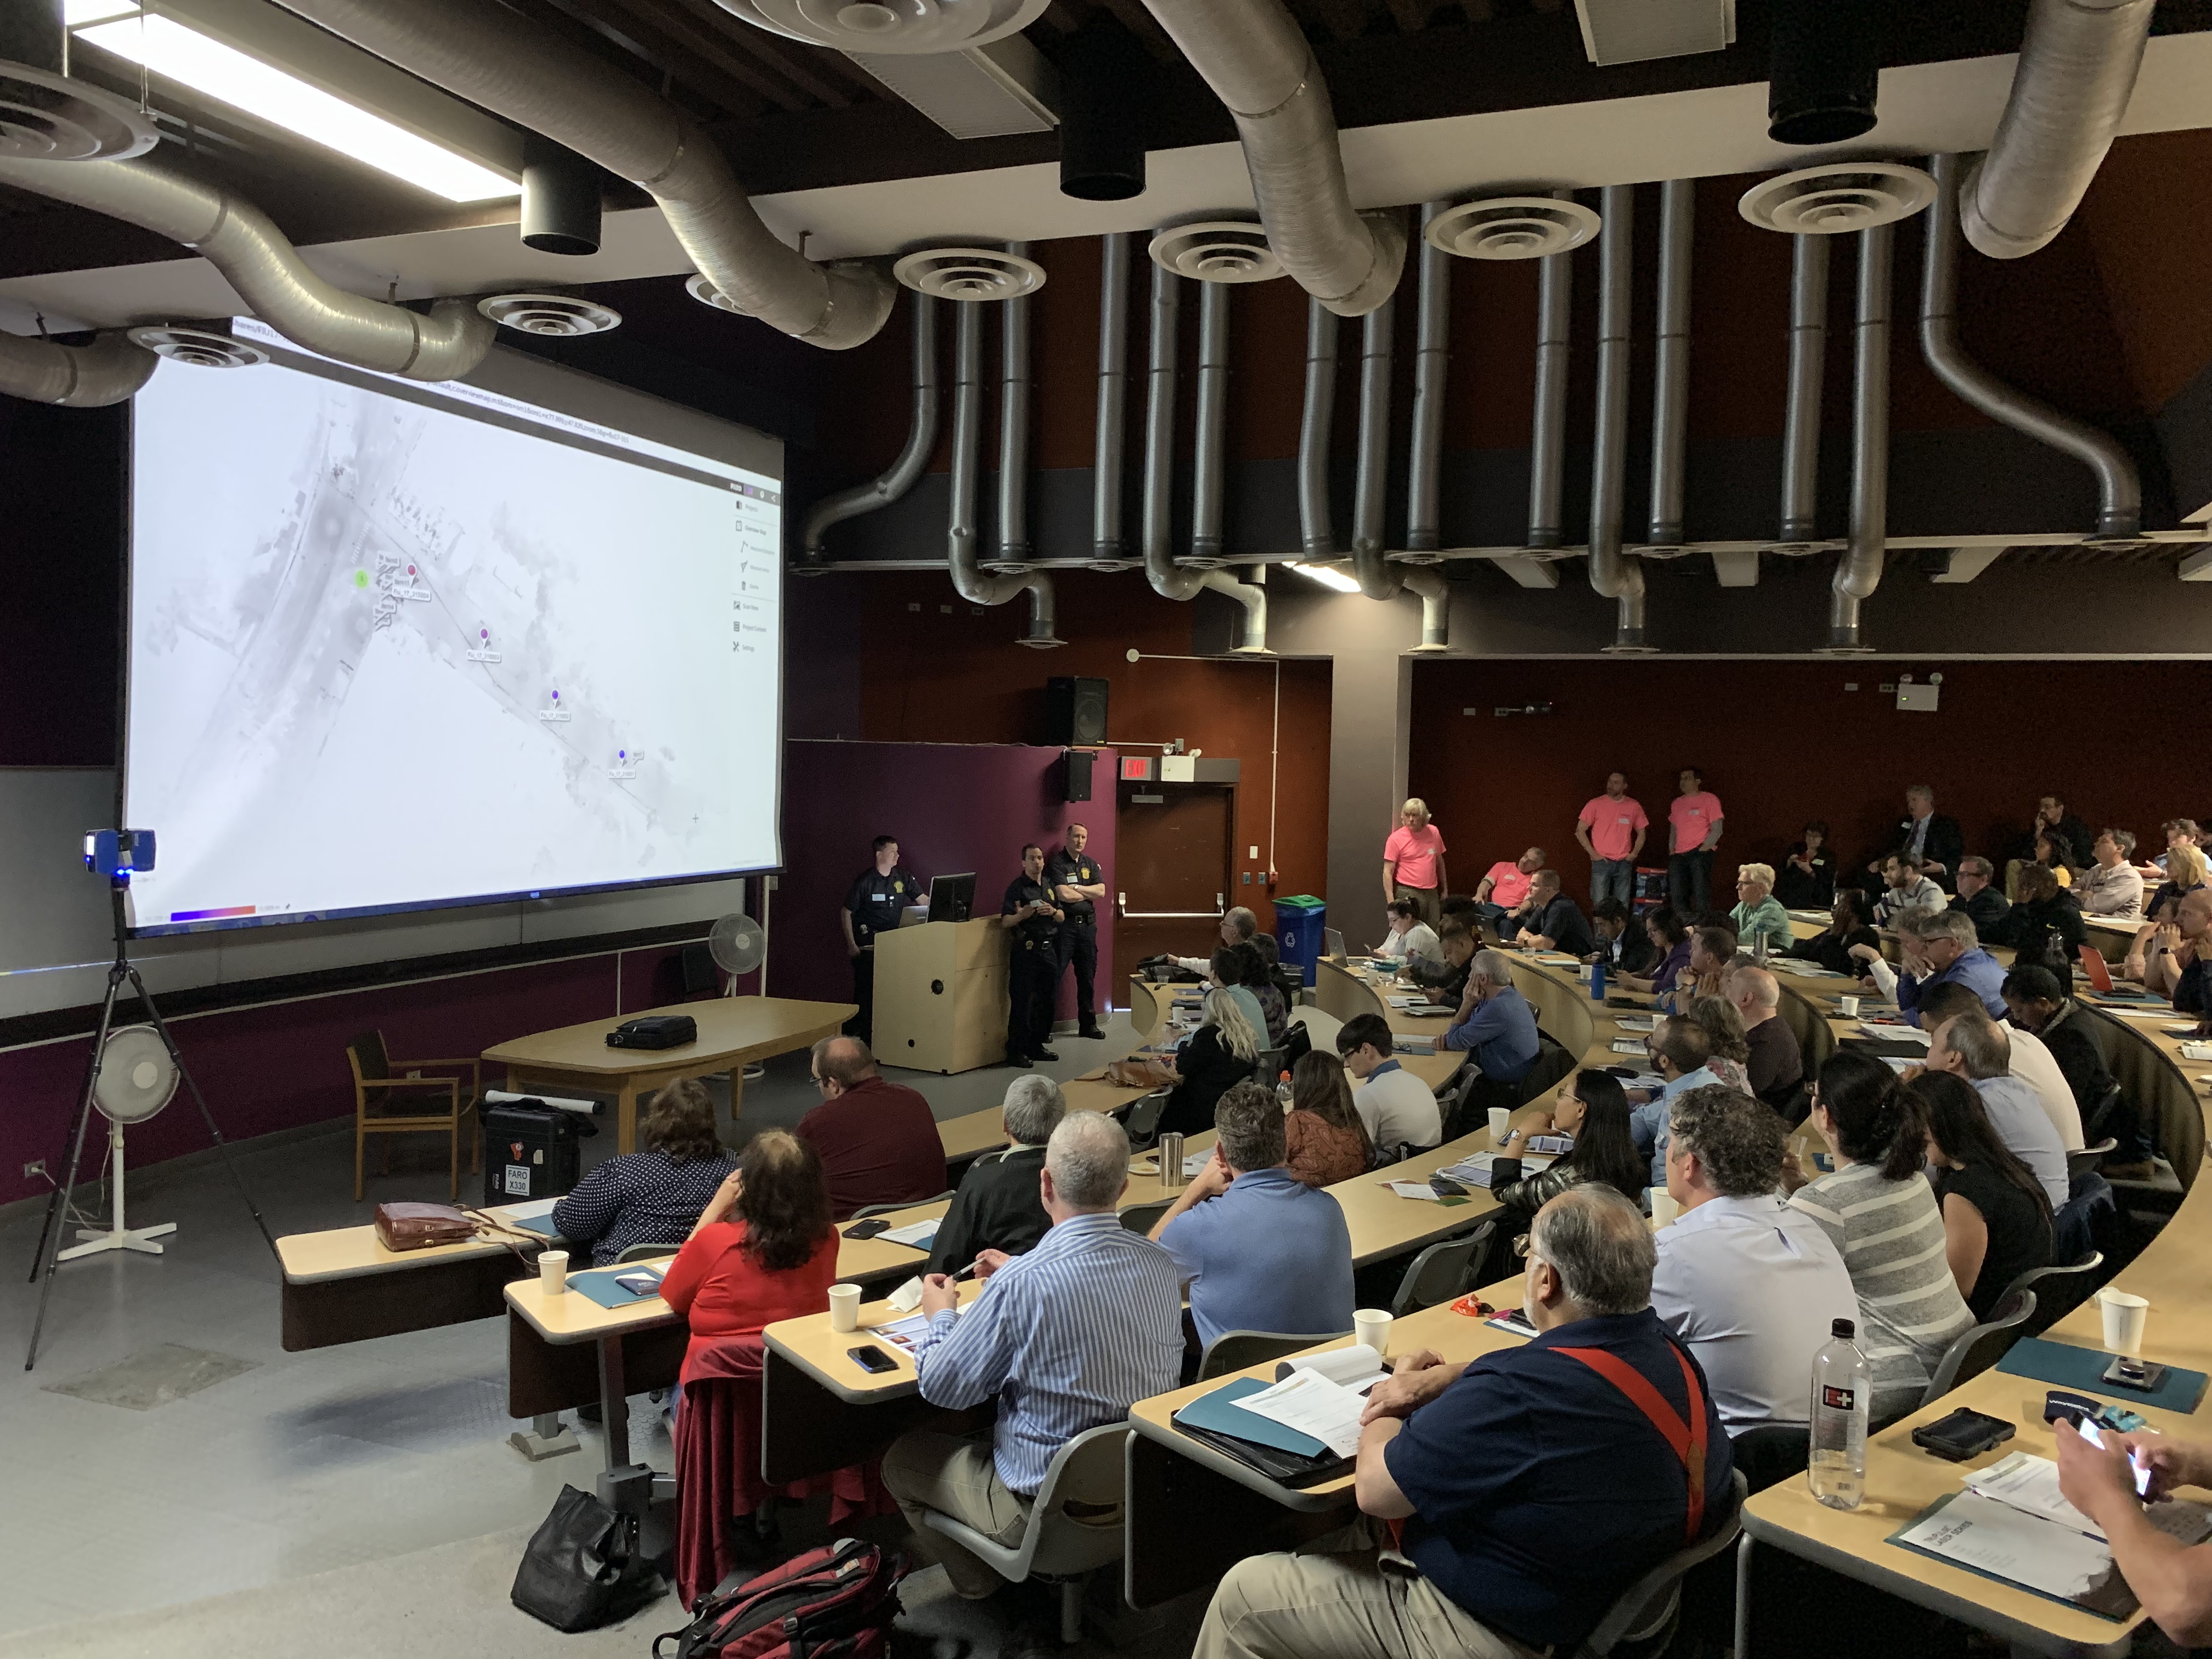
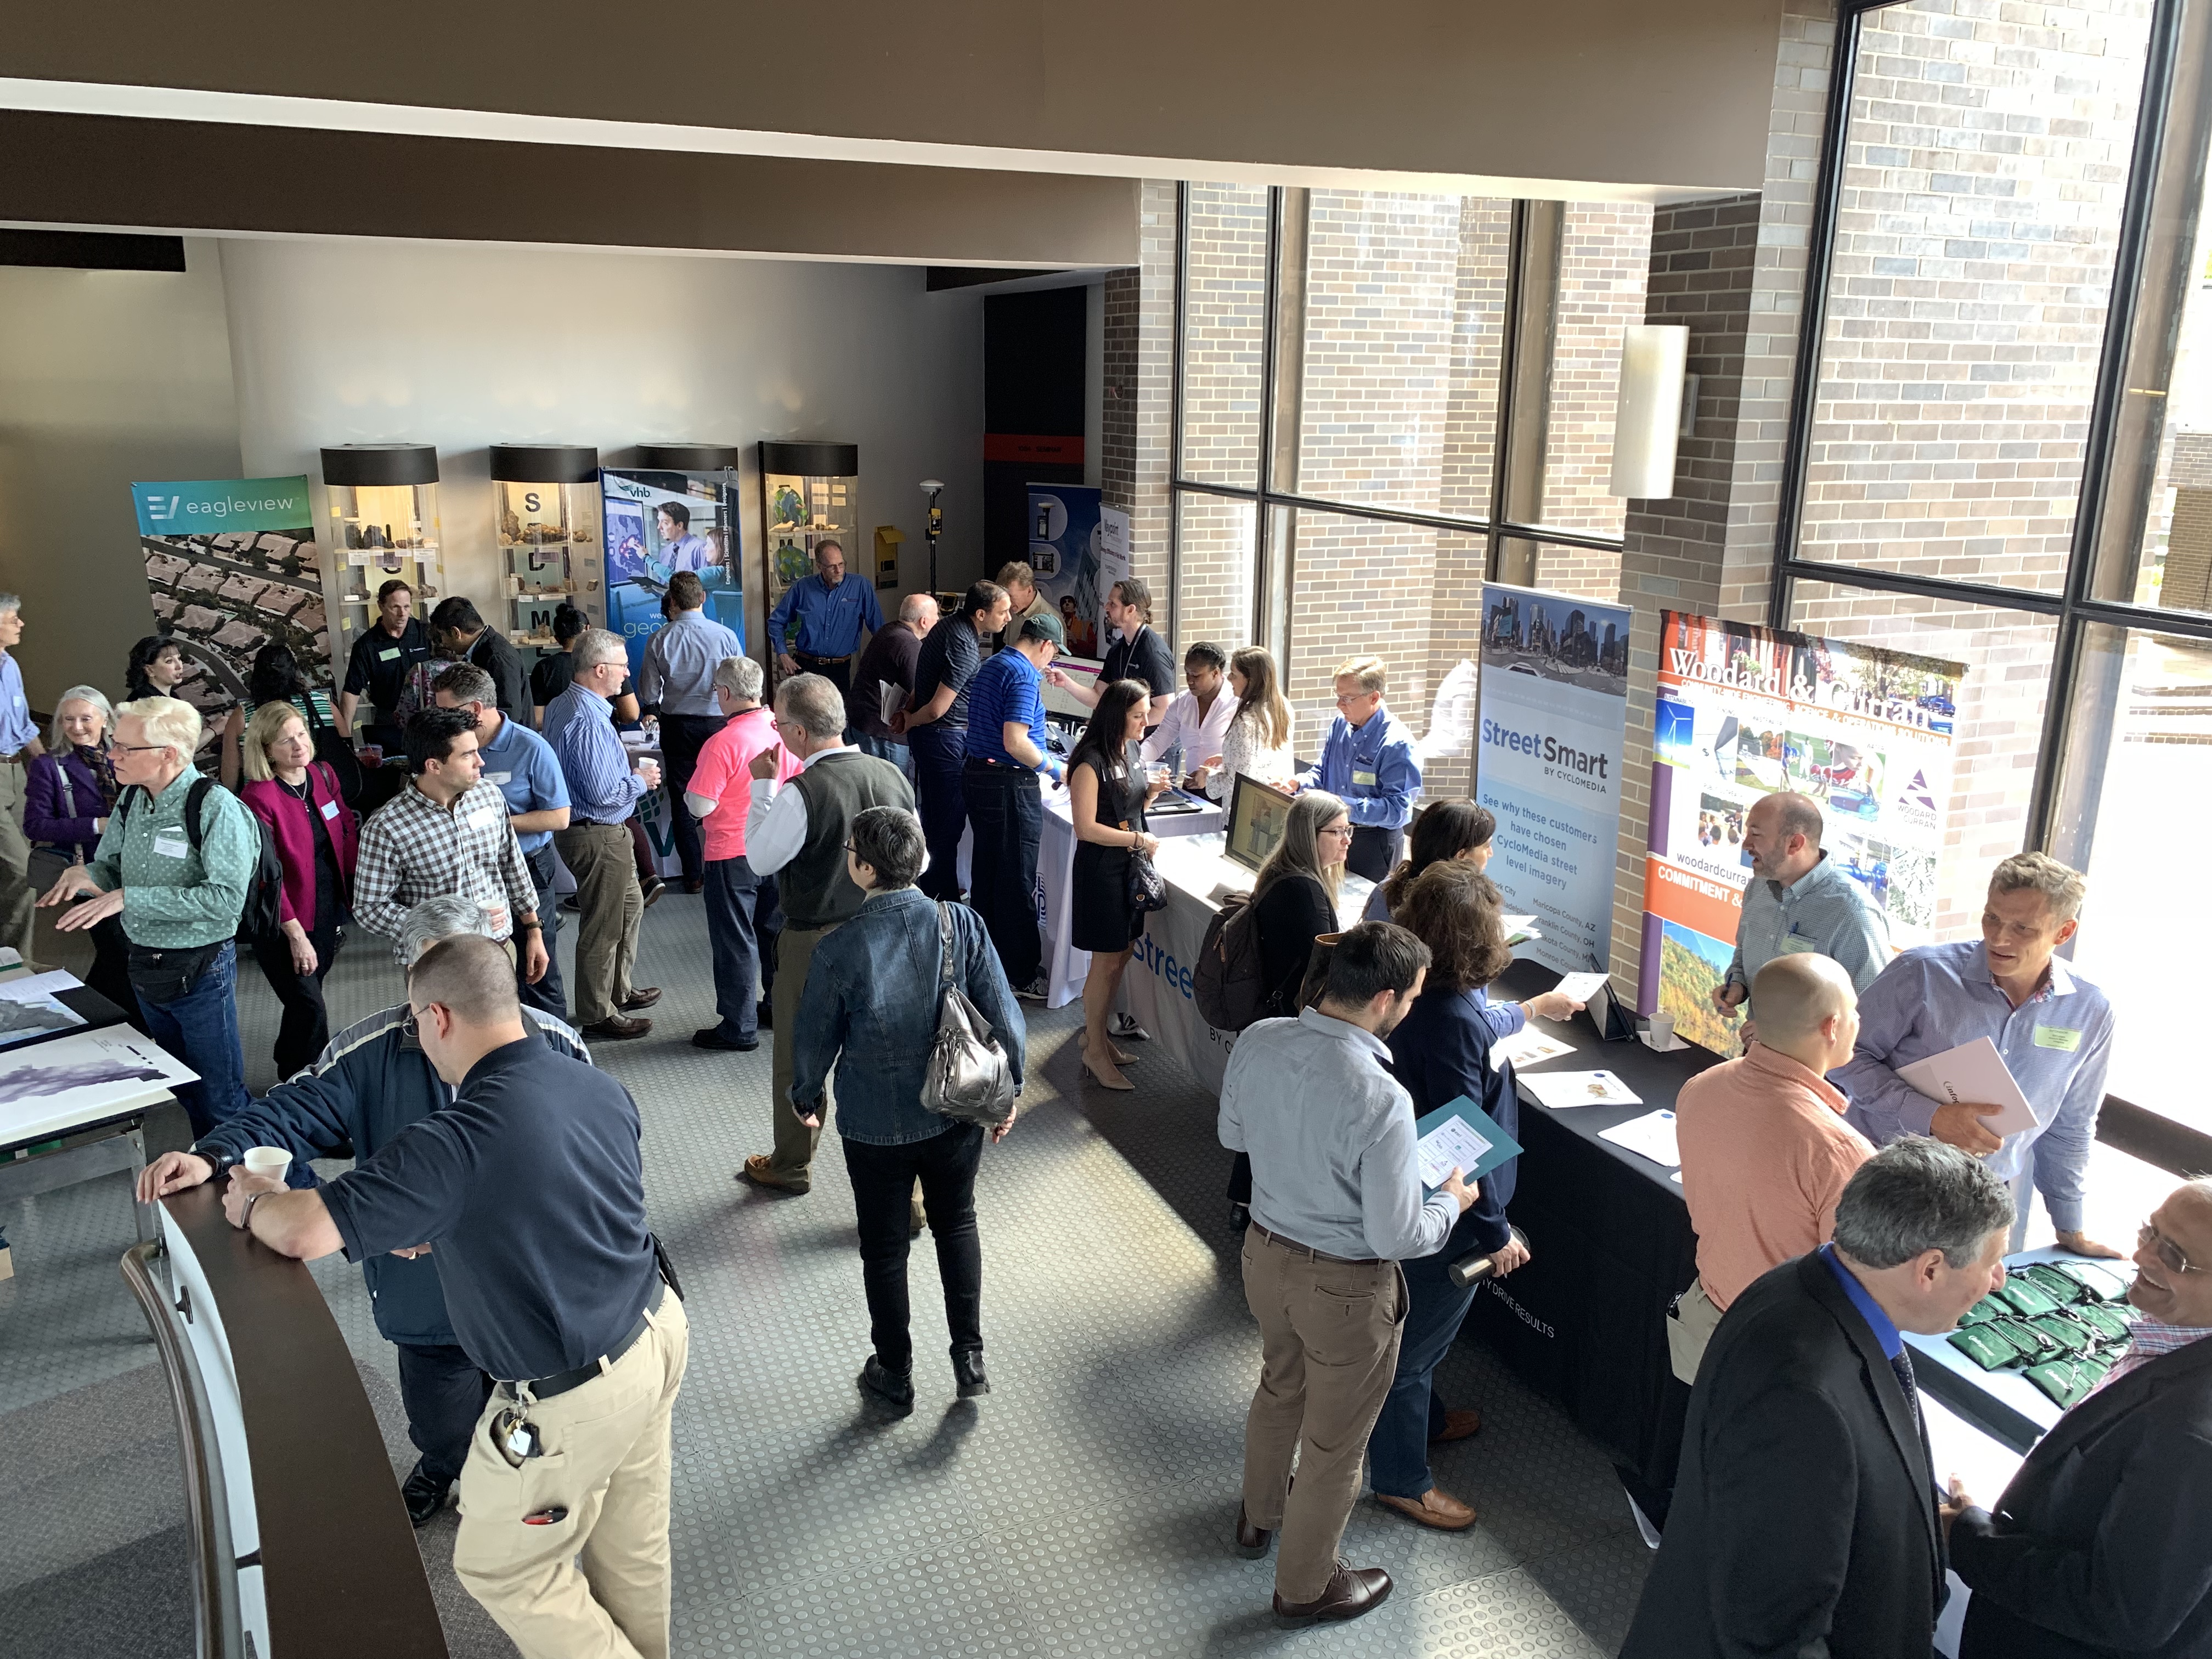
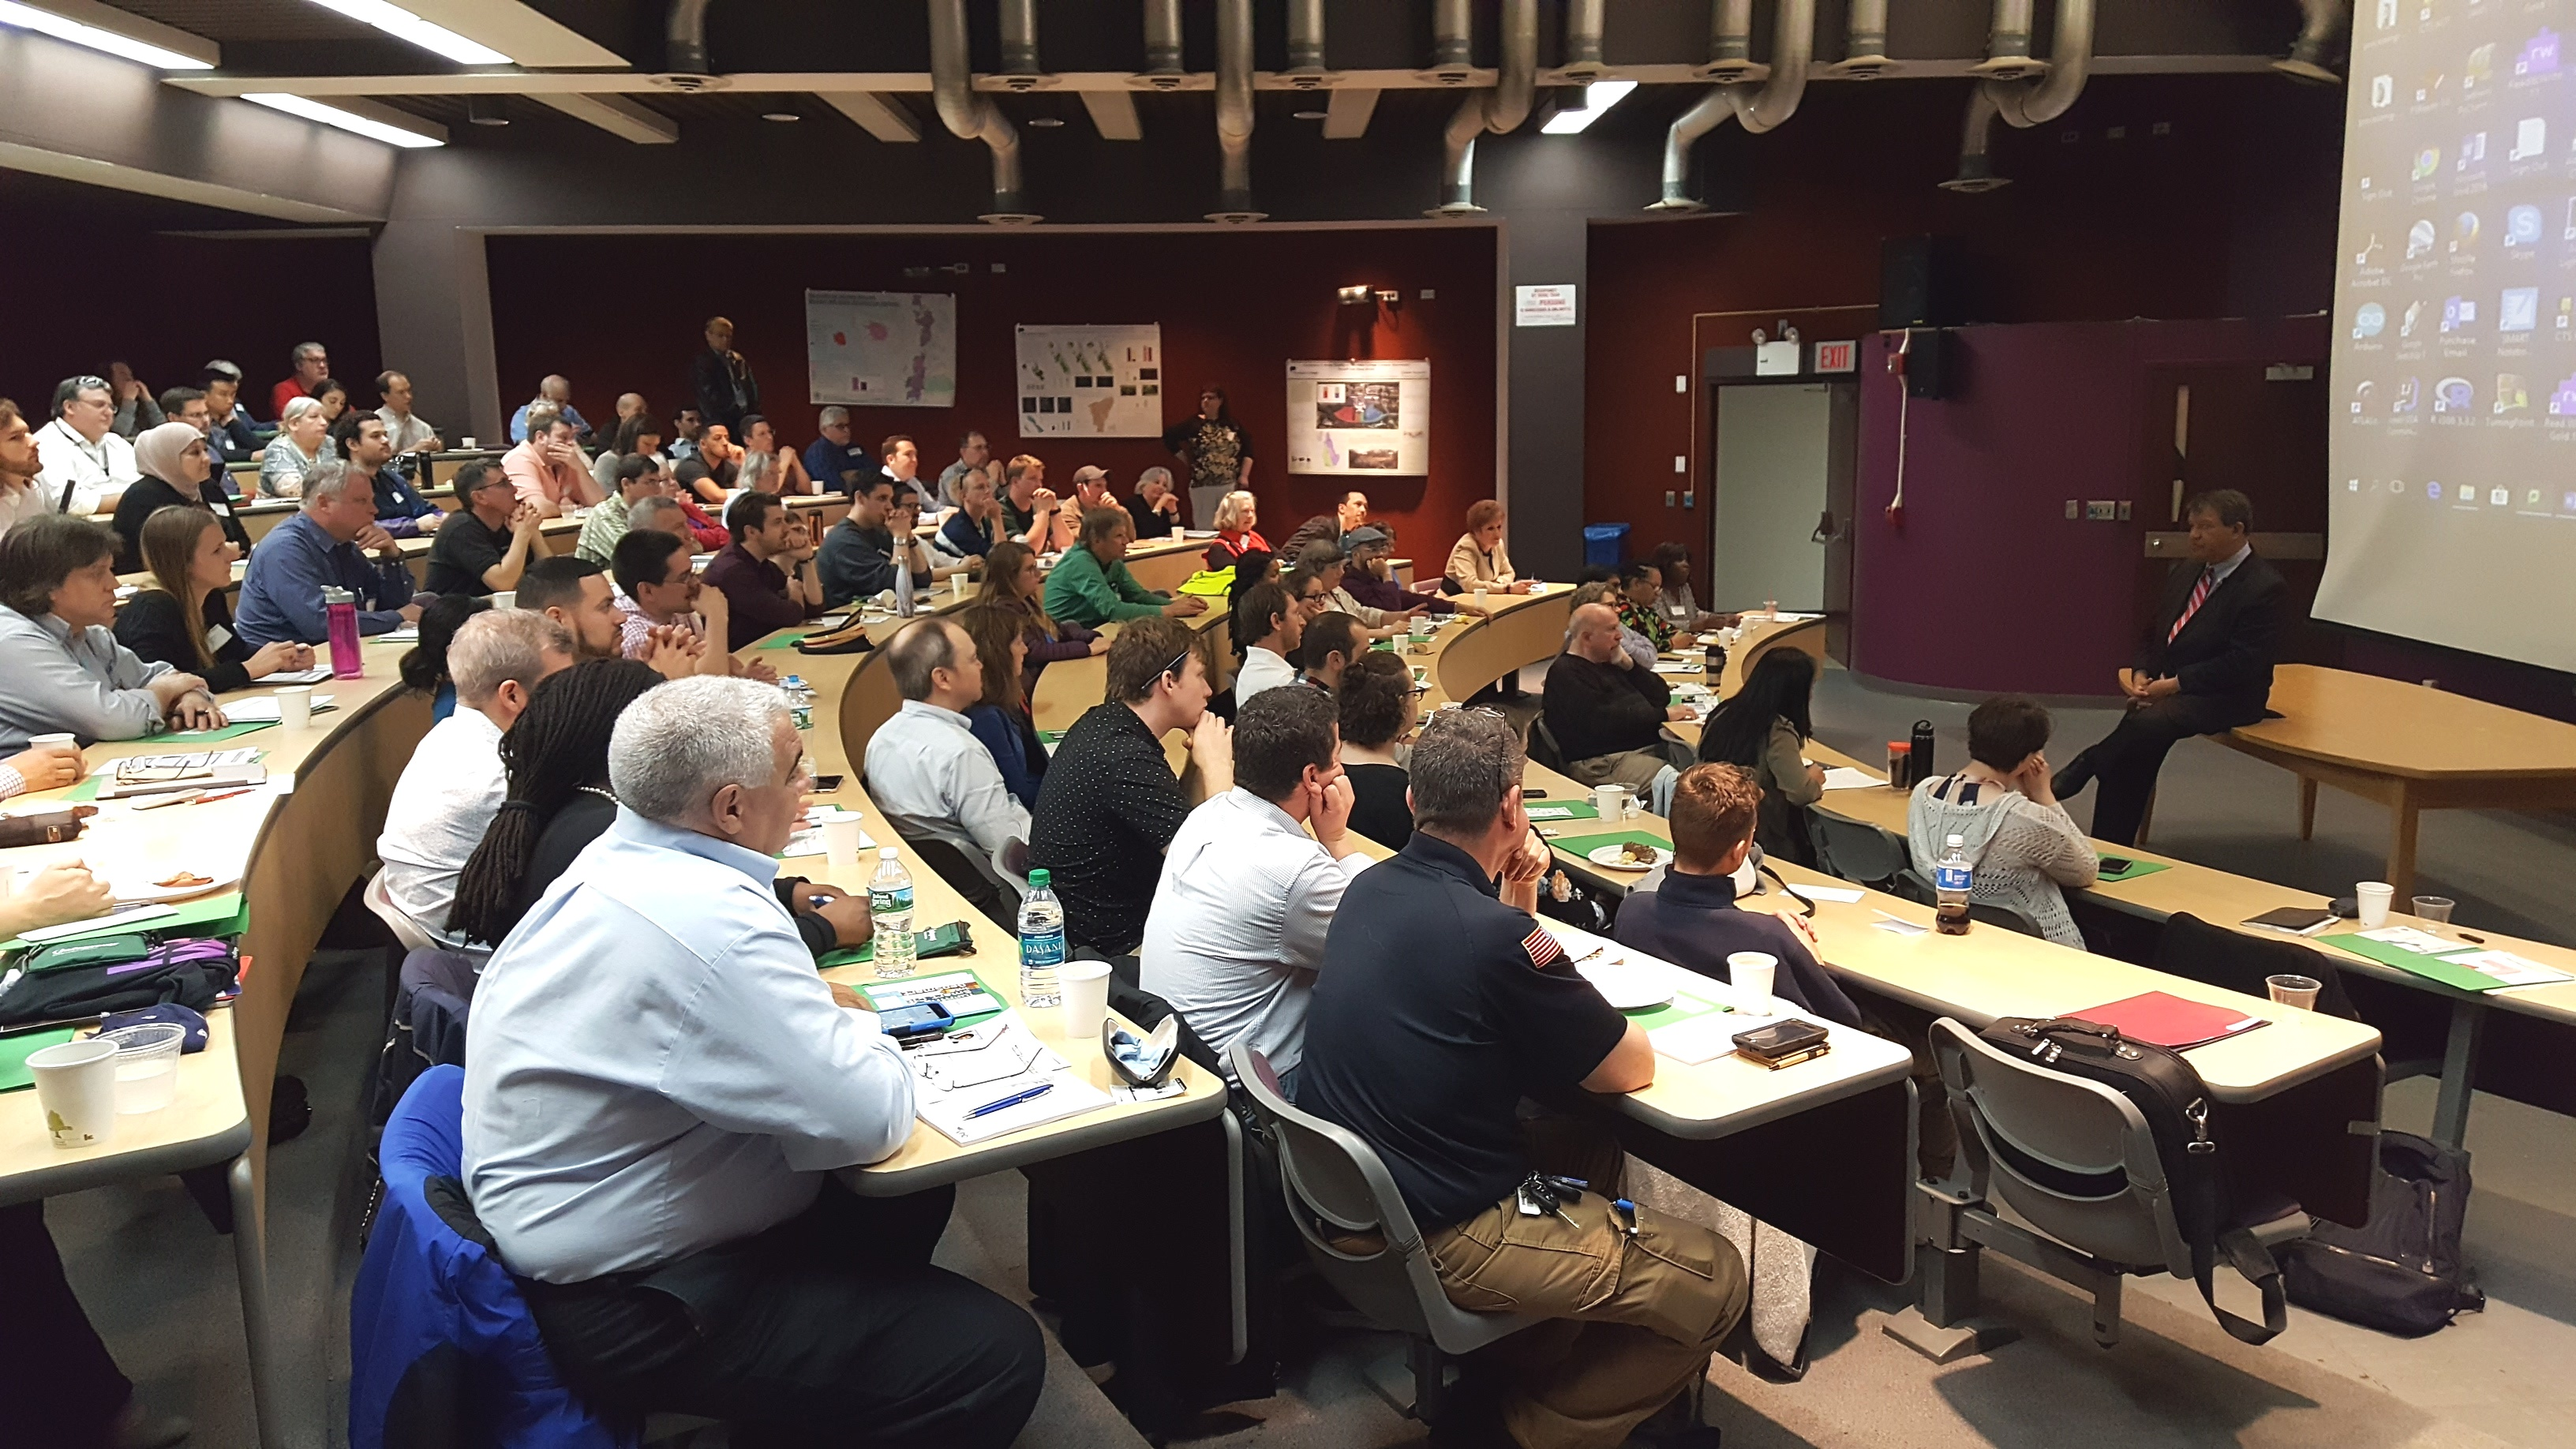
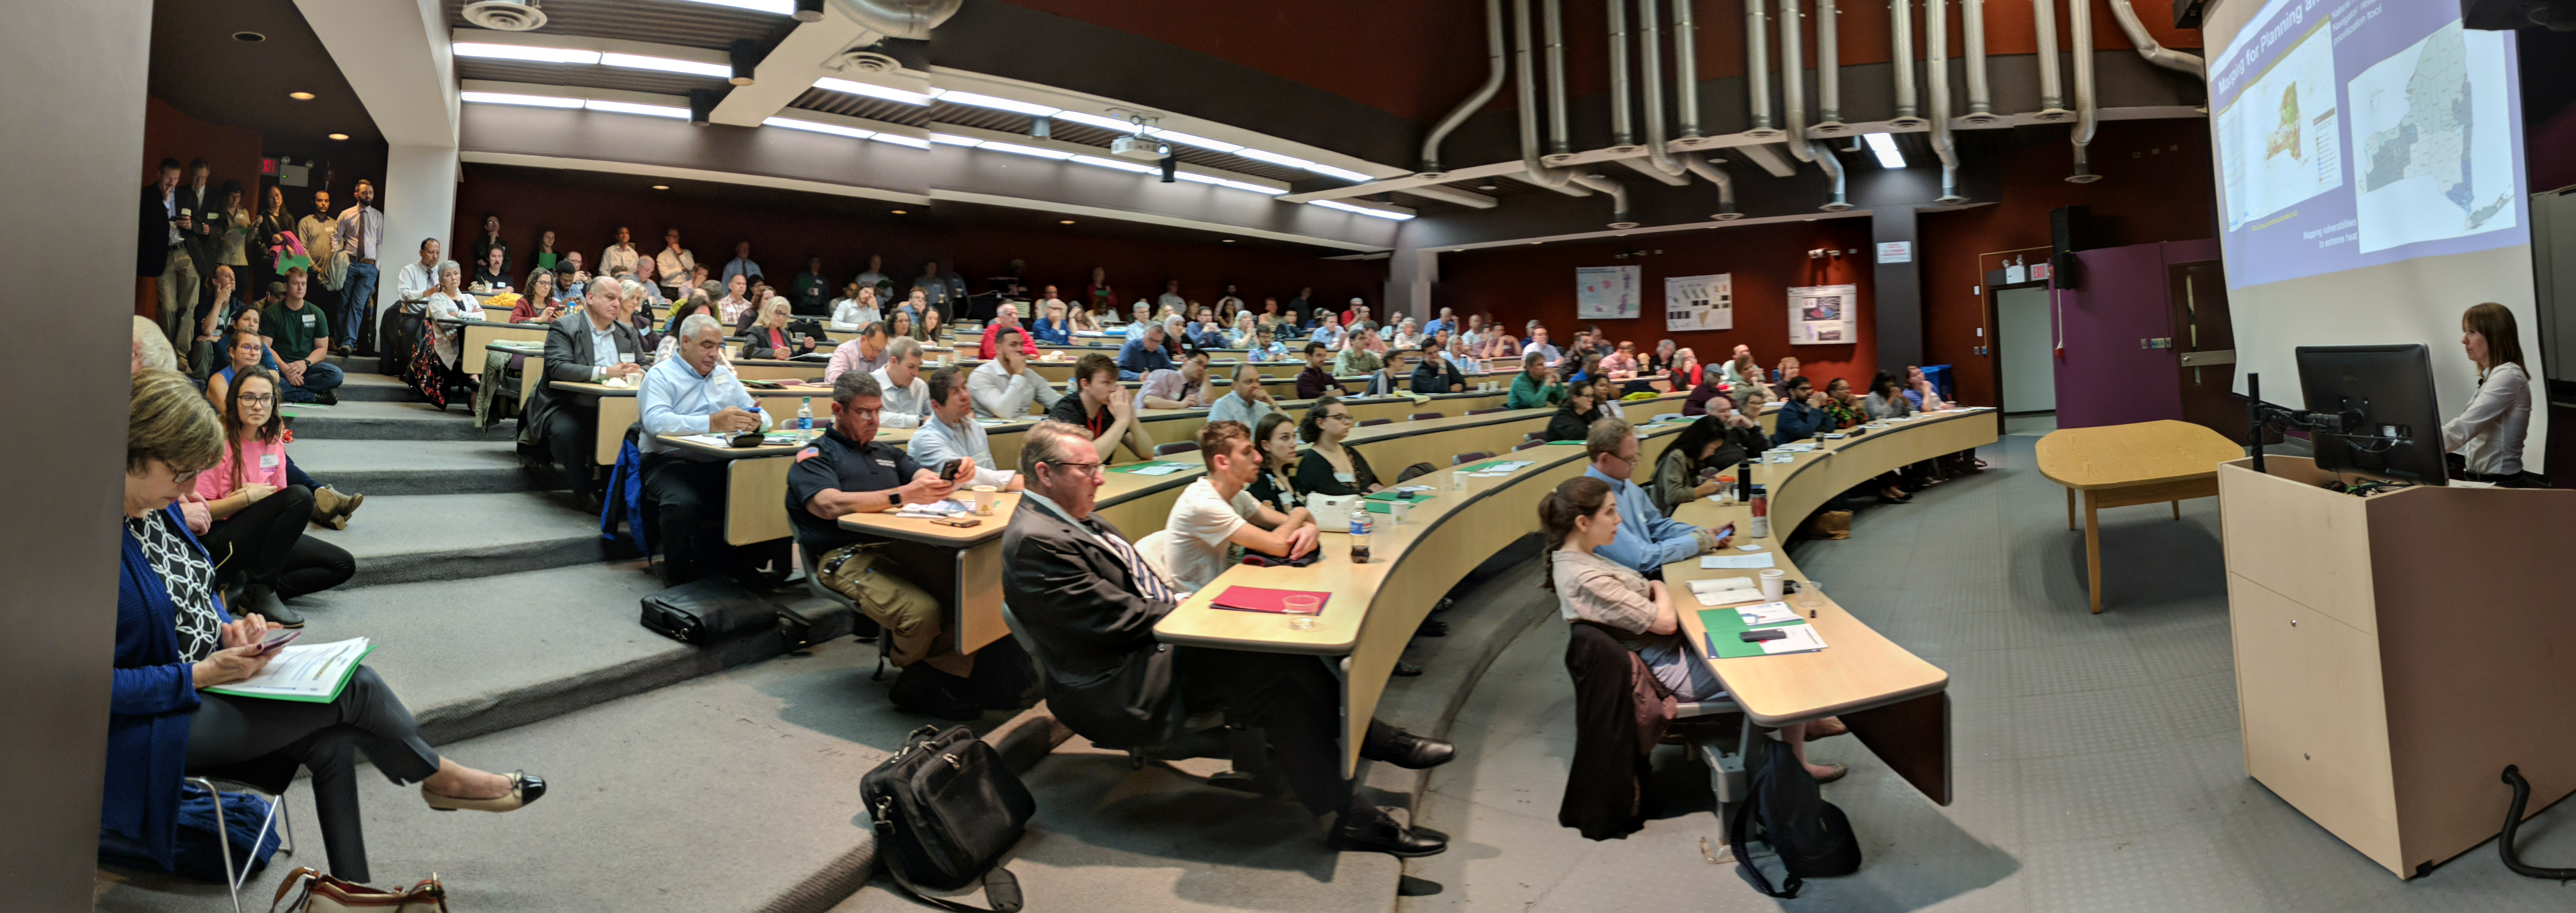
The governor’s announcement made me go back looking for my notes on the Systems and Technologies for Remote Sensing Applications Through Unmanned Aerial Systems (STRATUS) 2022 Conference held May  23-25 at SUNY ESF which I wanted to participate in and attend, but the scheduling didn’t work out.   The 2022 show was the fifth STATUS conference which brought together more than 100 professionals from across the United States and Canada.  New York’s geospatial community, including those from a host of academic institutions and local and state governments, was well represented in the nine technical sessions which included both oral and poster presentations covering topics including mapping and surveying, agriculture and forestry, flood and water quality monitoring efforts, hardware and software, and flights and operations. Great homegrown UAS research work coming out of Cornell, Rochester Institute of Technology, SUNY Binghamton, Hobart and William Smith College, and SUNY ESF.   One of the keynote speakers was Ken Stewart, Chief Executive Officer of NUAIR who I interviewed as part of a 10 Questions column last fall.  The STRATUS 2022 program guide, including abstracts and presentations can be found here

And for those coming out of college or those looking for a mid-career change – its a great job market.   If not a great job skill to augment any current geospatial position.    Commerical UAV News reports the top five drone pilot industry markets (in order) include:  mapping and modeling, thermal imaging, real estate photography and videography, inspections, and movies and television.  Another publication predicts that by the year 2025, at least 100,000 jobs will be created for drone pilots. (btw – while putting together this article, came across an update on New York State drone laws and regulations as of July 21, 2022).

Seemingly now present in every significant geospatial data collection effort at all levels of accuracy and need, drone usage will grow exponentially throughout government in the years ahead.  As governments continue to remain concerned over drone liability, privacy, and cybersecurity issues,  industry and consulting firms will continue to provide the bulk of drone and UAS operations.  This may change slowly over time, but the near future work will be supported largely by the non-government workforce.  One exception to this will be in the public safety arena where government staff will continue to be aggressively trained and licensed internally.   

In other areas it will be most likely specific drone consulting firms or engineering companies will step-in and provide drone/UAS services.  Many engineering companies have already  positioned themselves well in supporting government geospatial projects by building GIS capacity and offering a wide range of services skillsets – both on the desktop and in the field.  And drones are a perfect fit as part of their surveying and mapping consulting work particularly for smaller to mid-size governments with limited or no technical staff.      These same engineering firms now offering full service GIS programs including the managing of online products such as ArcGIS Online to data warehousing.  Particularly advantageous to local governments as datasets get larger and larger as the televising of infrastructure systems (sanitary, storm, potable water, etc), above ground 3D modeling, building information models (BIM), and high resolution imagery continue to be captured and developed in municipal governments.  Continued advancements by the major software companies such as ESRI and AutoCAD, and their business partners,  on the integration of drone generated data such as lidar only extends the ease of use and accessibility of drone/UAS technology for government organizations.

And with high accuracy mapping and surveying being one of the most common applications of drone/UAS use, particularly in context of the quality of imagery captured and increasingly larger geographic footprints of data being collected, might it lead to  the discussion as to how the emerging drone/UAS technology augments larger publicly – funded efforts such as the USGS 3D Elevation Program (3DEP)?  While the 3DEP program covers much larger geographic areas and is plane-based, is there a way to add smaller project areas which are drone/UAS  based and meeting appropriate federal lidar specifications to public data warehouses and inventories such as the U.S. Federal Mapping Coordination website?  Expand the State elevation library to include locally collected data?  There is so much elevation data being collected across the state by so many sources.

Summary

Government GIS/geospatial practitioners will do well to follow and participate in technology specific conferences and associations such as those represented at STRATUS 2022.  Many of which are becoming more accessible by being available online.   Industry specific conferences in engineering, public works, public safety – even agriculture – now serve as an excellent source of specific applied geospatial technology tools.  And drone/UAS technology is a common thread among them all. 

Coming to a geospatial application close to you soon. 

NYC H2O: Advocating Cleaner Water through StoryMaps

NYC-based nonprofit has developed extensive portfolio of educational products for all ages and settings

StoryMaps are such a great communication tool.  Turning geographic and location-based features and concepts into an easy-to-understand medium for the much broader audience which help identify key community resources, assets and experiences that can inform planning and policy-making.  By combining narrative text and other multimedia content with Geographic Information System (GIS) maps and data, story maps serve as an effective means of helping residents and developers visualize and understand projects with greater clarity.  Increasingly becoming an art form unto itself.  Broadly and increasingly used across the geospatial spectrum from the industry-leading ESRI StoryMaps platform  to say the least of the versions being offered by others in the geospatial space including Google Earth, CARTO, or Tableau

I’m sure its not the first time Story Map subject matter has found its way to be included in a more technical oriented conference, but I was nonetheless interested, if not surprised, to see a presentation by NYC H2O at the recent the September 9th New York City Watershed Science and Technical Conference.   A conference historically the home for geospatial-based technical and scientific presentations by engineers, biologists, and others in the water science disciplines, NYC H2O’s presentation was entitled Engaging an Urban Population With Water Engineering Utilizing a Virtual GIS Platform in the Pandemic Era”.

Having received its nonprofit 501(c)(3) designation in May, 2012, such work is not new to NYC H2O as it has built a niche in the environmental education space using the Story Map platform as its primary teaching and outreach tool. Story Maps augment and support their mission to “inspire and educate New Yorkers of all ages to learn about, enjoy and protect their city’s local water ecology.  Since 2009, NYC H2O has offered over 120 educational programs focused on NYC’s water system and ecology to a combined audience of 4,000 people.  Their StoryMaps often incorporate  digitized historic maps, photographs, videos, and social narratives to tell the story of waterrelated  infrastructure.

A couple of NYC H20’s StoryMaps in the water sciences and environmental space include:

Water Systems Overview

I’ve often heard the New York City aqueduct system referred to as the “eight wonder of the world”.   Maybe not as sexy and visible as the Great Pyramid but an incredible engineering marvel nonetheless.  Conceived, designed and built in another era to support the drinking water lifeline of the city

NYC receives 90% of its water from the Delaware and Catskill Watersheds. Aqueducts (red line work) transports the fresh water from a series of reservoirs in the Catskill Mountains over 100-miles from the city.

Fitting that the first StoryMap posted by NYC H2O on their “Hub” website is entitled  Water Systems Overview outlining and showing the many geographies of the system which originates in the Catskills Region.  An interactive StoryMap highlighting the major aqueduct systems (Catskill and Delaware – named for the watersheds where the water is collected), as well as the individual reservoirs both upstate and those in the city.  Household water consumption stats are also included in the StoryMap as well as several interactive learning activities as illustrated in the application toolbar below.  Included in the Site Specific Lessons is a StoryMap just for High Bridge and the Jerome Park Reservoir.

Sewer System and Stormwater Management

This StoryMap, focusing on the relationship between storm water and sanitary sewage, and its overall impact on water quality in the metropolitan region has lots more maps and associated data.

Beginning in 1850, NYC laid 70 miles of sewers, or underground pipes that carried away wastewater.   Today the city has over 7,400 miles of sewer pipes. These pipes move wastewater with the help of 95 pumping stations to 14 sewage treatment plants located in all five boroughs.  Each day, NYC wastewater treatment plants process, or “clean”, a total of 1.3 billion gallons of wastewater.   Produceing about 1,400 tons, or 60 truckloads, of biosolids!

The city maintains 14 sewage treatment plants covering the five boroughs. Treated sewage effluent is discharged into the Hudson and East Rivers and Long Island Sound.

About 60% of New York City’s sewer system is a combined sewer system. This means that one single pipe carries both stormwater runoff AND sewage from city buildings.  During heavy rainstorms, combined sewers systems receive more stormwater runoff and sewage. Wastewater Treatment plants have a capacity, or a limit, to how much water they can clean. When there is more water than the capacity, a mix of stormwater and untreated sewage empties directly into the City’s surrounding waterways. These wet weather events are called combined sewer overflows (CSOs).

The presence of combined sewers are still very prevalent in the metropolitan region with the majority emptying into the East River and the east side of the Hudson River.

Also central to the long term management of clean water – are government regulated programs entitled Municipal Separate Storm Sewer System (MS4) programs.  In populated areas many neighborhoods, including in New York city, as well as industrial areas along coasts, have deployed MS4 programs.  A MS4 has one set of pipes that transports sewage to sewage treatment plants and another set of pipes that transports stormwater directly to local waterways.   Unfortunately, many pollutants (like oil, trash, pet waste, pesticides, and fertilizers from lawns) are washed into this system when it rains. MS4 helps solve one problem (CSOs and sewage in the local waterways) but causes a similar, although smaller, problem since trash and pollution can still enter the local waterways when it rains.

Currently, only about 40% of the NYC footprint is covered by an MS4.

As it relates to the collection of data for the purposes of monitoring citywide water quality, this StoryMap also includes interesting map displays of both fecal coliform (1985-2017) and dissolved oxygen (1909-2017) testing.

Summary:

It’s nice to see as part of such advocacy efforts the use of open data sets and geographic content as made available by government agencies and data portals.  Much of which is included in many of the 21 StoryMaps listed on the NYC H2O HUB.

StoryMaps allowed us to keep students engaged in learning about their local water issues throughout the challenges of the pandemic. The tool has been so popular with schools that this year we launched a curriculum introducing GIS and StoryMaps to several environmental science and environmental justice in high school classrooms”, notes Kevin Barrett who guides NYC H2O’s mapping instruction.

With regard to the September 9th New York City Watershed Science and Technical Conference, Stalin Espinal, School Program Manager for NYC H2O adds “The conference gave us the opportunity to share our work and programs to a community of our peers. We were delighted to have received such enthusiasm and interest in our work with GIS and StoryMaps.  Even resulting in a new StoryMap collaboration in partnership with the Watershed Agriculture Council (WAC) which works with local farms on and around the upstate New York City watershed to promote Best-Practices and make improvements that help protect the water quality of our drinking water.”

Contact:

Kevin Barnett
GIS Education/Project Manager
kevin@nych2o.org
www.nych2o.org

Taking a Peek Under the Hood: New York State GIS Association

How’s Your Regional GIS Association Group Doing? Biden’s Infrastructure Plan. And Dude, What’s Up with Senate Bill S1466?

Its mud season in the Adirondacks so outdoor activities are kinda slow in the North Country.  Not much on the trails and the black flies loom.  Similarly is the blog content, scrounging around for new material and the like.  Couple articles in development hoping to pull together over the next couple months.  Some cool stuff coming out of NYC.  Seemed like a good time to pull together some topics and issues I’ve been staring at for a while.  Much of it related, for the most part, to the NYS GIS Association.

New York State GIS Association Regional Groups

The end of last fall I started a conversation with a GIS colleague who was responsible coordinating meetings for a local/regional GIS user group. An honorable task given the amount of time and effort which goes into doing so – often solo or with only one or two other folks.  Our conversation focused on a combination of declining attendance and participation throughout the region albeit at the time this may have been more of factor of COVID.  The play book almost the same everywhere:  virtually no in-person meetings, Zoom fatigue, and/or in general everyone completely pre-occupied with the pandemic.  All of this adding to the challenge of working with others to develop and propose meeting themes which would/could focus on something other than COVID.  And as we all know, much easier said than done over the past 16 months.

Curbing my own personal thoughts and opinions about where the profession is headed in this space across the Empire State – fodder for another article and another day – I put together a short 10-question Google forms questionnaire which was sent to the 15 regional coordinators listed on the Association’s Regional Coordination Committee web page.

Response rate was actually very good as I received responses from 14 of the 15 individuals I sent surveys to.  One of the 14 opted not to complete the survey leaving only one coordinator not responding.   Selected questions are listed below for which I’ve included summary results.   A spreadsheet containing all questions and and responses by all respondents can be downloaded here.  For the purposes of this article I removed the name of the Regional User Group so responses could not be linked to a specific person or group.

Taking a look at some of the questions and grouped responses:

1. When was the last time your Regional Group met?

2.  Was the last meeting in-person or online?

3.  Whether in-person or online, how many people participated in the last meeting?

4.  How many people are involved in helping coordinate and administer your user group activities (i.e., scheduling meetings and speakers, establishing agendas, maintaining email lists, maintaining any kind of user group website, etc) as of March 2021?

5.  Any thoughts as to whether or not your Regional User Group will go back to in-person meetings once the COVID pandemic has generally passed?

6.  Are any future Regional Group Meetings scheduled?

(Note:  During preparation of this article one Regional Group announced a Fall 2021 in-person meeting

7.   Is the membership of your User Group mainly composed of government workers or from private sector/industry?

8.  When User Group Meetings are held, do the topics and content of discussion focus on local/regional geospatial issues or more on statewide GIS issues?

Synopsis

Given the high percentage of the number of regional coordinators who responded to the survey (14 of 15; one responding to me but not completing the survey) the information gathered should be considered reflective of the current activities and engagement of the regional groups.  Admittedly the survey was really only 10 questions and completed during our time of  COVID, thus one could argue that some of the organizational issues which the Association is facing is similar to other organizations due to the pandemic.

That said, couple immediate takeaways on the pulse of the Association’s regional groups:

While the pie chart shows nearly 54% (7 of 13) of the groups haven’t met in over 12 months, overall its probably closer to 60% as I suspect the two groups which did not respond to the survey have not met during the same time period as well.  One of those for sure.  Sixty percent is significant.

Closely related is the question about whether or not coordinators anticipate getting back to “in-person” meetings after the pandemic has passed.  Seemingly more relevant, however, was the issue of “re-energizing” the group first (61% or 8 of 13 responding).  My guess it’s safe to assume the other two survey non-respondents are in the same space or mindset – and the percentage goes to a whopping 66% – 10 of 15.  75% of those responding indicated the next meeting wasn’t even planned and again, if you throw in the non-respondents to this questions it goes to over 80%.

A noticeable feeling of malaise?  Seems like enough to give the Regional Coordination Committee Co-Chairs something to think about.

Findings to other questions which included, for the most part, anticipated results such as:

  • Meetings taking place (independent of how long ago) were about half in-person and half-online)
  • Numbers of people participating in meetings (in-person or online)
  • As we all have painfully come to know, normally a handful of people (in many cases only 1-2) individuals coordinating the group and meetings
  • Probably didn’t ask the question properly, but nonetheless it appears the groups are split about 50-50 on private/industry sector vs. government individuals; and
  • Meeting agendas/discussion tends to focus about 50-50 on local/regional issues vs. statewide issues

Biden’s Infrastructure Bill

I included the question about meeting content (local level vs. state level) to get a sense of the discussion as to who/what may be directing the narrative.  Why, you say?  How about Biden’s $2.3B Infrastructure Plan.  Rarely has so much federal money been allocated which links itself to local and regional GIS programs.  Roads, buildings and utilities, bridges, public transit, water and sewer systems, disaster resiliency, public schools, and much much more.  Large amounts of geographic features and systems best managed at the local level.  And with local resources.  If not local and regional governments themselves then with trusted consultants and business partners.  Engineering consultants with broad and capable geospatial capacity.

Yes, the time for local and regional geospatial programs to proactively and reach out to state organizations such as the NYS Association of Towns, NYS Association of Counties, ot NYS Conference of Mayors to work towards making sure this new funding sources are secured for local use and application in the geospatial space..  As well as enhancing collaborations and efforts with professional organizations such as the New York State Society of Professional Engineers and New York State Association of Professional Land Surveyors which have an established presence in Albany.

Of course state assets are in play with regard to this funding, but local and regional geospatial programs, in May 2021, cannot afford to sit on the sidelines to wait and later find out distribution of this new federal funding is going to state programs first and being left to fight for the remaining scraps. And/or left to some funding distribution formula which included no local and regional geospatial programs input.

Time now for local and regional GIS/geospatial programs and organizations to mobilize on this funding opportunity.

Senate Bill S1466

Hello, McFly? Anybody home?  Anybody watching and monitoring anything with regard to the state legislature and legislation which is connected  to the Empire State geospatial space?  In the big scheme of things, S1466 probably doesn’t amount to much but it does seem something is amiss in the broader context when the words Geographic Information Systems Mapping Technology are used in describing any proposed New York statewide legislation and it goes completely under the radar screen without review and input from the statewide geospatial community. Can’t say absolutely no discussion because something, on some level, some people, somewhere, were talking and exchanging information to frame the legislation.  Was the Association part of that discussion?  Or maybe your Geospatial Advisory Committee?

And a bigger head scratcher is connecting the state GIS office with “strategic planning and municipal study assistance”.   Specifically the proposed legislation reads, in part:

“The usage of available floor space within a given political subdivision
is a critical detail. Evaluation of floor space usage allows the local
area to understand how buildings are being used, and evaluate whether
new zoning or construction plans are needed to stimulate activity in
certain sectors. However, conducting a study through questionnaires and
or geographic information mapping (GIS) technology is difficult and
costly for local entities. On the other hand, the Office of Information
Technology Services already maintains statewide GIS information and can
readily adapt that material for more specific purposes.”

This legislation would allow towns, villages, cities, and counties to
request GIS and study assistance from OITS to undertake a review of
floor space usage. Such assistance could include specific GIS maps,
online questionnaires, and other technological methods that would assist
the conducting of such studies.

Maybe I need to get out more.  Granted, if passed, the whole process of ITS of getting involved presumably wouldn’t happen unless requested locally, though it is interesting to see this office ready to provide these professional services.  Also, interesting it hasn’t ruffled a few feathers in the professional planning and GIS consultant communities as well.  NYS Association of Regional Councils?

Almost two years ago I made reference to a similar geospatial community asleep at the wheel legislative moment with regard to Senate Bill 9061 involving Google Maps.  Have there been similar pieces of legislation?  In absence of full-time staff – including an Executive Director who can operate in the Albany space – its almost an impossible task on staying on top of pending legislation proposed by others.  To say the least of identifying sponsors and proposing legislation for the benefit of the industry and membership.

One way or another, the legislative space is where the Association needs to expand and build capacity.   Thus far it hasn’t been easy and will continue to be difficult to do so.


2019 Westchester GIS User Group Meeting

Making it the largest annual event to date, nearly 200 individuals attended the 2019 Westchester GIS User Group Meeting May 16th at Purchase College. The annual event included a diverse mixture of user presentations and demonstrations for attendees representing local and county government, utilities, nonprofits,  business and industry, and academia (both college and high school programs). Faculty and facility support from the College’s Environmental Studies program and sponsorship from twelve vendors again helped enable the Westchester County GIS community to meet and discuss the countywide geospatial agenda.  And by virtue of the venue, promoting SUNY GIS educational opportunities as well.   It was a great GIS day for all attending and participating.

As the day progressed, nearly 200 registrants assembled as part of the 2019 Westchester GIS User Group Meeting at Purchase College. The main lecture auditorium was filled to capacity with standing room only by mid-morning.

2019 Agenda and Speakers

While the 2018 agenda had a specific theme, this year’s agenda was intended to be more diverse covering a wide range of topics including health and human services, pavement management systems, oblique imagery applications, training workshops, forestry inventories, public safety, mapping and visualizing the human brain, the 2020 Census, and a special presentation by ESRI focusing on accessing the County’s new planimetric datasets via web services.

Session I:  Allison McSpedon and Jeff Worden from the Westchester County Continuum of Care Partnership for the Homeless led the day off with a presentation focusing on the use of mobile technology as part of the annual Homeless Point in Time (PIT) Count taken in January 2019.  This was followed by Nancy Birnbaum, Manager of Software Architecture, Westchester County Dept. of Information Technology who presented the new Westchester County Online Community Mental Health Directory.

Managers from the Continuum of Care Partnership for the Homeless detailed the pros and cons on the use of mobile data collection technology as part of the January 2019 count. They anticipate even better results and ease of use when deployed in the next count.

Andrew Reinmann, Advanced Science Research Center, Graduate Center of CUNY and Department of Geography, Hunter College followed with the use of geospatial tools as part of the Westchester County Forestry Inventory: Mapping and Ecosystem Services Assessment.  The morning session ended with a series of lightning talks highlighting the use of the County’s new oblique imagery.

Session II: After intermission, VHB and staff from Westchester County Dept. of Public Works and Transportation discussed the new Smart Asset Management and Inventory System (SAMIS) application which was followed by an excellent demonstration on the use of Laser Scanning technology by the Westchester County Police Forensic Investigations Unit.  Patrick Gahagan, Technical Analyst at ESRI finished the morning session discussing advancements in civil engineering and surveying integration between the Autodesk and ESRI platforms.

Detectives from the County Police Forensic Unit captivated the audience on the use of laser scanning in crime scene investigations. GIS staff is now working with the Forensic Unit on integrating laser scanning data into the enterprise GIS environment.

Session III:  After lunch – and an audience participation session of GeoJeopardy – Jonathan A. N. Fisher, Ph.D., Director of the nearby Neurosensory Engineering Lab at the  New York Medical College in Valhalla provided an overview of his project called Neurodome which centers on the mapping of the human brain with an assortment of technology and visualization tools.   Daniel Wickens, Solution Engineer from ESRI then gave two overviews on “What’s New with ArcGIS Field Apps and ArcGIS Online.”  Concurrently in separate locations training classes were offered on how to use the new online CONNECTExplorer oblique imagery viewer and the ESRI “Explore Future Climate Change” tutorial.

Session IV:  The last section of the agenda was brief and included an update on mapping efforts association with the 2020 Census by Margaret Baker, Geographer, from the U.S. Census Bureau Manhattan office.  The final presentation by Westchester County GIS staff included the latest developments and anticipated upgrades to the Westchester County GIS website including the scheduled launch of the Westchester GIS Geospatial Gateway

Individual meeting presentations can be accessed and downloaded using this link.

The U.S. Census Bureau is ramping up for the 2020 Census and has a variety of mapping and geospatial products in their toolbox. GIS technology is essential in helping identify areas which have had low counts and responses.

Little Things Make it Work

I’ve written before about the small details which we believe enable the Annual Westchester GIS User Group Meeting to continue to be successful – and we’re the first to admit there is always the element of luck.  Even the weather matters.  To the extent possible, elements such as keeping the content and speakers “Westchester” focused, minimal –  if any –  registration fees, lots of time for interaction with the sponsors on the exhibit floor, and the centrally located venue at Purchase College – all matter. One of the ironies, and downsides, of having the show on a college campus in mid-to-late May is that spring semester is already over and students have fled campus.  However,  there is normally a handful attending looking for summer or full-time work and passing out resumes.    The naturally lighted vendor area in the Natural Sciences Building, albeit small, adds to the personal “feel” of the show.    Easy access and plenty of parking is also essential.  And don’t forget lots of proactive outreach to the professional organizations and societies  we work with on a day-to-day basis:  police/fire, engineering, surveying, public works, assessors, nonprofits, and the planning community.   The added message here is to encourage consultants which are supporting local governments across the county – to attend the meeting.  To learn more about accessing and leveraging Westchester County GIS products and services and how this improves service and cost efficiencies to municipalities they serve.   Individually, any of these items listed above may seem trivial,  but they all add up in delivering a show that will bring the same people back next year.

The exhibit floor was busy (and loud!) during breaks with all vendors noting interaction with attendees was good and productive. All attendees can complete a Vendor Bingo Card and be eligible for a raffle prize at the end of the day. This year’s prize was a vendor donated iPad!

Summary

Over the next couple weeks, conference organizers will be sending out a survey to both attendees and vendors to gather more detailed information on the various elements (presentations, speakers, refreshments/breaks, vendor interaction/feedback, facility issues and the like) of the show.  This information will help guide decisions about content and any changes that may need to be made, if any, about the structure of the show.

Staff will take a few months off and begin planning for the 2020 show in the fall of this year.  In doing so, we look forward to the continued relevance and position of the Westchester GIS User Group Meeting in promoting countywide geospatial development and use.

2018 Westchester GIS User Group Meeting

Westchester County GIS has been fortunate to build a broad and diverse community of GIS users and followers over the past two plus decades which is embodied at the our annual GIS User Group Meeting each May.  Similar to many first generation GIS government programs which were created in the late 1980s/early 1990s, most of the first decade worth of geospatial programs and applications Westchester County GIS developed were government focused.  But as geospatial technology grew at warp speed in industry and business and combining the development and availability of a high accuracy countywide Westchester County digital base map,  the visibility of the program quickly expanded.  Interest from public safety, nonprofit, academic and civic groups soon followed.   And not to minimize the importance of the continued political support the program has maintained over the past two decades at both the county and municipal level.   Illustrative of this year’s May 17th meeting held at Purchase College, nearly 170 representatives from  government, industry and business, utilities, academia, nonprofits,  community groups, and the military convened for the sharing of presentations, geospatial solutions, and best practices to move the countywide and regional geospatial agenda forward.

2018 Agenda

In years past there had always been an effort to keep the presentations and agenda diverse – a little bit of everything.   While this has generally served us well over the years, this was the first year we had a specific theme:  GIS for Resiliency and Sustainability.   This was in response to recent work our GIS program had completed in context of investigating potential impacts of projected sea level rise on county-owned assets as well as administrative changes in the Westchester County Executive  office as a result of the November 2017 elections.  In the process of bringing these two issues together and including the Office of Sustainability at Purchase College, we were able to add Westchester County Executive George Latimer and Purchase College President Thomas Schwarz to our agenda.  Both mentioned and acknowledged the importance and relevance of technology and geospatial in supporting the regional sustainability agenda.

Westchester County Executive George Latimer talking with 2018 User Group meeting attendees. He made reference to the use of geospatial technologies in confronting Climate Change issues.

2018 Speakers

Working with the theme of GIS for Resiliency and Sustainability, we were able to include two well recognized state government speakers in Mark Lowery, Climate Change Analyst with New York State Department of Environmental Conservation, and Amanda Stevens, Project Manager with New York State Energy Research and Development Authority (NYSERDA) Environmental Research Program.  With the County’s work in this space increasingly including nonprofit groups, representatives from both  Abundant Efficiency and the Westchester Community Foundation were also on the agenda.  In the mix were talks by SUEZ North American (water utility) and BetaNYC – an open data advocacy organization based in New York Ctiy.   Additionally, we continued to feature our ongoing relationship with the U.S. Military Academy at West Point with a noon presentation by Lieutenant Colonel Jared Ware.  Our afternoon session of Lightning Talks and panel discussion featured Sustainable Westchester and representatives from five local governments.

In the morning session, Amanda Stevens provides an overview on NYSERDA’s work and research efforts in the area of climate change – which includes programs in the Lower Hudson River region

Bringing it Together

Admittedly there is always a little luck in hosting conferences such as this and it only takes a day of bad weather for attendance to bottom out (been there).  Of course, nothing beats an agenda based on current and cutting-edge geospatial topics backed with recognized speakers, but there are a couple other factors worth noting that seem to help make all of this work for us, including the following:

All Things Local:    For all the benefits and advantages of the larger shows, localizing the day’s content and message for local/regional like-minded individuals goes a long way.  Geospatial business needs and problems – and often the solutions – are conceptually very similar.  Familiar faces with familiar issues.  The organic approach.

Affordability:   Offering such events at a discount, like free as in our model, makes the event more attractive to more people.   However,  if its free, it is easy to not show.  Nothing paid nothing lost. And we have the historical numbers to show as such.  Over the past six-seven years we’ve seen a 25%-30% no show rate from the actual number of pre-conference registration numbers.    That said, we’ve learned to factor this variable in the printing of conference materials and sizing break refreshments and lunch.  We’ve also learned over the years that other groups and professional societies we’ve tried to partner with in hosting the show may be hesitant to collaborate because they (other organizations) do not want to send a message to their memberships that meetings, and certainly ones that offer Professional Development Units (PDU), are available for free. The bottom line for us is that we continue to make the show free based on vendor fees and affordable food services from the venue location.  And besides, there is no capacity to collect money online and/or to deal with bank accounts.  What little money management needs we have are handled graciously through the college.  Getting pass the bouncer at the door for free works for us.

Vendor Interaction:  I can’t say enough about how important this is.  We put a lot effort into making sure our sponsors have ample time for interaction with the attendees. Information gathered by attendees in the exhibitor area only adds to the overall value of their day.  Food and refreshments are close by so everything (and everybody) is in reaching distance of the vendors.  We also have vendor “Vendor Bingo Card” game that encourages attendees to visit each vendor table to qualify for a prize drawing.  Pretty nice incentive as this year the prize was a vendor donated iPad.   All sponsoring vendors are entitled to 5-minute “Vendor Spotlight” presentation over the course of the day.  Without vendor support the day doesn’t happen so we make it worth their while.


Everything is nearby at the Westchester GIS User Group Meeting. Vendors, refreshments, and the main auditorium are all intertwined and close. Making the experience interactive and personal on many levels. It’s a win-win for everyone in attendance. Who are those folks in pink?

The Venue:   For the past seven years, Purchase College has graciously made their facilities available to us to host the show.  Prior to that we bounced around the County at other locations, but given our relationship with the faculty in the Environmental Studies Program this became a logical spot. Centrally located in mid-Westchester.  Easy access.

A naturally lighted vendor area, albeit small, adds to the personal “feel” of the show.  One of the main reasons we originally went to Purchase during the third week in May was that the Student Union cafeteria was still open we could make lunch “on your own”.  Avoiding all the overhead and cost of providing lunch.  We’ve since been able to work with campus caterers to provide us with an affordable lunch menu which is vendor sponsored.   This “grab lunch and go” format enables users to eat where and how they want –  attending special lunch time presentations, continued discussions with vendors, or simply going outside to eat on the campus plaza.  The entire agenda is plenary format held in a cathedral style 150-seat auditorium.    We once tried a concurrent sessions format but it just didn’t work and feel right so we went back to the basics.  Post-meeting training sessions have proven to be hit or miss.  Just seems that just come 3PM after a long day of presentations, networking, and interacting with vendors, most folks are running to the exits.  Or the no-host reception down the street.

One of the ironies – and downsides – of having the show on a college campus in mid-to-late May is that spring semester is already over and students have fled campus, though  there is normally a handful attending looking for summer or full-time work and passing out resumes.    But we clearly do not have the college student attendance that is seen at comparable conferences such as GIS-SIG.

Engage the Professions:  We make a significant outreach to the “aligned” professions including engineering, public works, surveying, police and fire departments, government administrators, the planning community and increasingly nonprofits.  I wish there was an easier entry point into the 41 school districts here in Westchester County – and particularly their uber large budget bus transportation systems – but we’ve never been able to find it.     We  focus our efforts to reach the professions with individuals and technical staff that use geospatial technology.  Day-to-day work flows that has geospatial intertwined –  but is not the only focus of their business day.  Truth be told, there simply aren’t a lot of individuals locally who only do GIS work during the course of their business day.  The carrot that we offer across the board – and the common denominator – is the geospatial content we publish from our program via our data warehouse or map services.

Summary

Declining government budgets and  travel restrictions positions the Annual Westchester GIS User Group meeting as the primarily, if not only, major GIS event many of our government attendees get to each year.   It enables us to craft a geospatial message in context of local needs and applications as illustrated in this year’s theme “GIS for Resiliency and Sustainability”.  And keeping in mind the importance of their support, the event provides a great framework for industry and business to showcase their product and services.  And none of it possible without the support of the great folks at Purchase College.

Cognizant of the many differences and capabilities within the regional GIS communities,  it is often difficult to host such events on a reoccurring basis.  Perhaps some of the elements of our event can be used in helping build capacity for creating similar events for other regional GIS user communities across the Empire State.


Views on the 2018 New York State Geospatial Landscape

There’s probably enough below for a couple blog posts but I ended up throwing everything in together and stirring it up – so to speak.  The language on Part 189 (tax mapping) could be a post by itself.  Kind of all over the place, even revisiting some topics I’ve touched on before as part of eSpatiallyNewYork.  Part wish list and part commentary.  Ten items. More or less.

  1. Promoting NYS Local and Regional Government GIS Development:  This is a frequent mantra of mine and with the  constant advancements in computing and geospatial technologies it’s worth considering on a regular basis.   And most certainly as part of this year’s wish list. Opportunities abound across the Empire State to help local and regional governments  jumpstart and/or solidify their GIS program.   For example, funding is available through the NYS Environmental Facilities Corporation focusing on infrastructure systems much of which is managed at the local level.  Or the large amounts of funding being made available as part of Zombie Remediation and Prevention Initiative through the NYS Office of the Attorney Genera  And the detailed inter-government discussions on the new Shared Services Initiative  which includes funding as part of the adopted FY2018 state budget.  GIS is the shared services technology. And regional GIS programs as part of the New York State Regional Economic Development Councils or by extension the New York State Economic Development Council?   GIS tools are at the foundation of economic development.   Not perfect fits,  but funding opportunities do exist in these program areas.

At the core of local and regional GIS programs is powerful server technology (local and hosted) that not only has the capabilities to support multi-government day-to-day business functions  but also provides the framework to publish geospatial content via map services.  Call it what you want Open Data, government transparency, or data sharing  but it is within this context that state agencies, nonprofits, academia, as well as  business and industry all have access to local data.  Let’s have 2018 statewide focused discussions on extending local and regional GIS capacity based on cost effective and server-based multi-government initiatives.

  1. Building GIS Association Legislative Capacity: While the Association has grown in so many positive ways over the past decade, the challenge continues for the organization to have its presence and mission heard in Albany’s governing hallways.  It is no small effort – organizationally and financially  to build this capacity.  Many similar professional organizations have full-time staff and Executive Directors whose job is to create awareness among elected officials, secure funding, and promote/influence legislation on behalf of the membership.    But currently the Association’s legislative efforts are in the hands of member volunteers.  And while Legislative Committee volunteers were able to coordinate a “Map Day” last May in Albany to introduce the Association to elected officials, the Association has yet to establish itself on the same playing field of recognition with other statewide geospatial heavyweights such as the New York State Society of Professional Engineering, New York State E911 Coordinators, and the lobbying efforts of large New York State based geospatial businesses.  Complicating the equation are Association members who hold licenses or certifications in other professions (i.e, engineering, surveying, photogrammetry, landscape architecture, AICP,  etc) and find themselves in a quandary as to support the Association’s agenda or the profession/discipline which holds their license.  To some degree, this issue manifest itself as part of the discussion with the Geospatial Data Act of 2017 which initially had lines of support drawn heavily along professional affiliation.  The Association must keep up the good effort and find a way to compete on the Albany stage.  Let’s hope the Legislative Committee can build upon its 2017 accomplishments and make further inroads in 2018.
  1. New York State Geospatial Data Act of 2018:   Not really,  but it DOES sounds great – right?   Close our eyes and make believe there is a state-equivalent of the much hyped (Albany) federal National Geospatial Data Act (NGDA) of 2017.   Just think of it:   A process across the Empire State in place to magically aggregate our local government tax-payer funded geospatial data assets into National Spatial Data Infrastructure (NSDI).  Newly appointed and designated state agencies responsible for providing support (similar to the designated federal agencies)  to make our geospatial contributions consistent with the federal data themes and standards as outlined in Section 6 and 7 of the proposed NGDA legislation.  Ultimately being made available via the GeoPlatformContinue reading

Best of the Show: New York Giant Traveling Map

While the recent statewide GIS conference in Lake Placid featured several presentations and vendor displays in emerging  areas of geospatial development across the Empire State, one presentation –  and an interactive one no less –  was certainly one of the most refreshing and welcomed.  Why’s that, you ask?  Well, consider the following:   (1) it contains  no technical jargon or  software programming speak,  fancy charts or diagrams, (2) has connections to the  educational community, (3) applicable anywhere in the Empire State,  (4) absolutely and completely different, and  (5) suitable for all ages –  Rated “G”!  Yes, the New York Giant Traveling Map which was presented by Susan B. Hoskins, Senior Extension Associate at Cornell University.

Susan B. Hoskins demonstrates use of the NYS Giant Traveling Map to conference attendees during 2017 GeoCon in Lake Placid. Note: No shoes allowed – the geoenabled version of the game Twister?

The Map

In celebration of the 30th anniversary of state geographic alliances, National Geographic produced a Giant Traveling Map for each state.  Two copies were gifted to the New York Geographic Alliance in 2016 headed by Timothy McDonnell, geosciences faculty at Monroe Community College in Rochester.  Since then the New York 4-H Geospatial Sciences program has gotten involved to help promote the map in 4-H programs and classrooms statewide.  The 4-H Geospatial Science and Technology Program, within Cornell Cooperative Extension, provides educator professional development in GPS, GIS and the tools of remote sensing.  The geography lessons learned on the Giant Traveling Map are fundamental to using technology in map making.  Many youth and adult mentors take these skills and technology lending library and apply them to community mapping projects.

The Giant Traveling Map of New York, measures 15 X 20 feet and includes major cities, water bodies, mountains, Indian Reservations and National Parks.

The map “kit” comes complete with a curriculum of six activities that help youth explore map features and symbols, grids, map scale, orientation and direction, and the basics of Geographic Information Systems.  Props included in the kit are orange cones for marking points, yellow plastic chain, blue yarn and a ball of string to map “linear features, a compass rose and map legends.  Teachers and users of the map can determine how far is it from New York City to Albany by comparing one’s foot to the scale bar and walk along the Hudson River.  Or finding the Erie Canal?  Follow the canal path from Albany to B-uf-fa-lo-ooo, just like the song.

To date, the following schools and organizations have hosted the Map:

Additionally, McDonnell states: “The Map can be used in middle schools to support 7th Grade curriculums for social studies which includes New York history and geography”.  The Geographic  Alliance  maintains other resources specifically designed for middle school including  The Atlas of New York: Legacies of the Erie Canal and Lessons for the Atlas of New York.  More information can be found under the Resources link on their website.

The Map Travels to Westchester County

After  the Lake Placid conference, the Map traveled to Solomon Schechter elementary school in White Plains where it was used by 4th grade teacher  Amy Sroka who expressed accolades after having used the map..  After a week in the classroom, one of Ms. Sroka’s students commented:

I learned a bunch of names of different towns and cities. It was really fun trying to find the locations of a lot of the places. While I was studying the map, I discovered that there are actually so many more mountains in New York State than I had thought there were…I really enjoyed the map!”

If your school, family gathering, or organization is interested in using the Map, contact Tim McDowell at the New York Geographic Alliance.  It is also available for sale through National Geographic for $750.

Geospatial Business Spotlight: Topographics, LLC

Company Name:                              Topographics, LLC

Location:                                          Saratoga Springs, New York

Website:                                           www.topographics.org

Number of Employees:                   3

Established:                                    2016

Topographics  provides maps and mapping solutions for a wide variety of clients throughout New York and the United States. Evolved from JIMAPCO, Inc, a long time and well recognized New York State based cartographic and mapping company, the Topographics cartographic team has over 100 years of combined experience providing printed maps, digital files, and most recently interactive mapping applications.  Their client portfolio includes a variety of municipalities, chambers of commerce, educational, religious, and medical organizations, as well as a vast assortment of business clients across the Empire State.

Products and Services

Hardcopy

Using their expertise in graphics and print production, Topographics provides printed folded maps, laminated wall and tourism maps, atlas books, and other hard-copy products for hundreds of customers. Hardcopy products are published using Adobe Illustrator. Selected New York State examples include:

Data obtained from the New York State GIS Clearinghouse provided the foundation to create this statewide elevation model map for a major upstate university.

Product for Adworkshop, which does marketing and communications for Greene County and other organizations in the Catskills.

A section of the Town of Islip (Long Island) hardcopy map. The map contains OpenSource content (OpenStreetMap), features obtained from Suffolk County GIS, and other data sources.

Additionally, Paul Hein, one of the principals at Topographics has an impressive personal portfolio of cartographic products available for viewing and purchase at www.fineartamerica.com. This is a map of the Finger Lakes Region showing elevation contours and shaded relief. Each contour interval is colored with a different shade presenting the area as an abstract map. Take a look.

Online and Mobile

Beyond hard-copy, Topographics  provides digital files used for tourism promotion, sales and marketing, realty operations, way-finding, and business development, among others. Their online maps are interactive applications displaying information ranging from business locations to recreational trails. They most often implement the Leaflet or OpenLayers open source JavaScript libraries and make use of Mapbox and Mapzen services for the styling of OpenStreetMap and custom data as well as providing geocoding and directions. Other platforms include Avenza Web Author and the Google Maps and MapQuest API.  Ilustrative examples include:

This is one of my favorites: The Roman Catholic Diocese of Albany interactive map showing facilities and services within the Diocese. The application includes hundreds of Diocese related facilities and properties which can be turned off/on with the Categories button.

The Saratoga Convention and Tourism Bureau interactive map presents hundreds of visitor resources and opportunities for those in the city or planning a visit. Using our mobile-friendly technology, users can see their current location, locate nearby resources, see walking and biking trails, and find recreational resources.

The following examples are interactive maps for both the Washington County Tourism and the Village of Chatham (Columbia County).  Click on either image to be rerouted to the actual online map viewer.

The Topographics Crown Maple Farm (Dutchess County) map below is available as a hardcopy map and also runs on the Avenza Mobile Map App so it can be “used on the trail” with a smartphone.  User’s can also record their track (their movement) including elevation. User’s can also plot points on the map and assign attributes to the points, including photos. For the Crown Maple Map, Topographics had the owner of the property actually walk the trails using a preliminary map they created for the app to capture histracks. The owner emailed the X,Y’s back to Topographics to be incorporated into the final product. Topographics has created similar maps for other clients all over the world using the Avenza app.

Summary

Far from just a traditional hardcopy cartographic mapping company, Topographics uses and combines many industry leading Open Source software components in producing and publishing their products and services to their clients.   Be informative and nice to see Topographics presenting at future New York State GIS events and conferences.

For more information on Topographics, LLC products and services:

Contact:                        Paul Hein
                                      Topographics, LLC
                                       info@topographics.org
                                       518-428-6638


2017 NYS Spring GIS Conference Specials

The last couple weeks I’ve been engaged in the following cutting-edge enterprise geospatial issues:  (1) staring at the sky on a daily basis,  (2) monitoring the temperature, and (3)  hoping the remaining snow to melt and the leaves to hold off in budding – both at the same time.  After nearly 33 years in County government and its boiled down to this! Why?  So we can get our aerial photography flown over the next 10-days to support our 2017 countywide base map update.  The heavy snow March 14th really set us back and the window to capture the photography is closing quickly.

So at any rate, its been easy to lose track of upcoming Spring 2017 regional one-day GIS conferences and meetings over the next 4-6 weeks.  Most of the Spring 2017 shows are held in locations accessible via a maximum 2-4 hour drive from furthermost parts of the Empire State, offer a wide range of geospatial topics and presentations, provide excellent networking opportunities among colleagues and industry representatives, and are generally light on the wallet.    For those unable to make or justify the big lift of getting to the uber ESRI conference in San Diego later on in the summer and/or chasing GISP certification credits these venues are for you.

Sounds sweet, right? So consider the following and get your travel approvals in order:

GIS-SIG 26rd Annual Conference, April 11th, Burgundy Basin, Pittsford, NY.  Unfortunately I cannot make GIS-SIG this year as it is one of my most favorite statewide one-day shows.  GIS/SIG provides the premier geospatial professional forum in the Rochester/Genesee Finger Lakes/Western New York region for GIS practitioners focusing on trends and policies relating to new geospatial technologies and current projects.  With a loyal following, the size and content of the GIS/SIG conference is broad enough to often substitute as an annual state conference for many GIS practitioners in the western half of the state. This year’s conference again includes vendor displays and an agenda covering topics such as mobile data collection, drones, 3D GIS, and ESRI software updates, as well as a keynote address from Dr. John R. Schott, founder of the Digital Imaging and Remote Sensing Lab at the Rochester Institute of Technology (RIT).  Corporate sponsorship keeps the price tag of an individual registration at under $100 for the day which also includes lunch. Online registration is still available and while you are at the GIS/SIG website you can also see the many resources and links GIS/SIG provides to its user community.  This is a great show and if you have the opportunity to attend. Highly recommended.

Long Island GIS (LIGIS)  2017 Spring User Conference, April 26th, SUNY Farmingdale, Farmingdale, NY.  LIGIS meetings and conferences have grown in structure and content over the last few years and this spring’s April 26th meeting will continue to illustrate the improvement among the Long Island GIS stakeholder user community.  Scheduled presentations from government, academia, and industry are on the agenda including topics covering mobile applications, MS4 data collection, 2020 Census Bureau update, and GIS & hydrofracking among others. Located in central Long Island on the SUNY Farmingdale campus, this is a not-to-miss conference on “the Island” for those with limited travel budgets.  Make plans to attend.  Those interested in attending can monitor conference specifics at the LIGIS homepage.

Northeast Arc User Group (NEARC) Meeting, May 15th, University of Massachusetts, Amherst, MA.  Spring NEARC meetings are conveniently located in Amherst, MA which is easily accessible to the Albany Capital District and GIS professionals in eastern New York State.  Unlike GIS – SIG, which is software vendor independent, this show is very much ESRI centric and packed with high quality user presentations. Even though only one day, the show has grown to be so popular that it now competes with the larger multi-day GIS shows and conferences across New England.   Price tag for attending:  $65 which includes lunch.  If you can afford an overnight, activities the evening before downtown Amherst and a hotel room at the UMass conference center make it even more worth your while. (As of the day of this blog post 4/4 the May 15th agenda was still in development; I did submit an abstract!).  Registration will open mid-April.  If your organization is an ESRI shop – this is a Spring show not to miss.

Westchester GIS User Group Meeting, May 11th, Purchase College, Purchase New York. As one of the largest geospatial meetings in New York State, the Westchester GIS User Group Meeting is a free one-day conference held at Purchase College. Made possible by financial support from exhibiting vendors and conference facilities provided by the college, the draft 2017 agenda  features user presentations from County government,  Westchester County municipalities, nonprofits including the Goodlands Project, and ESRI. There is also free conference training: At lunch “Leveraging Suvey123 for Mobile Data Collection” with instructor Larry Spraker and post-conference “Getting Started with How to Build Great Web Apps” with ESRI’s Mark Scott.   Also, sponsors get to present 5-minute “Lightning” talks over the course of the day.  The Purchase College location provides easy one-day access across the metropolitan NYC area, as well as the broader lower Hudson River Valley and southeastern Connecticut. Agenda and other meeting  specifics – including registration – are available from the Westchester County GIS website.

Other Venues:  If you are in the Metro NYC area don’t forget to check the GeoNYC Meetup calendar for ongoing meetings across the city. Subject matter and participation is pretty amazing.  And/or the many other geospatial related Meetups in the region covering big data, data visualization, agriculture mapping, and everything inbetween including drones. A little further removed geographically from the Empire State is the Northeast Geographic Information Society (NEGIS) conference on April 27th in Ashland, MA. You can follow and learn more about NEGIS via their blog.

The entire Empire State GIS community is fortunate enough to be close enough to a range of regional geospatial meetings and conferences which are accessible from most areas of the state and provide many of the same benefits of larger shows and not nearly as expensive.

Safe travels!

2017 GeoCon Wish List: Part 1

I first wanted to publish this article initially as a wish list to the GIS Santa Claus in early December, but the holidays came and went so I am now submitting it as a New Year’s wish list (Part 1) for the 2017 GeoCon  in Lake Placid.  There will  be other suggestions over the next several months and I’ll remain cognizant  what I wish for as I may be submitting an abstract to present myself.  Maybe.

So to start the discussion, here is an initial list of  ten geospatial mapping applications and program areas I’d like to send a speaker invite to for the 2017 GeoCon – and why.

NYS Office of the Attorney General:  New York Crime Gun Analysis https://targettrafficking.ag.ny.gov/tool/

While mapping continues to be one of the primary end products of GIS analysis, geospatial data is increasingly being used in a wide range of data visualization platforms such as Tableau.    I’d welcome the opportunity to attend a presentation by the Office of the Attorney on the Crime Gun Analysis report outlining data collection, data analysis, and the rendering of the data through maps, tables, and charts.  Not the normal GIS menu.

New York State Regional Economic Development Councils (REDC) http://regionalcouncils.ny.gov/

In context of geospatial, this program reference isn’t so much about “what it is”, as opposed to more about “what it isn’t”.  Or at least I think.  From my level, the REDC framework has always been somewhat of a mystery since current state administration created the 10 Regional Councils in 2011.  And even more confusing that the geography of the REDCs do not coincide with the statewide Regional Planning Commission boundaries. That said, there is an incredible amount of geospatial information and analysis in the Council’s underlying mission.  Everything happens somewhere.  And there is a ton of money coming through the Consolidated Funding Application (CFA) process which I believe the GIS community should be more engaged and recipients of to some degree. Uber opportunities for web mapping applications, Story Maps, and GIS-produced maps for publications though one would be hard pressed to see any real evidence of a professional GIS touch in any of the Council products and services.   I looked through four regional 2016 “progress” reports (Hudson Valley, Finger Lakes, Capital Region and Southern Tier and found very limited reference to GIS/geospatial technologies.   Some kind of presentation by one of the REDCs and/or regional GIS personnel involved in this program would be most informative for the statewide GIS community.  Otherwise I doubt we’re going to hear anything through the state GIS program office on this.

511NY
https://www.511ny.org/

This is more of a selfish request than anything because I really don’t fully understand the makings and how 511NY operates in context of GIS/geospatial data collection, sources, work flows, or even development of their applications including the online mapping stuff.  I do know it’s big, visible, seemingly growing in functionality, supported by a mess of New York State transportation agencies -even though it has its own .org web address.  It also creates a lot of data which would be useful to consume and use in local government web mapping applications.   I’d be the first one to sign up to hear how it all comes together, funding, sources of the data (including what is being taken from and/or generated at the local level), opportunities for collaboration with local GIS programs, and what’s next.  How long before we see an Uber icon on the 511NY homepage to help support trip planning?

Continue reading