Self-taught hobbyist has a treasure chest of geospatial content on website
One of the benefits of writing about all-things geospatial in Empire State is sometimes I just don’t know what I’ll come across. Looking for this thing and finding that. Starting in earnest on an article about a certain GIS channel and a couple days later finding myself having completely jumped the rails and find myself way over there writing about Channel Z. (Yup, that static in the attic). Or ending up on a cool or fun website not really knowing how I got there.
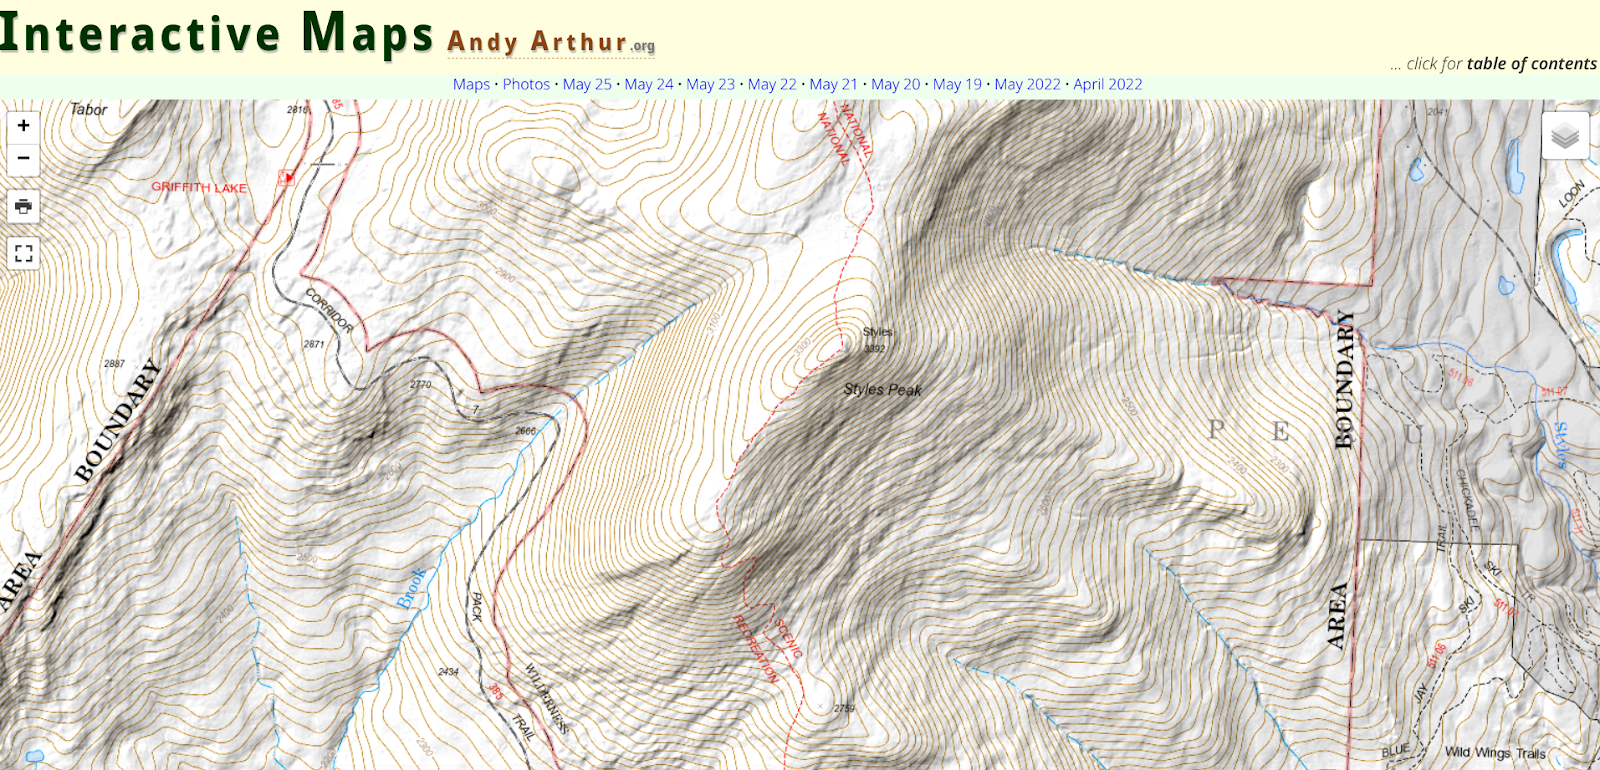
Case in point: Interactive Maps by Andy Arthur. Empire State mapping DIYer extraordinaire. Just a hobby.

When I first stumbled onto the site and having spent some time driving around, I realized I needed to find out who was behind it all. It definitely isn’t the kind and feel of the traditional geospatial website I normally include or reference in my blog, but enough interesting – and yes, quite different – content to dig a little deeper. And glad I did. This is not a blog post to focus on a particular topic or concept, but rather just more of a pointer to the URL and let you take away from the website what you want.
It turns out the person behind all of this is Andy Arthur, who by day, is Deputy Director of Research Services in the NYS Assembly. “I have no formal GIS training, as things were still pretty primitive back when I was in college (SUNY Plattsburgh) in the early 2000s especially when it came to web services, online data and open source software” says Arthur, “computers were a lot less powerful back then. I remember vaguely hearing a bit about Remote Sensing when I was involved in the Environmental Science Club in college, but it wasn’t something I ever used.“
Since then and working on his own, Arthur picked up QGIS (and the accompanying PyQGIS developer tools), as he was looking for a way to make his own topographic maps because he wasn’t happy with what was available on the Internet. He later found out he could FOIL a primative campsite shapefile from NYS DEC and get data from there to help find campsites. “I was pretty good at map and compass stuff from my years in Boy Scouts and always interested in environmental and land use issues”, he says. Over time, he branched out into other geospatial areas including web services. More recently He’s been focusing on more automation of processes, using Python and R statistical language to do some map plotting and a lot of Census data gathering and processing. “I like working with R as it is fast and easy to implement code in. I’ve also lately been doing a lot more with Leaflet and web services”. Along the way he continues to use GeoPandas and Leaflet for map making. (btw as I was putting this blog piece together I found out the creator of Leaflet 11 yeas ago was Volodymyr Agafonkin, a Ukrainian citizen who at the time was living in Kyiv.) Content on the site is also made available in KMZ for use in Google Earth.

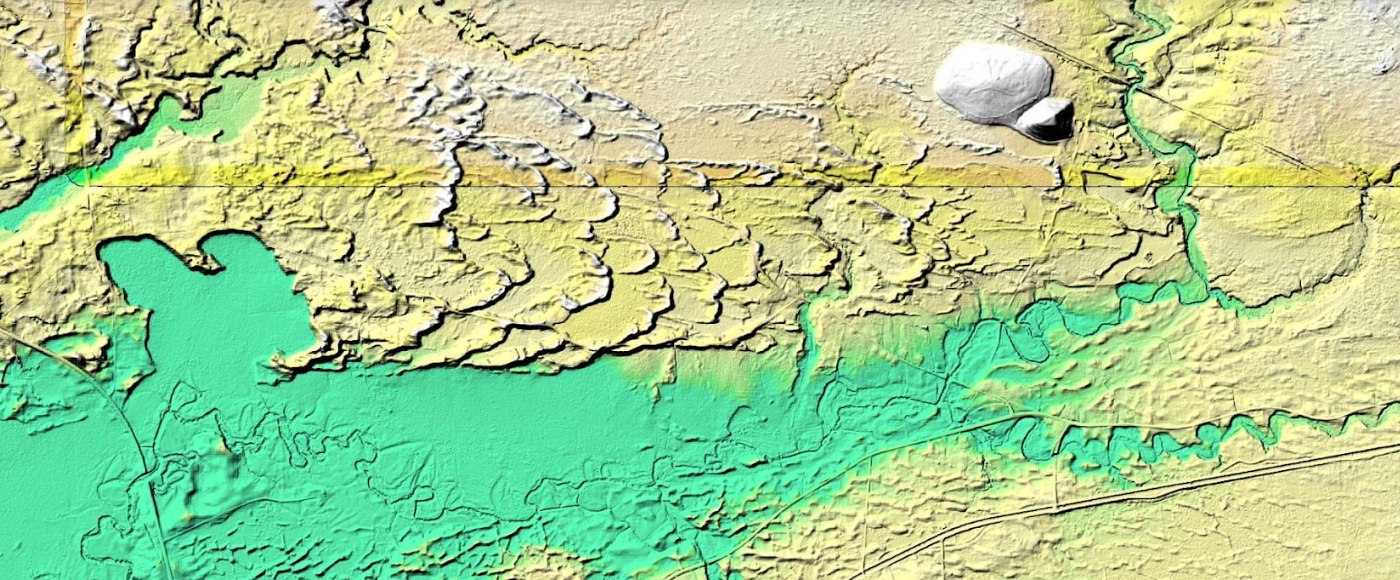
This is a example of how Arthur processed LIDAR data covering the Rome Sand Dunes west of the City of Rome in Oneida County. The landscape ifs a mosaic of sand dunes rising about 50 feet above low peat bogs which lie between the dunes. Processed LIDAR data renders the dunes very clearly. Arthur created this originally by writing a QGIS plugin that queries a shapefile with the LIDAR Digital Terrain Model Bare-Earthindex, then downloads the geotiffs, and finally joining them together to create the hillshade.The plugin itself is in Python and runs in QGIS, while the lidar download/processing script is in php-cli shell script.
The best place to start navigating the website is to open the table of contents link located in the upper right corner of the landing page. The table of contents page then provides additional links products and visuals Andy has created including aerial photos, charts, interactive maps (recommend starting here), and thematic maps to name just a few. This page also provides more detail on open source components, some specifics on the use of Python and Pandas, a downloadable CSV file listing of web services (WMS, ArcGIS services, etc) used on the blog, and much more. It’s worth noting that the website also includes non-GIS/geospatial content.

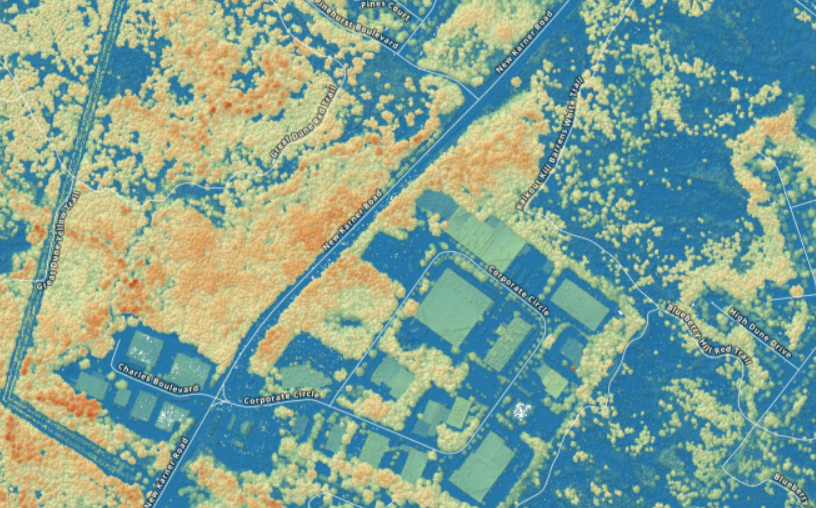
If you need some additional evidence of how much Arther has picked-up on programming, using open source components, and navigating the geospatial landscape in this space, check out his tutorial on how to create a Digital Surface Model GeoTIFF Using National Map Downloader, LiDAR Point Clouds and PDAL. By example, the DSM image above is from a section of the Albany Pine Bush. For a larger montage of the Albany Pine Bush digital surface model and samples of his code, click here for downloads.

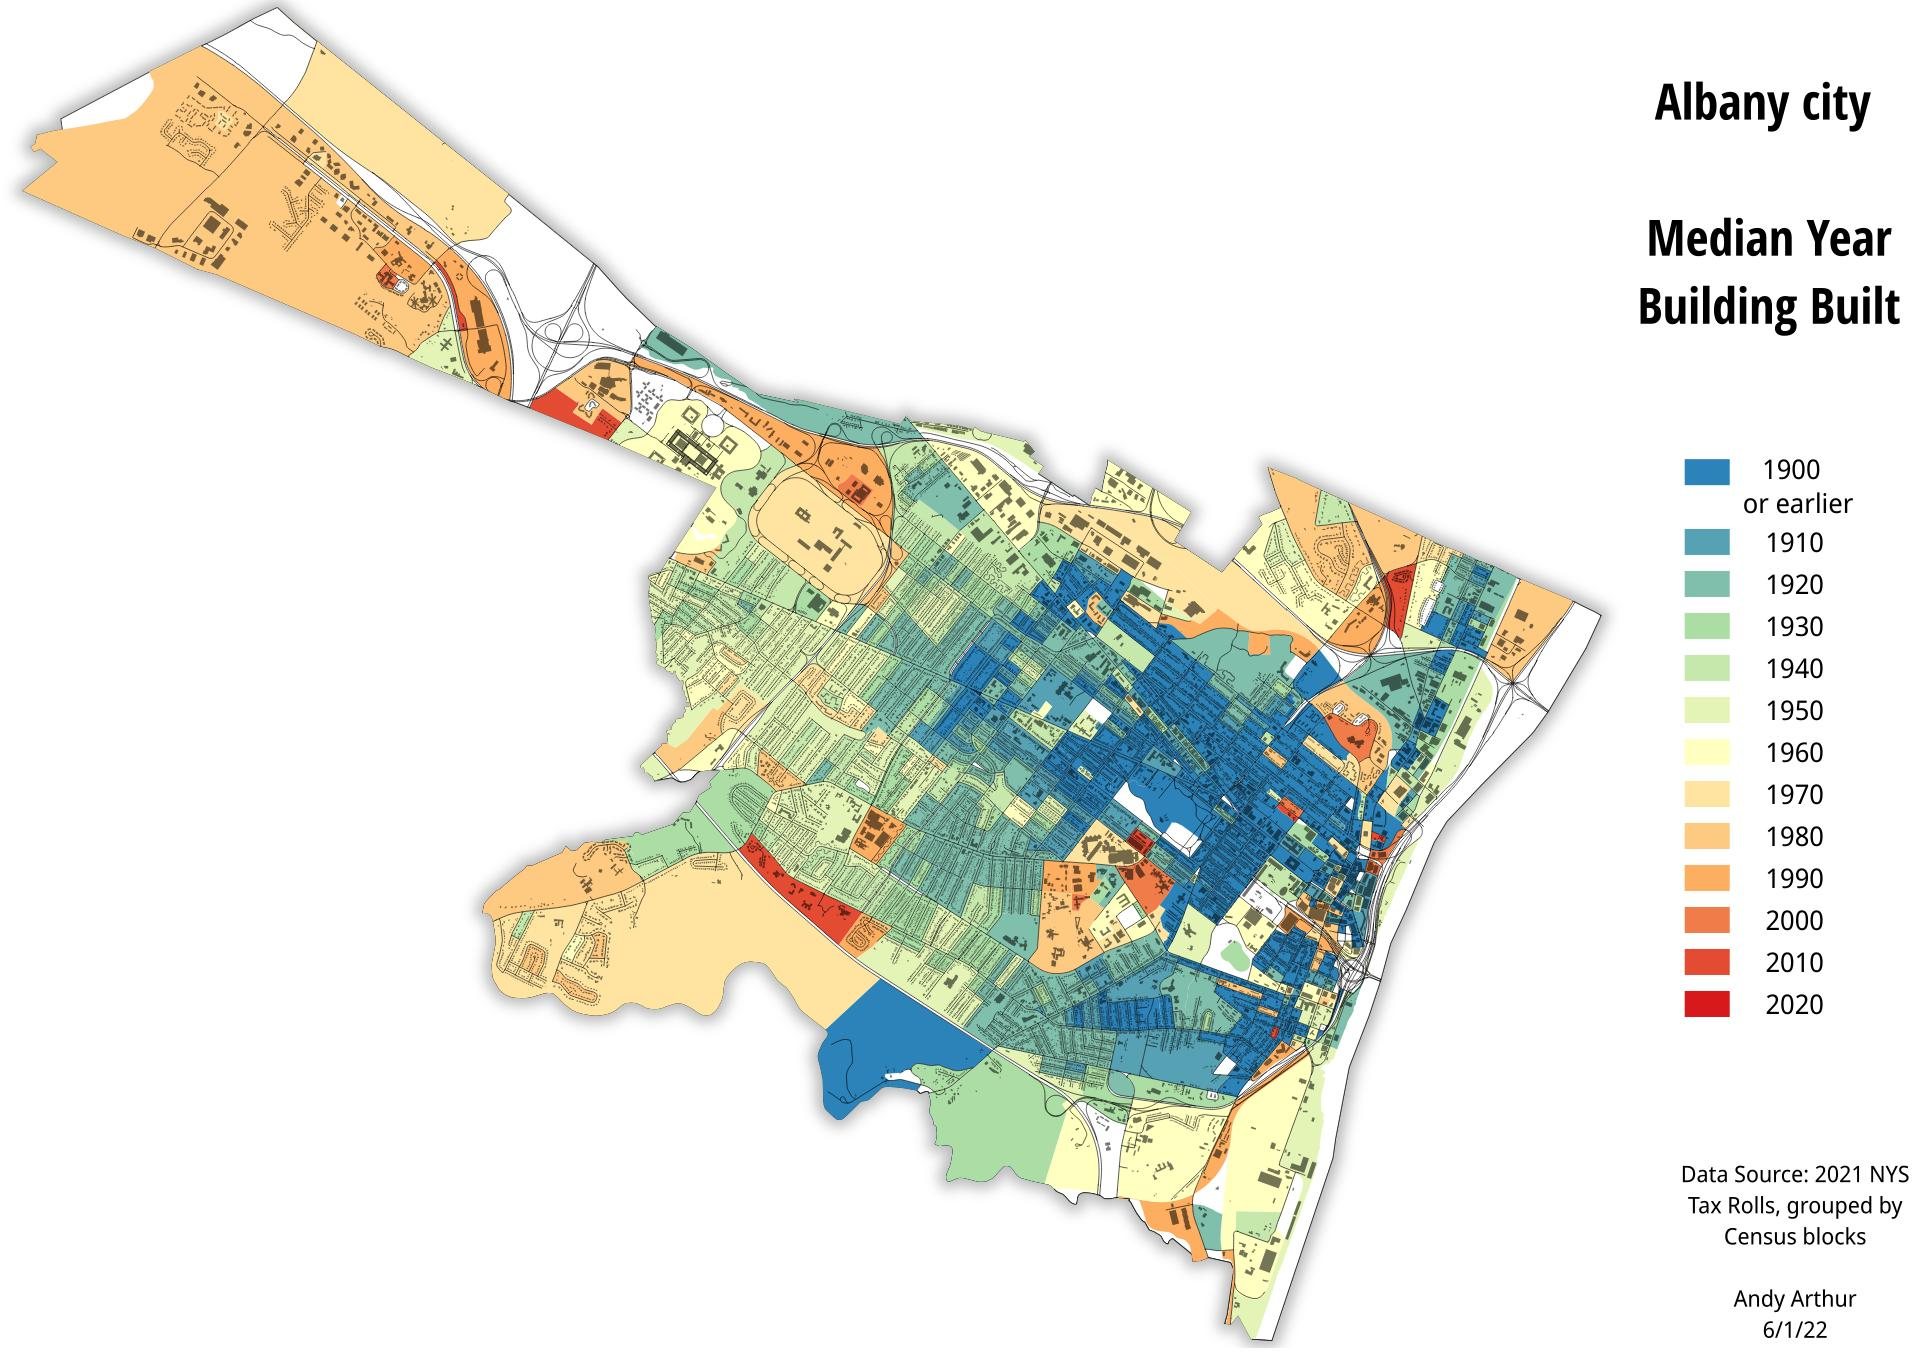
And of course, the old stand-by hardcopy product. Here, a recently created thematic map of the City of Albany median year of housing construction map. He used the NYS Tax Parcel Centroid Points data aggregated down to the parcel level using R code and created a GeoPackage. Which was then used to create the map in QGIS. Additional layers were added for context.
There are many many more examples of geospatial products, maps, and viewers on the website. Its a great example of how much can come out of the other end when diving into and applying geospatial tools to one’s own personal interests and way of living.
When you have a few minutes over lunch or a cup of coffee, take a look at his site. In communicating with Andy over the course of putting this piece together, he would be open to talking with and assisting non-profit or similar community groups on specific GIS/mapping projects. His contact information is below.
Contact:
Andy Arthur
www.andyarthur.org
andy@andyarthur.org
