Empire State GIS/Mapping DIYer Phenom: Andy Arthur

Self-taught hobbyist has a treasure chest of geospatial content on website

One of the benefits of writing about all-things geospatial in Empire State is sometimes I just don’t know what I’ll come across.  Looking for this thing and finding that.   Starting in earnest on an article about a certain GIS channel and a couple days later finding myself having completely jumped the rails and find myself way over there writing about Channel Z.  (Yup, that static in the attic).  Or ending up on a cool or fun website not really knowing how I got there.

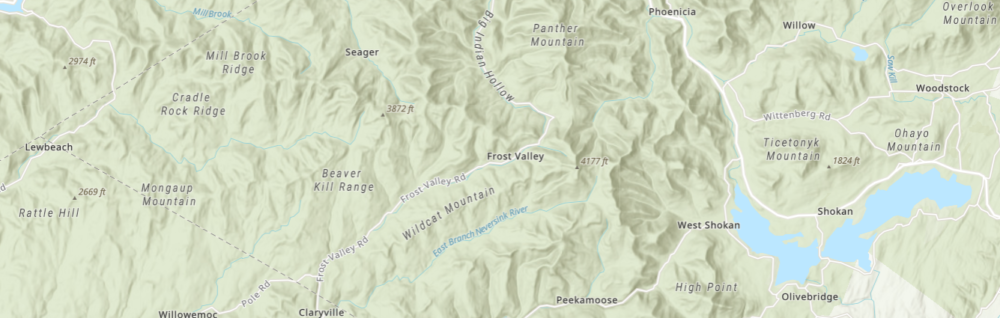
Case in point:  Interactive Maps by Andy Arthur.  Empire State mapping DIYer extraordinaire.  Just a hobby.

When I first stumbled onto the site and having spent some time driving around, I realized I needed to find out who was behind it all.  It definitely isn’t the kind and feel of the traditional geospatial website I normally include or reference in my blog, but enough interesting – and yes, quite different – content to dig a little deeper.  And glad I did.  This is not a blog post to focus on a particular topic or concept, but rather just more of a pointer to the URL and let you take away from the website what you want.  

It turns out the person behind all of this is Andy Arthur, who by day, is Deputy Director of Research Services in the NYS Assembly.   “I have no formal GIS training, as things were still pretty primitive back when I was in college (SUNY Plattsburgh)  in the early 2000s especially when it came to web services, online data and open source software” says Arthur, “computers were a lot less powerful back then. I remember vaguely hearing a bit about Remote Sensing when I was involved in the Environmental Science Club in college, but it wasn’t something I ever used.

Since then and working on his own, Arthur picked up QGIS (and the accompanying PyQGIS developer tools), as he was looking for a way to make his own topographic maps because he wasn’t happy with what was available on  the Internet. He later found out he could FOIL a primative campsite shapefile from NYS DEC and get data from there to help find campsites. “I was pretty good at map and compass stuff from my years in Boy Scouts and always interested in environmental and land use issues”, he says.  Over time, he branched out into other geospatial areas including web services.  More recently He’s been focusing on more automation of processes, using Python and R statistical language to do some map plotting and a lot of Census data gathering and processing. “I like working with R as it is fast and easy to implement code in. I’ve also lately been doing a lot more with Leaflet and web services”.  Along the way he continues to use GeoPandas and Leaflet for map making. (btw as I was putting this blog piece together I found out the creator of Leaflet 11 yeas ago was  Volodymyr Agafonkin, a Ukrainian citizen who at the time was living in Kyiv.)  Content on the site is also made available in KMZ for use in Google Earth.

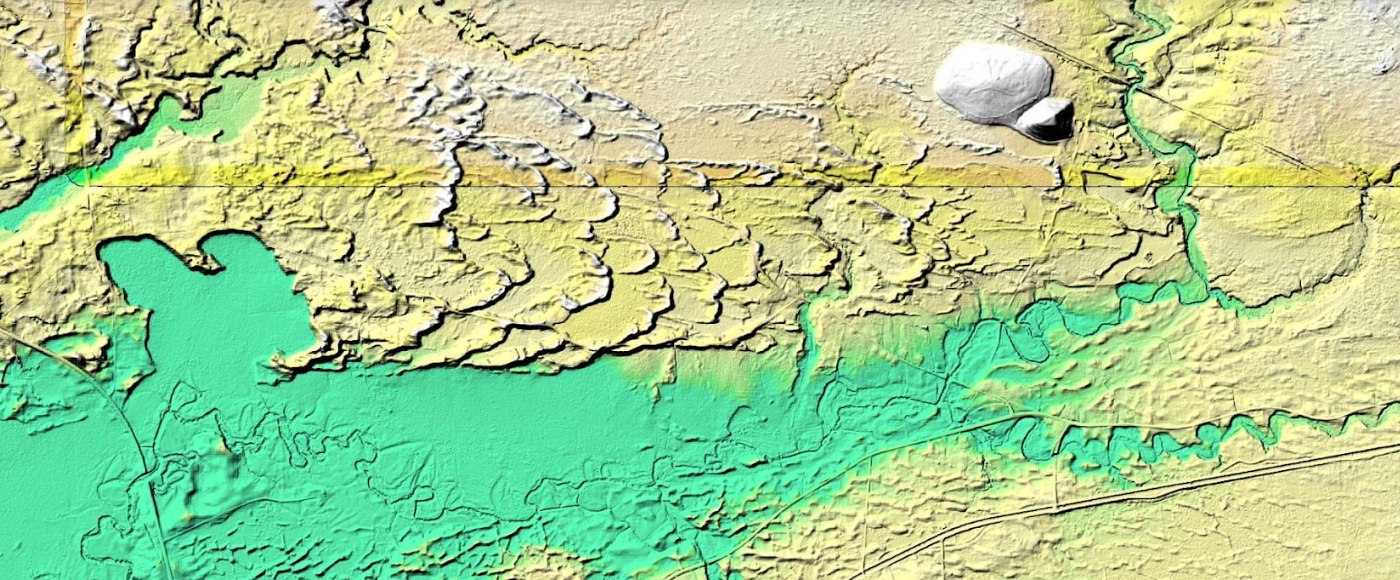
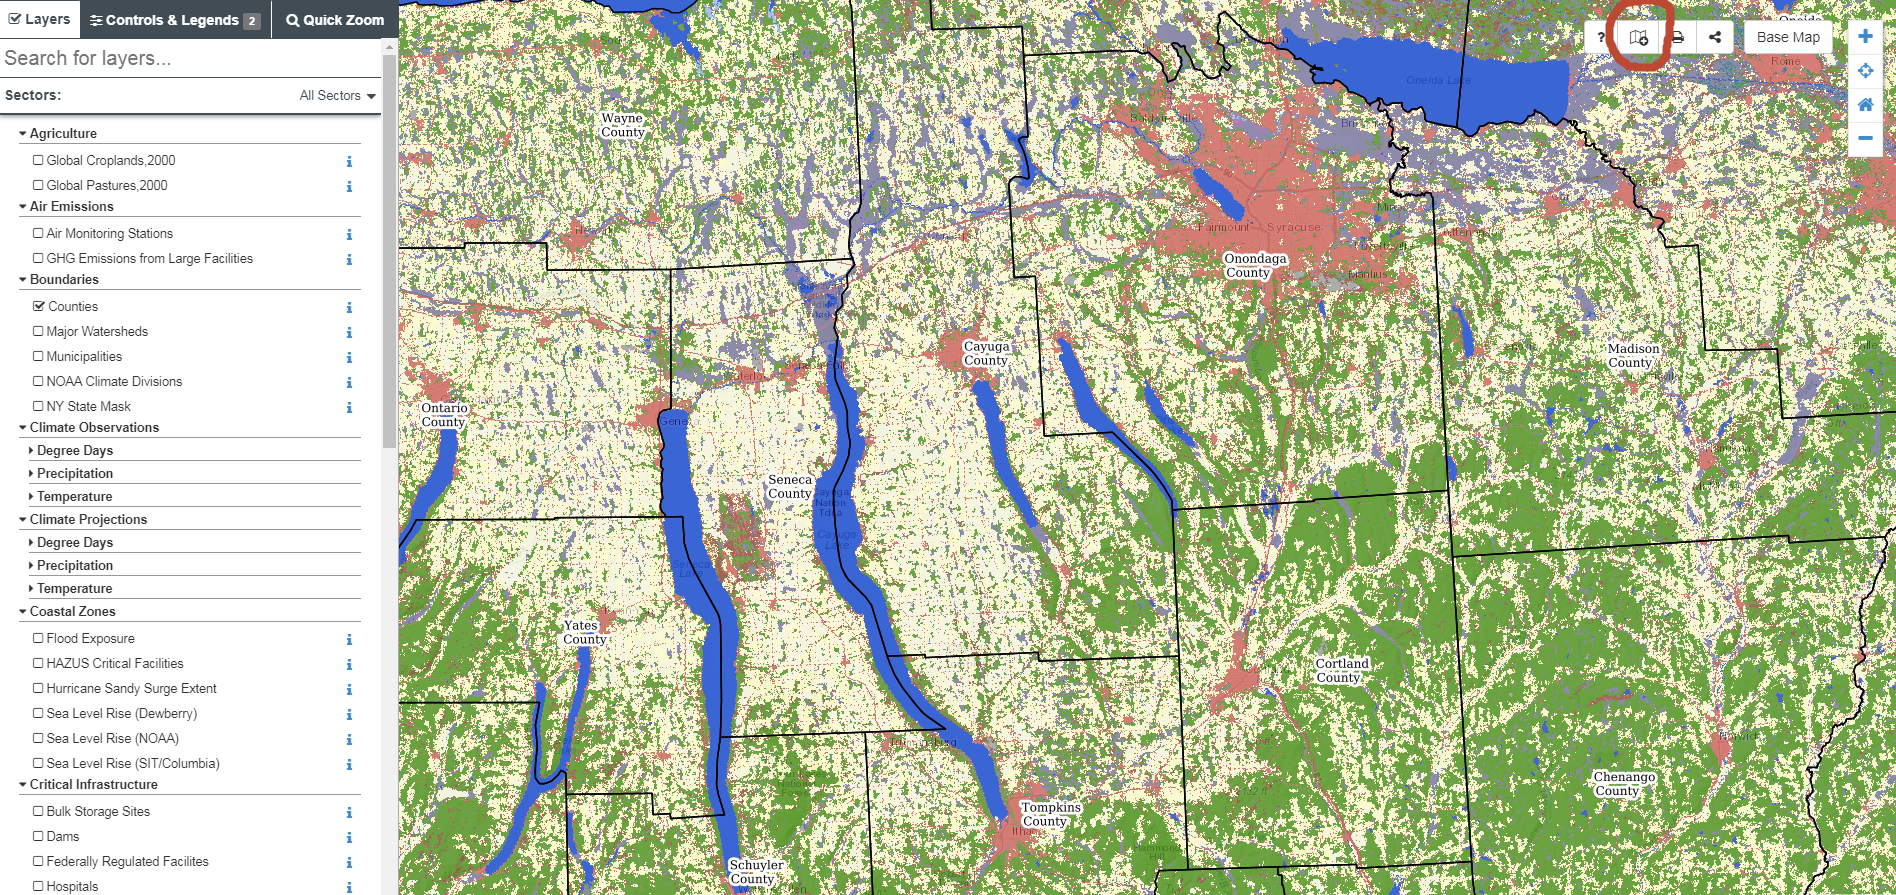
This is a example of how Arthur processed LIDAR data covering the Rome Sand Dunes west of the City of Rome in Oneida County. The landscape ifs a mosaic of sand dunes rising about 50 feet above low peat bogs which lie between the dunes. Processed LIDAR data renders the dunes very clearly. Arthur created this originally by writing a QGIS plugin that queries a shapefile with the LIDAR Digital Terrain Model Bare-Earthindex, then downloads the geotiffs, and finally joining them together to create the hillshade.The plugin itself is in Python and runs in QGIS, while the lidar download/processing script is in php-cli shell script.

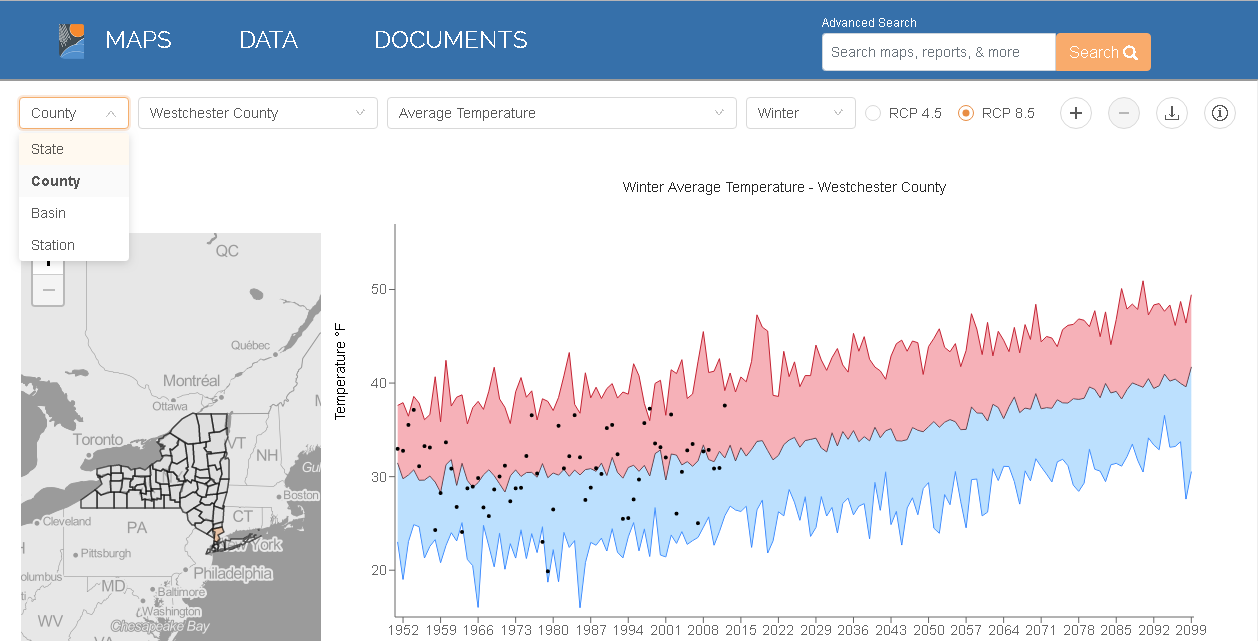
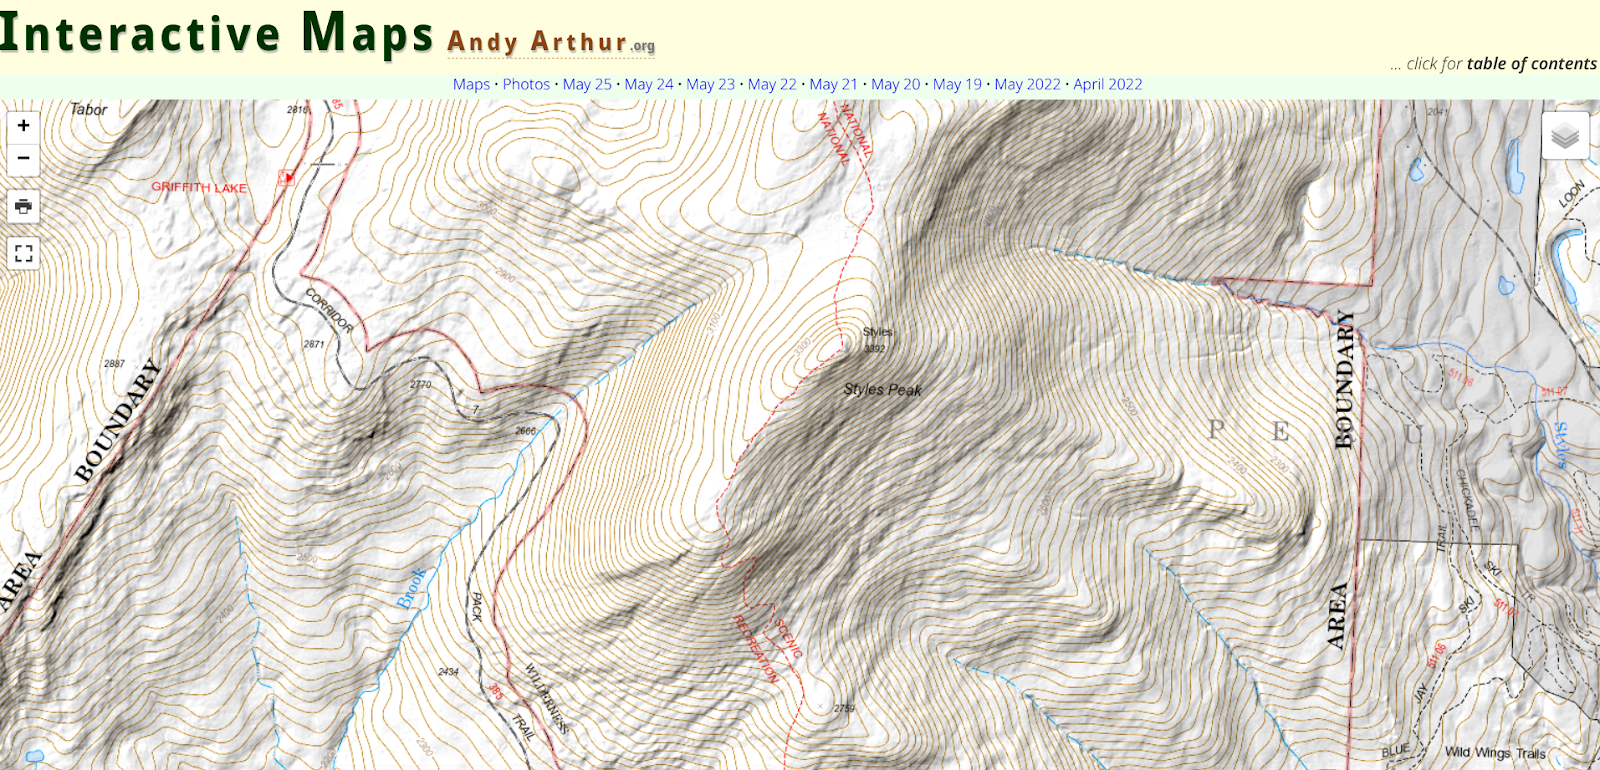
The best place to start navigating the website is to open the table of contents link located in the upper right corner of the landing page. The table of contents page then provides additional links products and visuals Andy has created including aerial photos, charts, interactive maps (recommend starting here), and thematic maps to name just a few.   This page also provides more detail on open source components, some specifics on the use of Python and Pandas, a downloadable CSV file listing of web services (WMS, ArcGIS services, etc) used on the blog, and much more.  It’s worth noting that the website also includes non-GIS/geospatial content.

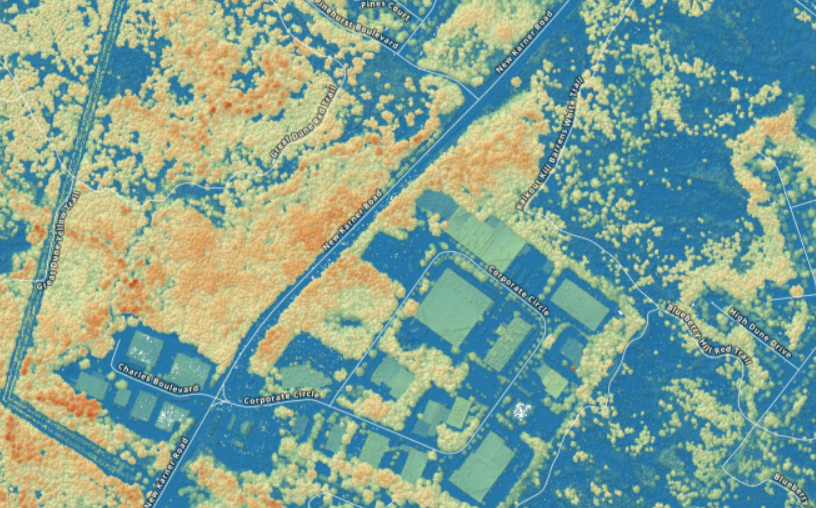
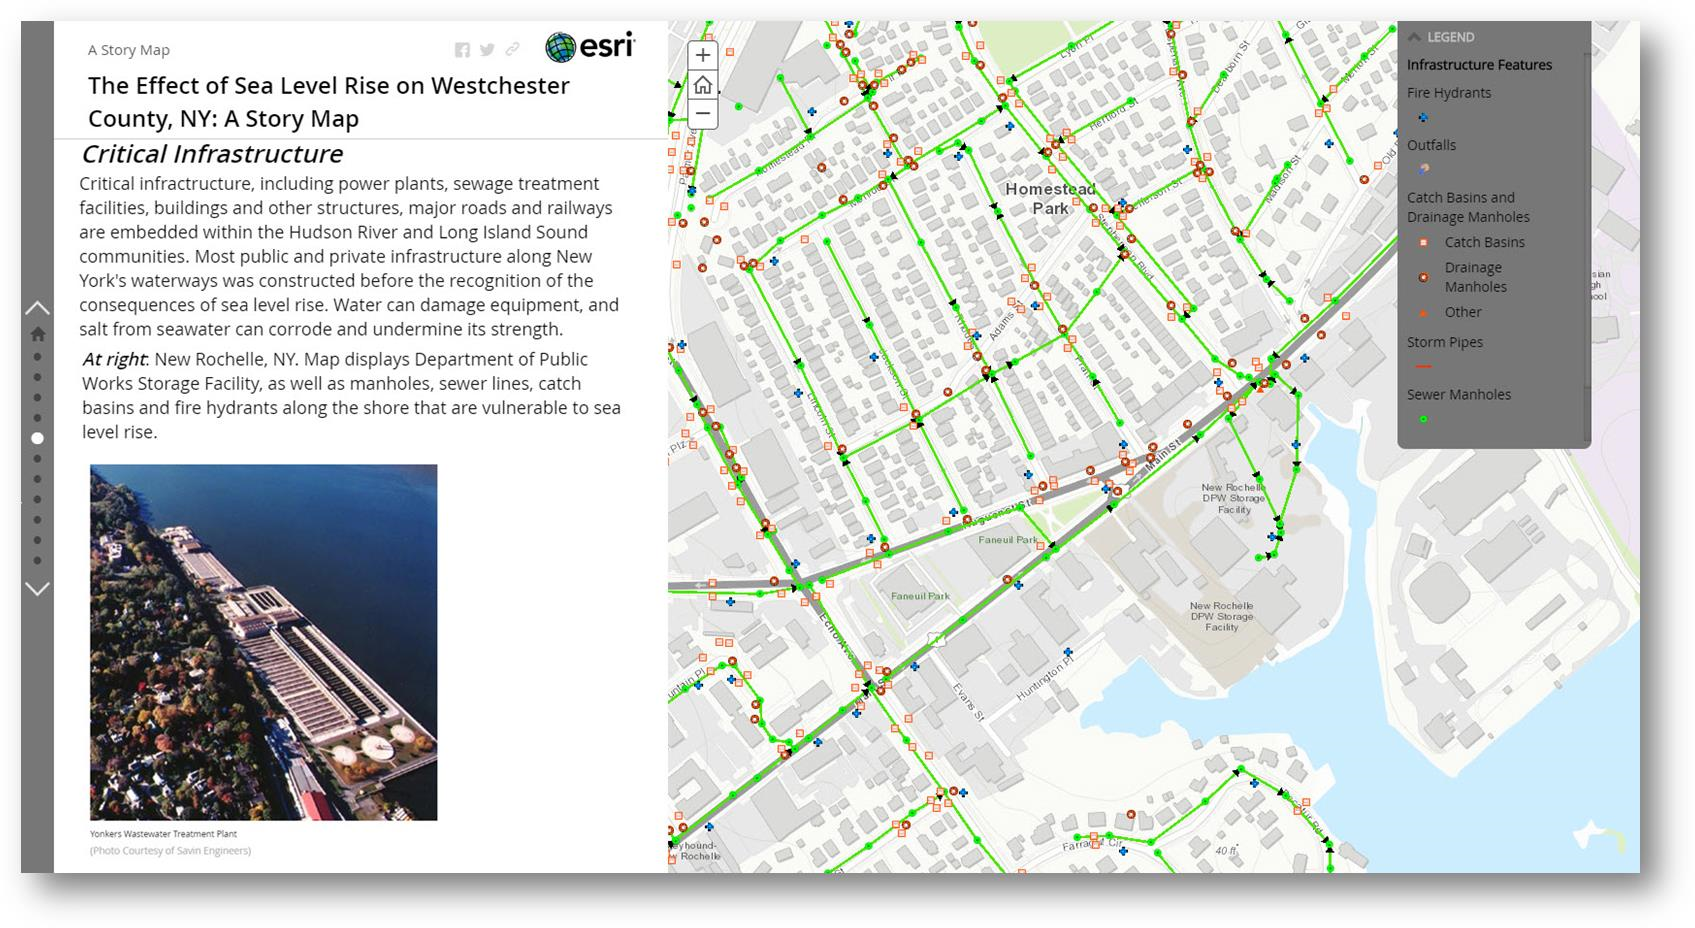
If you need some additional evidence of how much Arther has picked-up on programming, using open source components, and navigating the geospatial landscape in this space,  check out his tutorial on how to create a  Digital Surface Model GeoTIFF Using National Map Downloader, LiDAR Point Clouds and PDAL.  By example, the DSM image above is from a section of the Albany Pine Bush.  For a larger montage of the Albany Pine Bush digital surface model and samples of his code, click here for downloads.

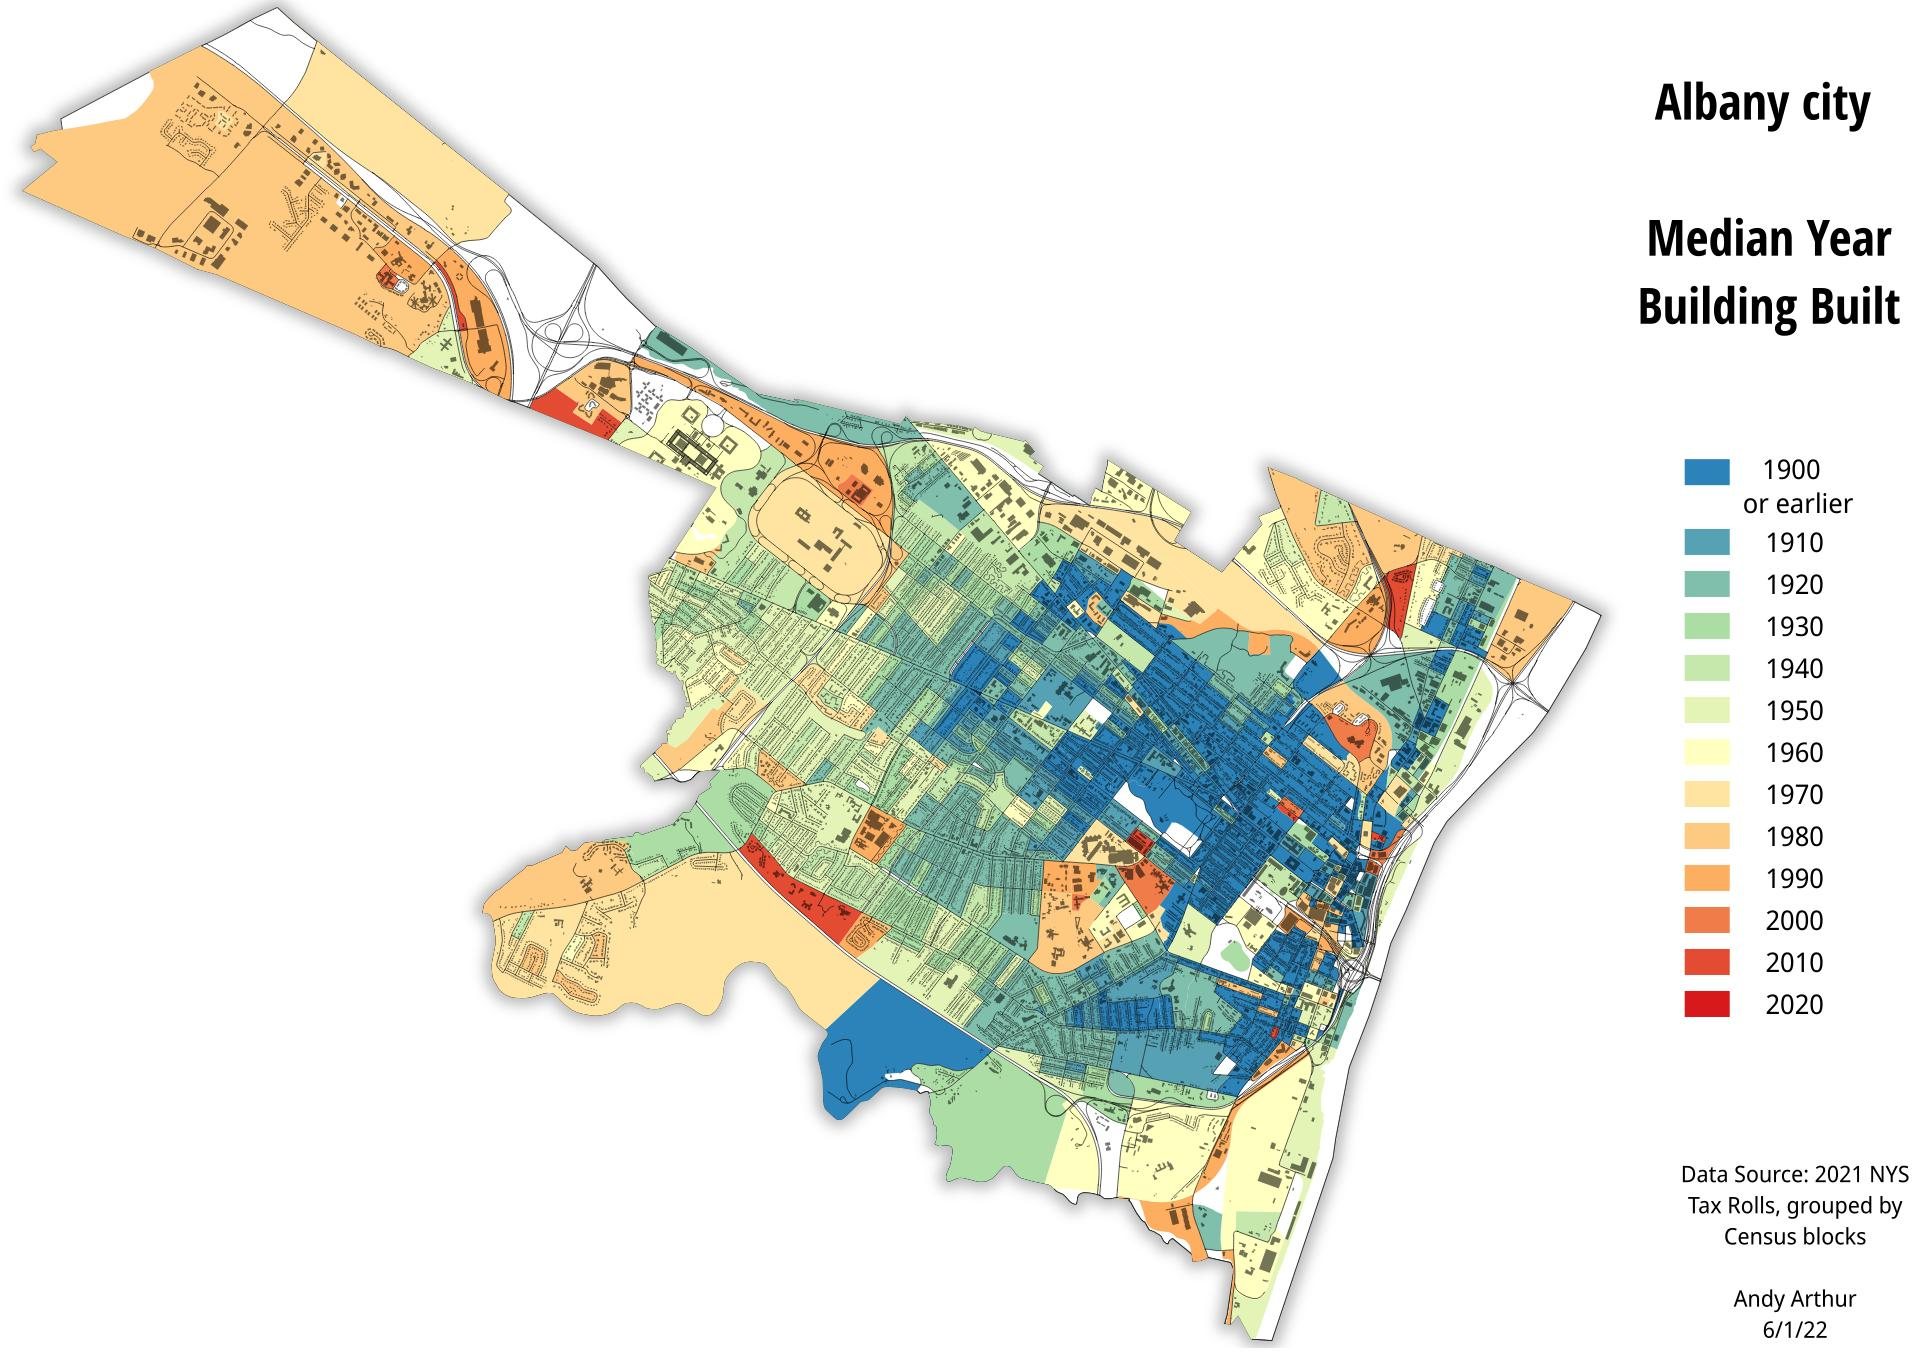
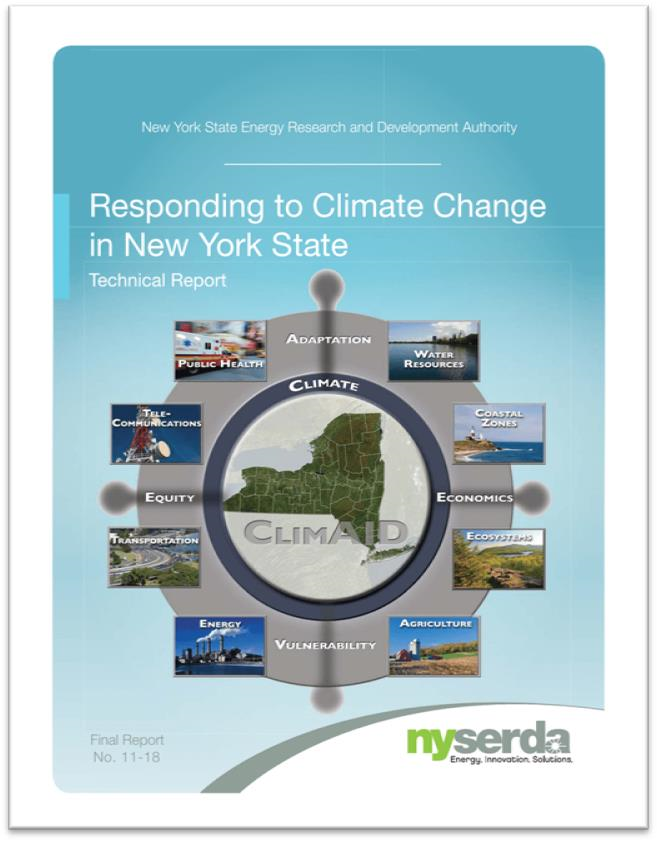
And of course, the old stand-by hardcopy product. Here, a recently created thematic map of the City of Albany median year of housing construction map. He used the NYS Tax Parcel Centroid Points data aggregated down to the parcel level using R code and created a GeoPackage. Which was then used to create the map in QGIS. Additional layers were added for context.

There are many many more examples of geospatial products, maps, and viewers on the website.  Its a great example of how much can come out of the other end when diving into and applying geospatial tools to one’s own personal interests and way of living. 

When you have a few minutes over lunch or a cup of coffee, take a look at his site.  In communicating with Andy over the course of putting this piece together, he would be open to talking with and assisting non-profit or similar community groups on specific GIS/mapping projects.  His contact information is below. 

Contact:

Andy Arthur
www.andyarthur.org
andy@andyarthur.org

The Essential New York Climate Change Science Clearinghouse

There is no lack of geographic information these days on Climate Change and its increasing impacts across the Empire State in the areas of sea level rise, rising heat indexes, more frequent and intense storms, changes to the natural environment and critical habitats, and its influence on a broad range of public health issues to name only a few.  And we see geospatial technologies at the core of sciences being used to analyze, respond, and prepare for future consequences.

Whether it be policymakers, planners, business and industry, residents or community groups, New York State is fortunate to have its own geocentric one-stop website on climate change issues as part of the New York Climate Change Science Clearinghouse (NYCCSC).   Hosted by NESCAUM (Northeast States for Coordinated Air Use Management) , NYCCSC contains documents, data, websites, tools, and maps relevant to climate change adaptation and mitigation across New York State. The goal of the NYCCSC is to support scientifically sound and cost-effective decision-making. It was developed to provide a framework where users can find information in multiple ways, including through interactive tools that use data from different sources.

Established in 2015, the site today contains nearly 2100 resources including over 200 web maps and viewers and an assortment of data products and datasets and is curated by Ingrid H. H. Zabel, Ph.D.  Initially the site was populated by resources that had been referenced in the 2011 ClimAID Report and several other key documents, as well as resources identified by groups of sector experts.  Today, the site curator continues to seek out new content from a variety of sources to keep the site current and fresh.  Submissions to the Clearinghouse are welcome though each are reviewed based on relevance, utility, credibility, and accessibility as described in the site’s Business Rules.   The underlying mission of the site is to provide resources that are relevant to communities of many different sizes around New York State, are focused on practical, applied science and that are open access as much as possible.

Dr. Zabel is assisted by a Content Team and Sector Expert Groups consisting of individuals originally involved in the development of the site, from Cornell’s Northeast Regional Climate Center, the Paleontological Research Institution,  , Northeast States for Coordinated Air Use Management (NESCAUM), Frontier Spatial, and New York State Energy and Research Development Authority (NYSERDA). The sector experts were identified by NYSERDA, NYS Department of Environmental Conservation, and the NYCCSC team, and include individuals from New York state agencies, academia, and nonprofits such as (New England Interstate Water Pollution Control Commission (NEIWPCC),  , and the New York State Floodplain and Stormwater Managers Association (NYSFSMA).

Users can explore and mine through the site via ad hoc interactive mapping, topic specific web maps, data charts, and for published documents and reports.  In addition to offering advanced search tools, site content is also grouped thematically in categories such as Climate and Weather, Sea Level, Energy, Flooding, Plants and Animals, Social and Economic, among others.

Some options on the user interface to dive in and start searching for data include:

Interactive Mapping and Web Maps

One of the focal points of the website is an interactive map of climate change and related data for New York State.   Users can select data layers to display from a menu, filter layers by sector, vary parameters within certain layers, and select from a variety of base layers and regional boundaries. For each layer, links are available to metadata and the original source. Data being made available in the viewer has been curated through more of a group effort, with the NYCCSC team getting requests and feedback from a variety of places, including project managers (NESCAUM) and sponsor (NYSERDA).

The NYCCSC interactive mapper also leverages map services from authoritative sources. For example, this GAP Land Cover Dataset is a service being published by the USGS. Users can click the ‘i’ icon for a given layer which provides metadata on relevant URLs. The interactive mapper also includes a function for the user to add a map layer of their own using the Layer Import button found along the toolbar in the upper right hand corner of the viewer (circled in red). Imported layers do not get added to the map permanently, but rather are a means to temporarily “mash-up” local data with the permanent collection of content in the application

The site is built almost exclusively with open source products and largely supported by Steve Signell at Frontier Spatial.  PostgreSQL is the geodatabase used to store and manage map layers and metadata.  A combination of Geoserver and Leaflet are used to create and manage the web services and support the user interface. Javascript and CSS coding was used to create the custom UI and map functions.

If you’re looking for standalone web and story maps for specific Empire State climate change issues – look no further. As the date of publication of this article, the site listed 203 separate maps from a wide variety of contributors including this one from Westchester County focusing on the potential impacts of sea level rise on critical infrastructure assets.

Among the many great offerings, sites found in the catalog of interest include The Natural Resources Navigator (The Nature Conservancy), New York State Geographic Information Gateway (NYS Department of State), Surging Seas Risk Zone Map:  New York (Climate Central), Environmental Justice Screening and Mapping Tool (U.S. Environmental Protect Agency), and Trees for Tribs Statewide Data Explorer (New York Natural Heritage Program) to name only a few.

Climate Data Grapher

User-generated time series graphs of climate data, both observed and projected (future and historical.)  The data grapher provides access to climate data which can be summarized by the user according to various geographic units such as counties. The same summaries are used in the maps & GIS viewer to attribute the corresponding map layers for county and watershed boundaries.  Both user interfaces (Interactive Mapping and Data Grapher) draw on the same raw data sources but offer different capabilities for query, summary and visualization.

I used the interactive graphing tool to plot Westchester’s Winter Average Temperature. It’s one of
19 types of climate related data which can be charted by either geographic area: state, county, or river basin. (Upper left hand corner pull-down). Other datasets area available by gauging and/or weather stations. The chart renders different results depending on which RCP radio button (4.5 or 8.5) is selected. RCP (Representative Concentration Pathway) 4.5 and 8.5 are scenarios of future climate change based on varying degrees of societal progress in reducing human contributions to greenhouse warming.

Documents

A wide range of documents and reports on statewide climate change issues including the author(s) or publishing agency, a pdf download option and where available a corresponding website URL. The first document itemized –  a document central to the launch of the site – is  Responding to Climate Change In New York State: The ClimAID Integrated Assessment for Effective Climate Change Adaptation in New York State: Final Report (2011) which provided information on climate change impacts and adaptation for eight sectors in New York State: water resources, coastal zones, ecosystems, agriculture, energy, transportation, telecommunications, and public health.

The 2011 ClimAID report is one of the first comprehensive and definitive compilations on the many challenges on impacts of climate change across New York State.

Summary

NYCCSC is a huge repository of geospatial and other content focusing on the ongoing and constantly evolving Empire State climate change issue being made available by a wide range of publishers including governments, academia, nonprofits, and industry.     And whereas much New York State climate change focus in recent years has concentrated on the impacts to our coastal communities (i.e., due to sea level rise, hurricanes/severe weather events, storm surges –  much of which is included in the repository), NYCCSC offers content and case studies covering the entire New York State footprint.   Sometimes, however, the scale of the data associated with individual sites can be an issue when looking at issues at the local level.   But nonetheless the data is there.  Itemized websites are always a good starting point for metadata, individual dataset downloads or access to public facing REST endpoints.  .

It takes a considerable amount of effort and oversight to keep such online clearinghouses up-to-date and to this end NYCCSC is fortunate to have an ongoing relationship with NYSERDA for continued support of the project.  NYCCSC continues to welcome submissions but does not accept every resource that is submitted. At the bottom of the site landing page there is a button labeled “Propose Content” which provides access to a form in which content can be proposed.

Contact:

Ingrid H. H. Zabel, Ph.D.
Climate Change Education Manager and Curator, New York Climate Change Science Clearinghouse
Paleontological Research Institution, Affiliated with Cornell University
(607) 273-6623, ext. 122
info@nyclimatescience.org
nyclimatescience.org