
I really did start a conversation with Brian Webster at Wireless Mapping regarding an article for eSpatiallyNewYork. It was my intent to begin a discussion on the use of geospatial technology in the telecommunications and wireless engineering space. Turns out the discussion ended up aspiring Brian to author a detailed article for his own blog which provides much more detail clarity than I could ever produce. Which makes it easy for me – I’m going to send you to his post.
An initial focus of his company was in mapping of broadband internet availability. Using GIS technology, the company provides clients with maps showing broadband internet availability down to the census block level on a local, statewide or national basis. These analysis are further quantified by the type of services available, number of occupied households in each census block, and market penetration rate. For those businesses shifting to an internet based marketing program such as social networks, knowledge of where the broadband customers are located is a key factor to future successful marketing campaigns.
His more recent work focuses on a paradigm shift of designing carrier networks based on mobile metrics generated from smart phones vs. traditional fixed metrics such as demographics and/or traffic counts tied to specific roadways, among others. Today’s smart phone applications gather significant location based information which can be compiled and used in such a way to be able to show high and low “user” traffic areas. Taking this information and converting it to easily understandable formats such as heat maps, it is easier to visualize society’s mobility, where the heavy traffic areas are, where people work, and where they spend their free time. Smart phones use show the more heavily used portions of existing mobile carrier networks and moving forward such data can be used to aid in planning new carrier networks – particularly in the emerging 5G arena.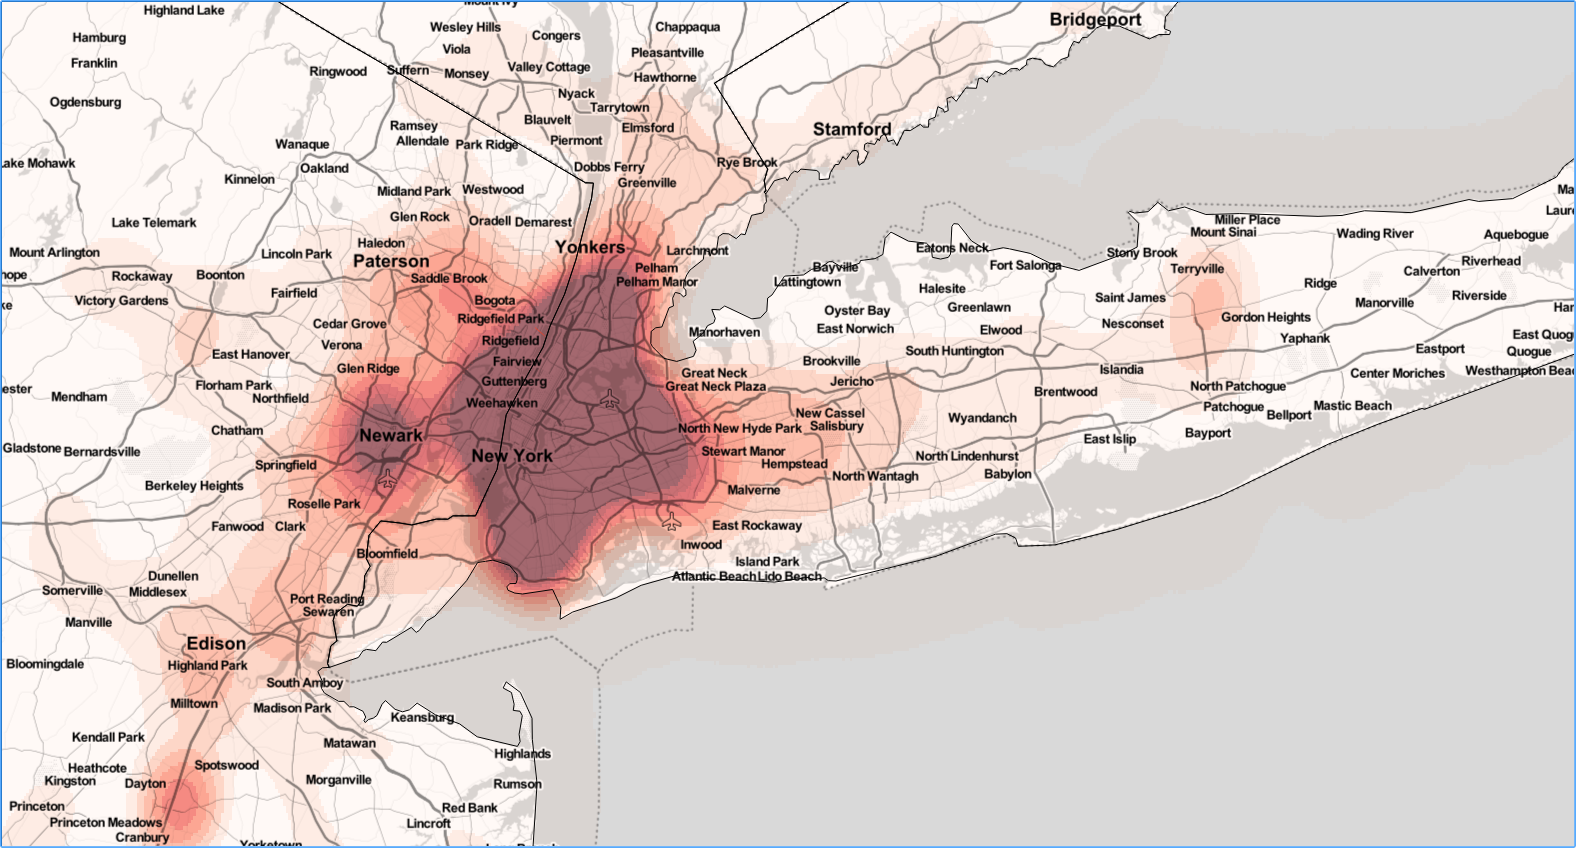
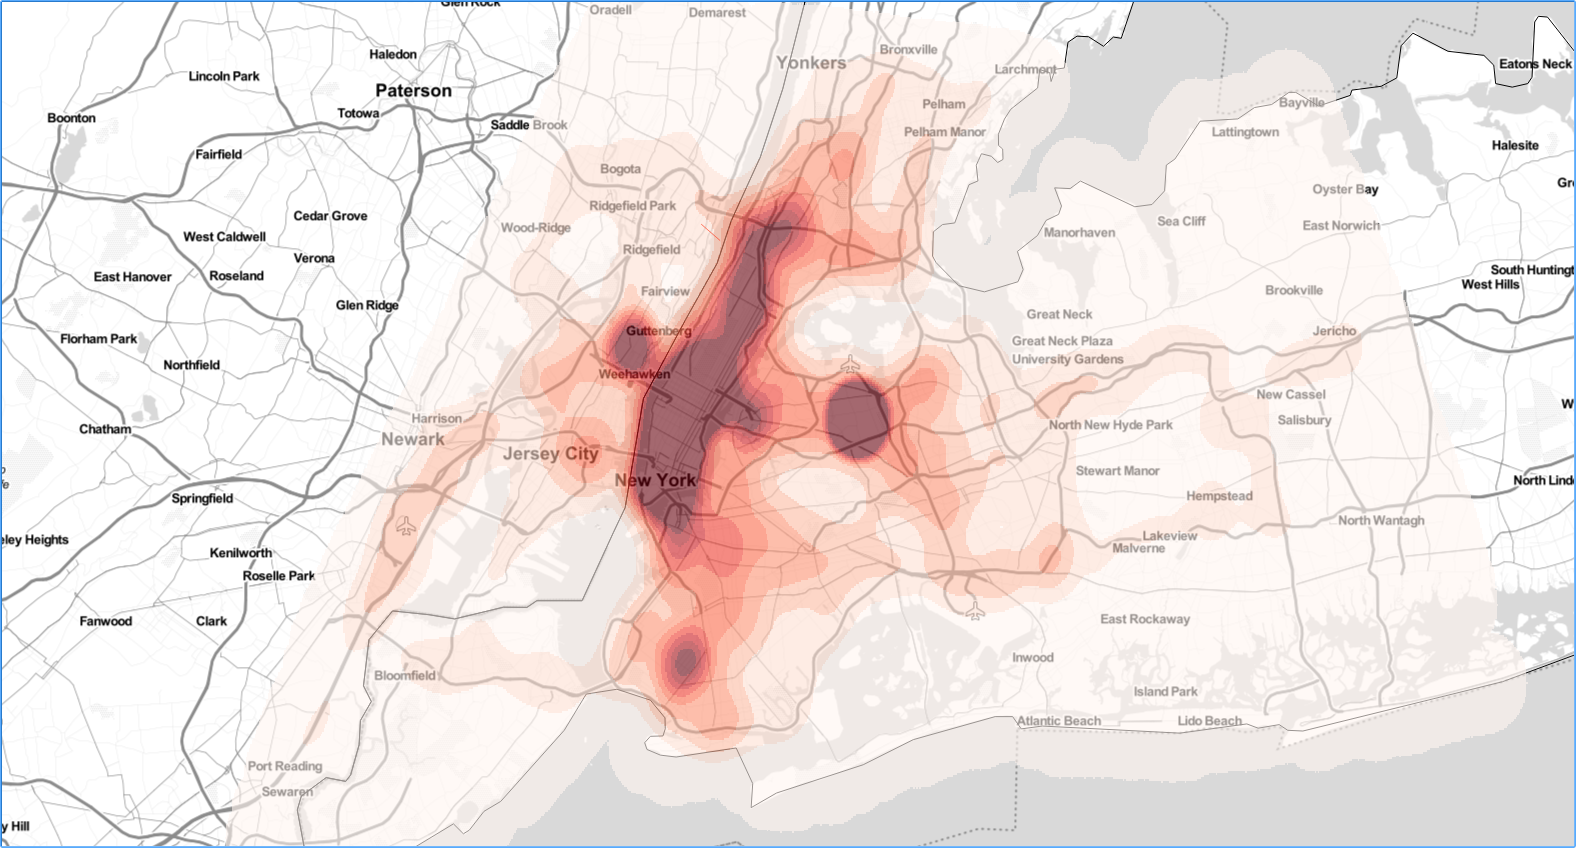
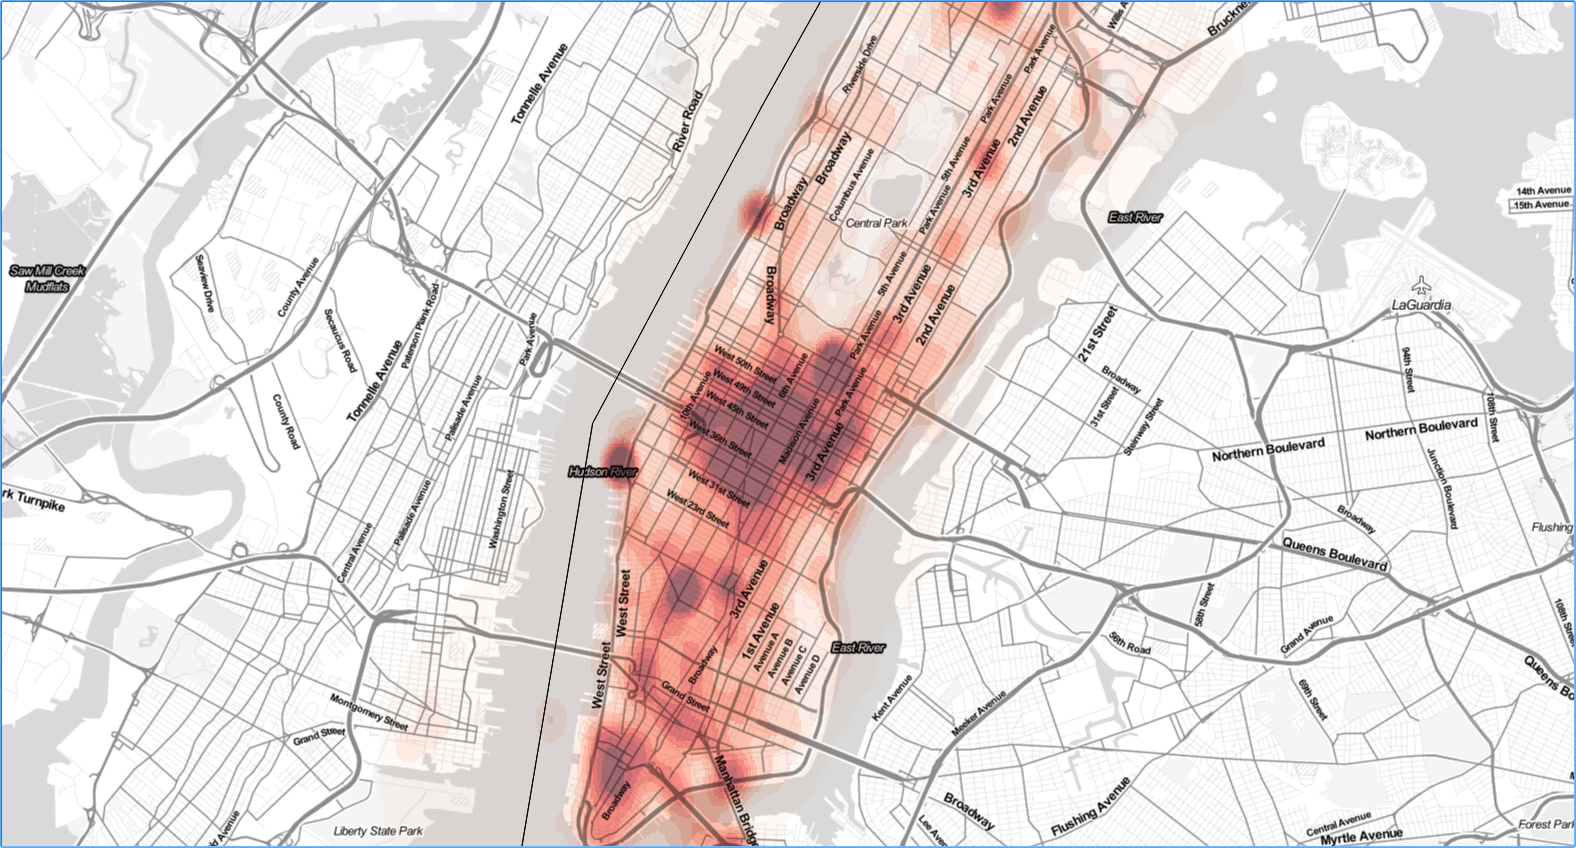
This series of maps, generated by Wireless Mapping, show cell phone data for the greater New York metro area (nearly 10 years of data through December 2017) changing in granularity when looking at more focused regions such as the five boroughs and then just Manhattan. The smallest level of detail show where network capacity needs to be addressed and will be the areas where carriers will be targeting first for 5G deployments.
For a more detailed discussion on the use of smart phone data use and GIS and their potential use in designing the 5G carrier networks, visit Brian’s July 12th post. You can also follow his other work in areas of radio frequency (RF) system design, business analytics, mapping, data mining, telecommunications and wireless engineering by using links available as part of the blog post.