Academic Institution:
Hunter College New York City
Department of Geography and Environmental Science
M.S. Geoinformatics (June 2021)
Virginia Tech Blacksburg, VA
School of Public and International Affairs
B.S. Environmental Policy and Planning (May 2010)
Research Focus:
Ward’s graduate research at Hunter College focuses on the expanding use of Augmented Reality (AR) in the geospatial disciplines with a particular interest in supporting civic and public engagment. AR is an interactive experience of the real-world environment where the objects that reside in the real world are enhanced by computer-generated content and perceptual information. His research inspired by spatial AR research and development work at companies such as Google and ESRI.
Ward’s work was recently highlighted and included in the 2022 NYC OpenData Week which included augmenting street level imagery with the NYC PLUTO database which offers over 70 data variables at the tax parcel level. Built on the WebXR standard, the web app leverages the THREE.js graphics library with files and front-end hosted on Github and the data on a Heroku Postgres cloud platform. The code repository and web app is available on Github. A short demo of the application can be seen here.

Cubes represent PLUTO centroids along the street face. The magenta cube is the one currently selected by the user and provides current PLUTO information of the selected parcel in the upper left hand corner of the screen. Cyan cubes represent other available PLUTO centroids for query.
Ward’s smart phone app is now available (iOS and Android) here for entire NYC footprint. Additional documentation and instructions are available on his GitHub repository.
Selected Additional Geospatial Projects
Gerrymandering Web Map
Ward performed a series of analyses on the proposed plans by the New York State Independent Redistricting Commission (NYRIC) based on data related to the 2020 census. Because the Commission couldn’t agree on a single draft plan, the bipartisan members drafted two plans. Two of the analyses are shown below (References to the “Names” (Republican)”vs “Addresses” (Democrat) Plans are from the New York State Senate District plans submitted by the NYIRC.
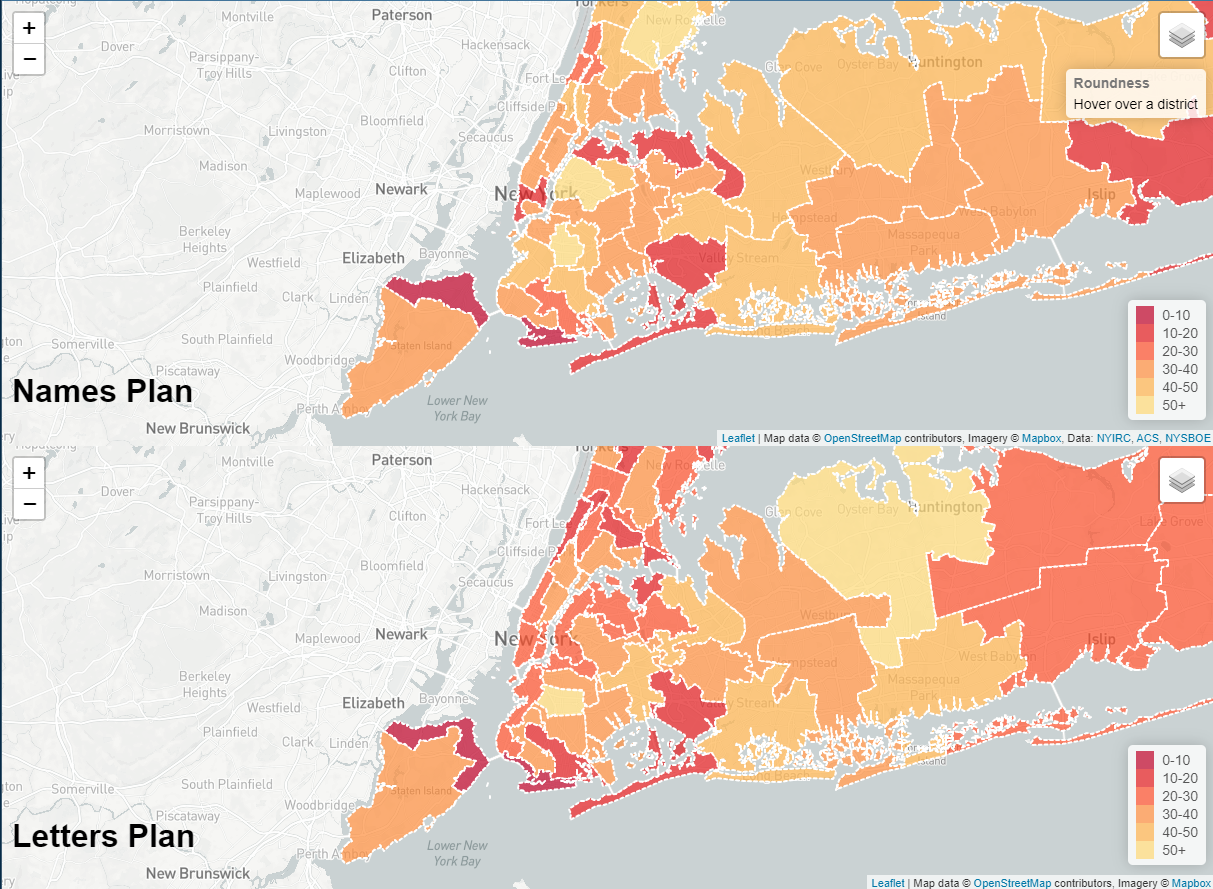
The image above (from a web map) is a test of “roundness” (aka the Roeck test [1961]). In general, rounder districts will have a higher Roeck score and oddly shaped or districts that are wider or longer (darker shaped districts) will receive lower scores. Although not a perfect assessment of gerrymandering, the Roeck test offers good comparison between district shapes.
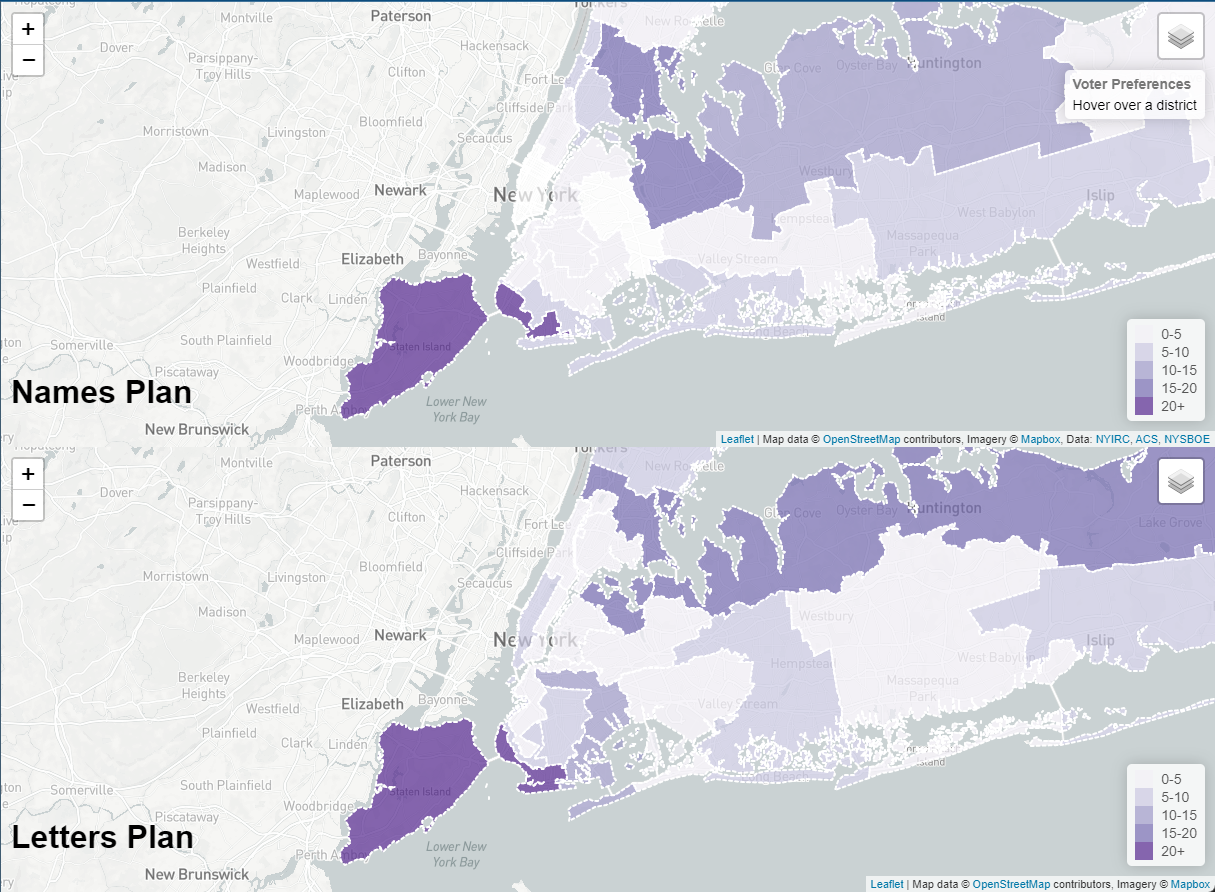
Another test done by Ward was comparing the average voter party tilt of a district to its neighboring districts (darker purple districts are more unlike their neighbors). Metro NYC shows what could be considered large areas of voter homogeneity.
An map of an additional analysis is included with Ward’s paper (available here) summarizing this research work and findings. The third review looked at identifying those proposed senate districts which had at least 30% minority group population (African-American, Asian, and Hispanic/Latino populations were used). Such districts are almost entirely located in New York City, with some inclusion of parts of Nassau county. The research paper includes a comprehensive list of all data used in the gerrymandering analysis. A “live” interactive version of the web mapping app can be accessed here. The three different analysis for each plan (Names and Letters) can be viewed by clicking the layers button in the upper right hand corner of the viewing window. (Designed for desktop viewers not smartphones.)
Crime Modeling Across NYC
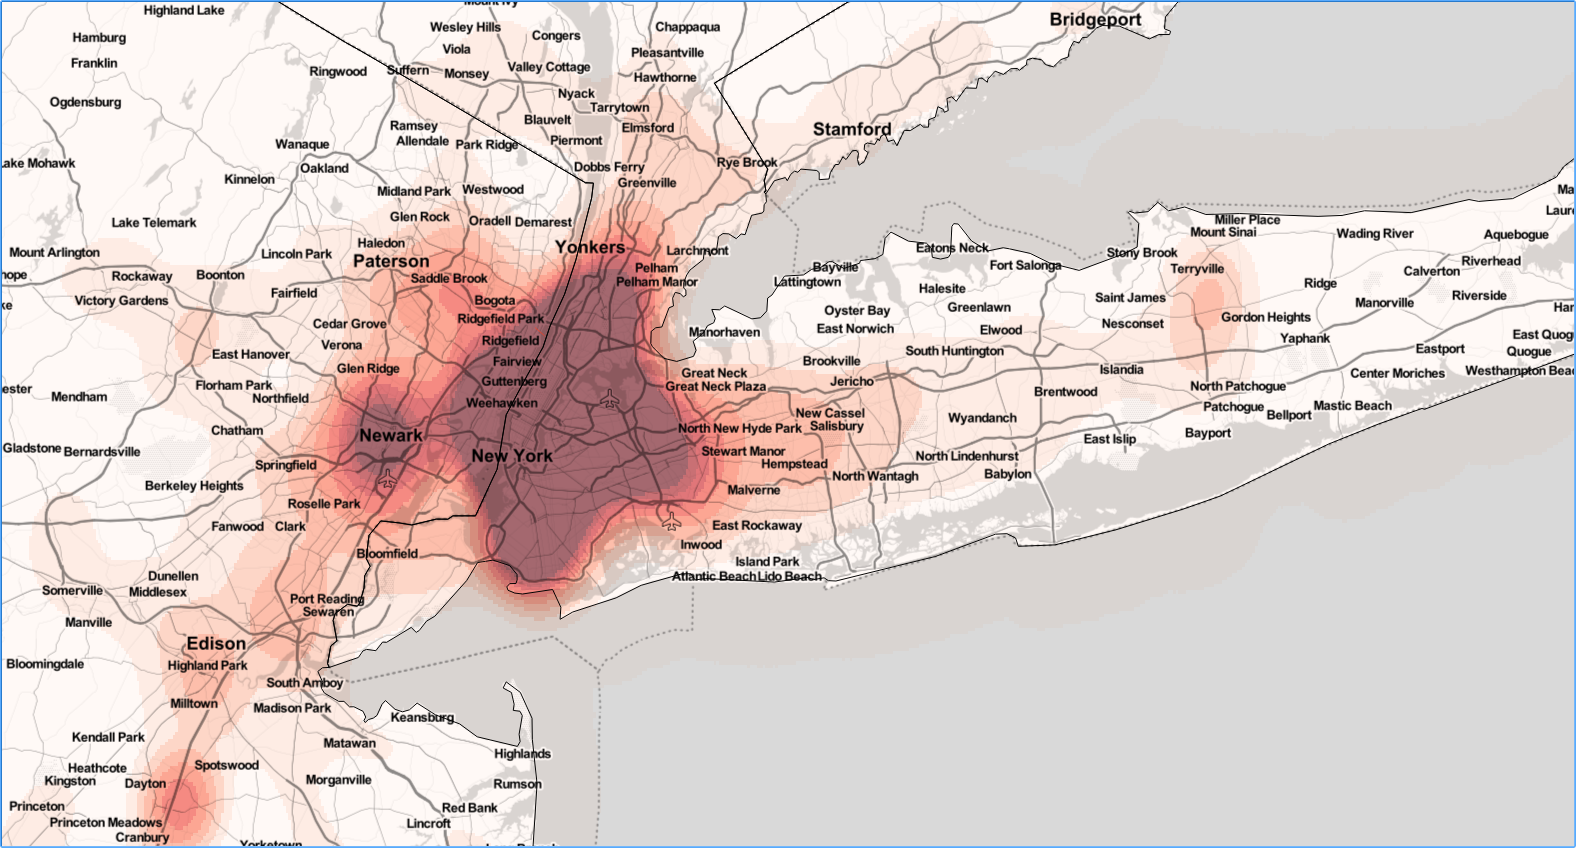
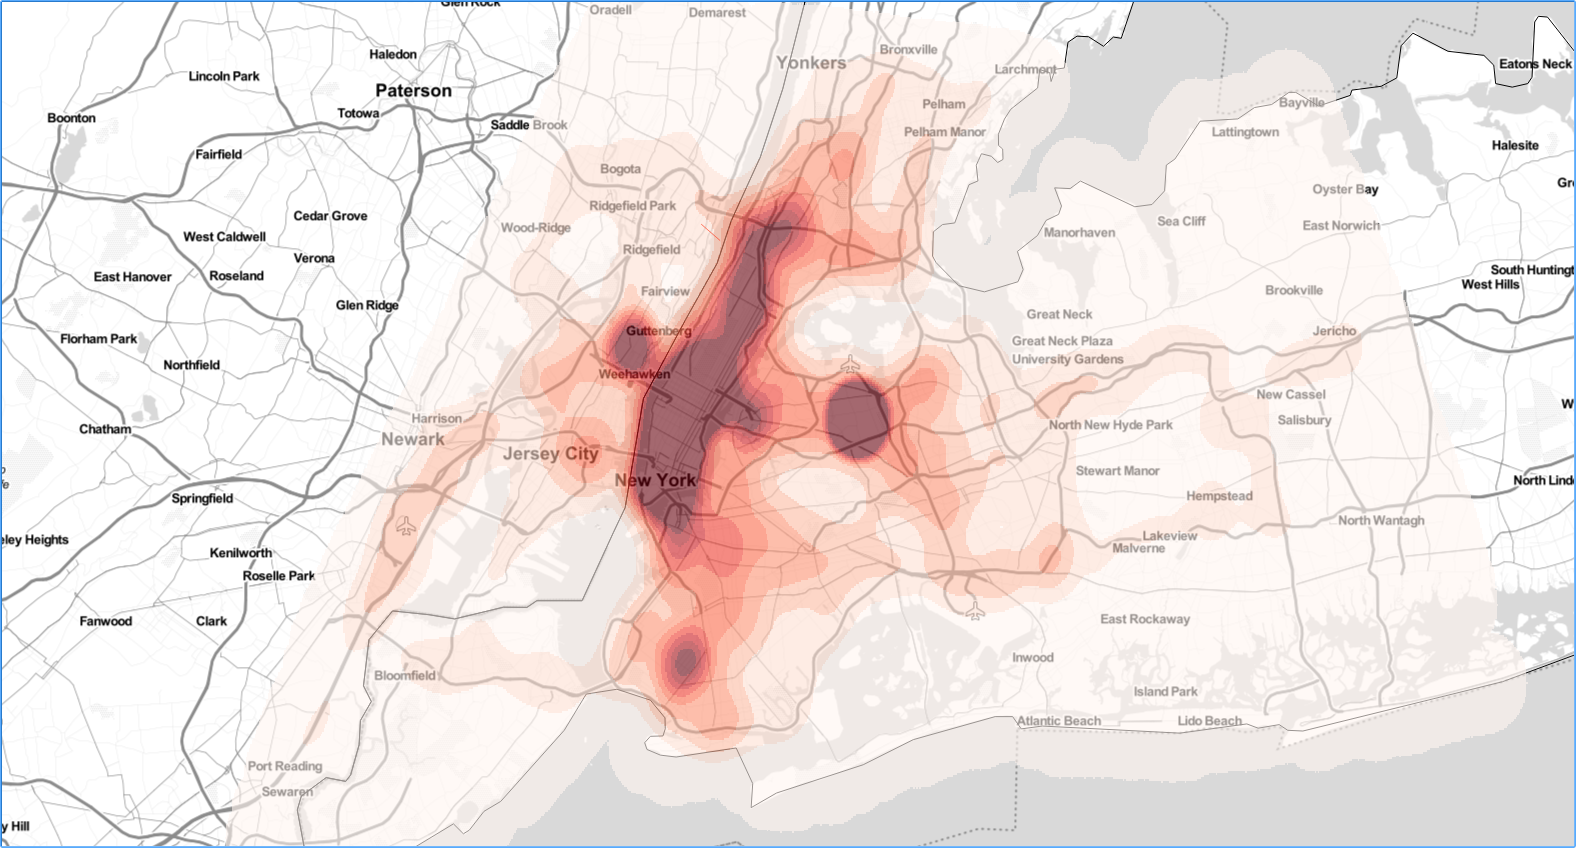
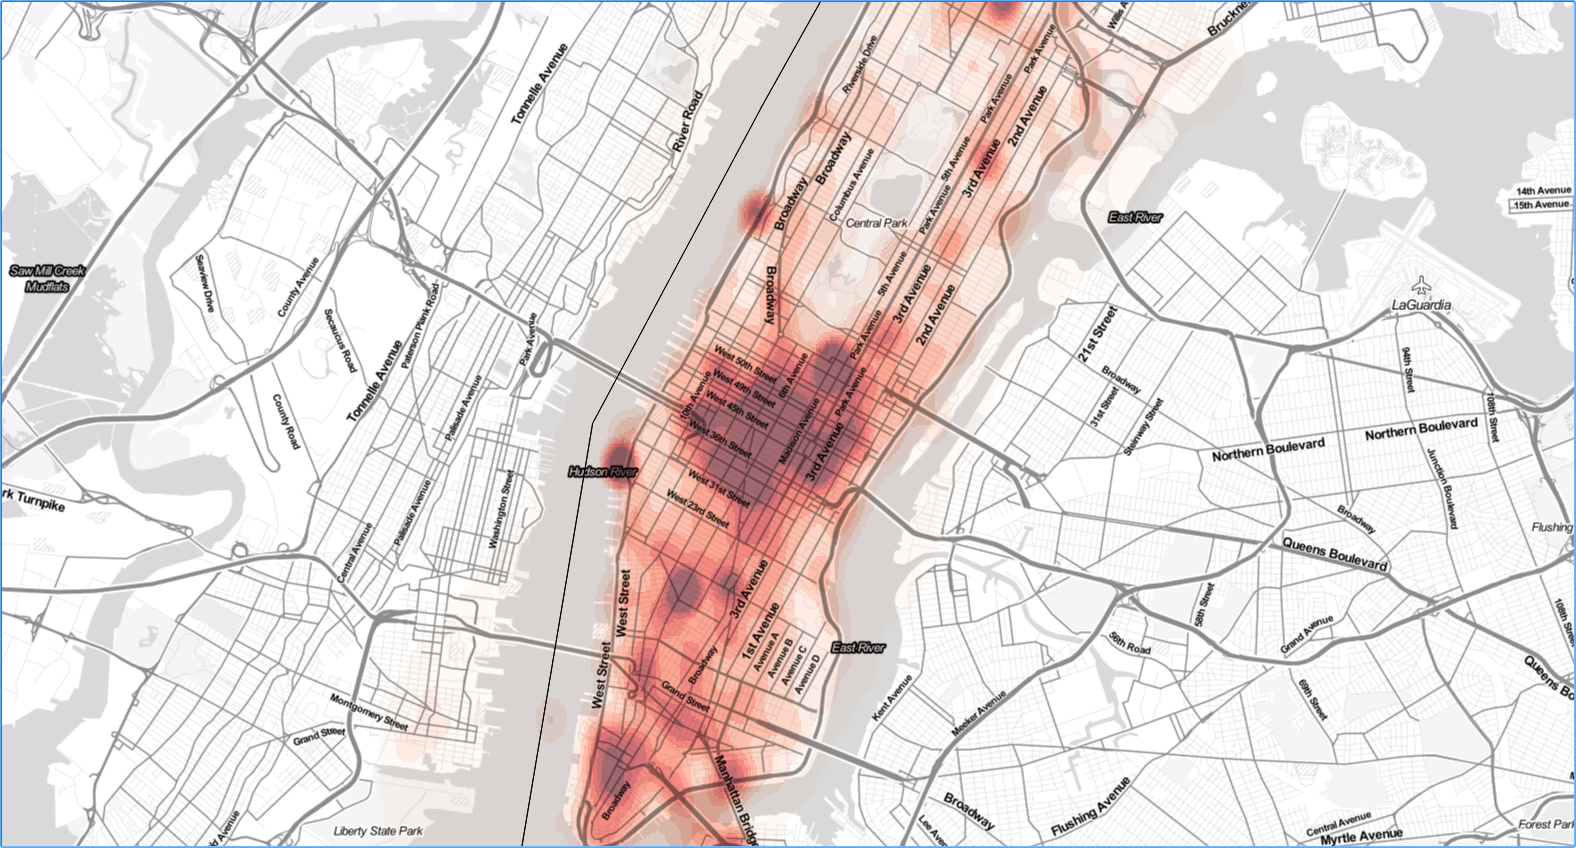
Ward’s graduate coursework also included developing a crime view modeling viewer (below) based on NYC OpenData reported crimes for 2019. Selected violent crime types were analyzed. He developed an even square grid to cover the citywide footprint so as to render the spatio-temporal nature of the data. Crimes that occur are tracked in space and time within those squares. Data is associated with corresponding police precinct building addresses (how the data is made available through OpenData – not necessarily the exact crime location).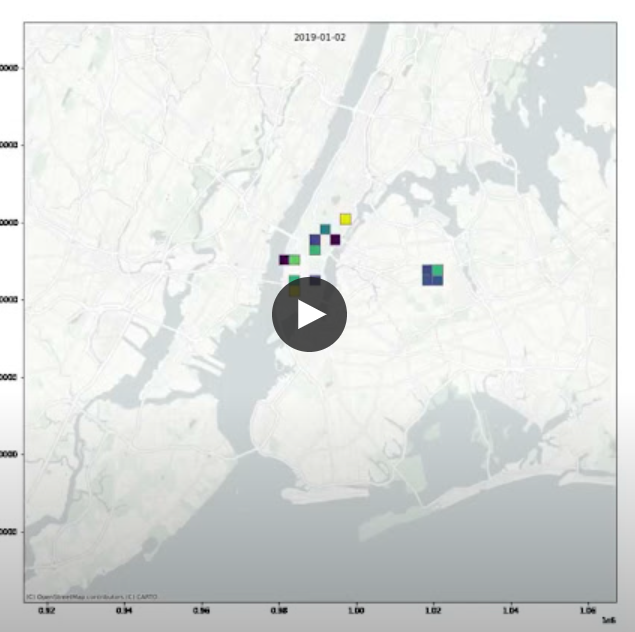
The data is for all of 2019 but each day of the model (365 days total) is rendering the three weeks of crime leading up to that day to predict ‘likelihood’ of crime going forward. Darker purple is an application “indicator” of where more violent crimes may occur based on the historical data. Yellow grids meaning less likely than purple. No color means no spatio-temporal connections in crimes or no crimes. Click here to run the video.
Summary:
The Hunter College Masters in Geoinformatics (MSGEOi) focuses on the growing demand for emerging professionals trained in the collection, organization, analysis, and dissemination of geospatial data. Matthew Ward’s graduate work is illustrative of this as it intersects developing analytical methods and visualizations of large geospatial datasets.
After school, Ward is interested in applying his work and research in the public or government space. “I see the great power of combining open source technologies and open data portals for empowering local users with AR technology, he notes. “For example, there are so many types of uses in helping the public visualize utilities and the public infrastructure or in environmental applications.”
Augmented reality is no doubt a rapidly expanding and growing technology in the geospatial arena.
Contact:
Matthew Ward
Graduate Student
Hunter College, City University of New York (CUNY)
Department of Geography and Environmental Science
MATTHEW.WARD14@myhunter.cuny.edu
Dr. Sean Ahearn
Professor & Director, Center for Advanced Research of Spatial Information (CARSI)
Department of Geography and Environmental Science
sahearn@hunter.cuny.edu