Here in southeastern New York State, it’s amazing how fast the COVID wave came and went. At first, mid-March to mid-May seemed like an eternity, but now, not so much. I likened the preparation for COVID to preparing for Super Storm Sandy. Albeit phenomenally different, the buildup and the anxiety of waiting for it to show up. Peering out the windows to see the outcome of a completely different kind of damage and suffering altogether. Physical and psychological. Now July, it seems and feels like we can see the first wave of the pandemic in the rear view mirror. But then as we refocus on the road in front of us, we know there are speed bumps ahead of us. Not if, but when.
There were a plethora of interesting and meaningful geospatial viewers created across the state during the mid-March to mid-May time frame. Most included highlighting COVID case numbers by larger units of geography (municipal or zip code boundaries), generalized heat or pattern maps, impacts to businesses and institutions, as well as information on hotlines and sources of assistance. However, its pretty well documented the geospatial community across the state has struggled with being part of providing detailed spatial analysis or mapping support functions at the address level. Or for that matter, even being asked to participate in this regard.
Personal health related data is uber protected with its use regulated and governed by the Health Insurance Portability and Accountability Act (HIPPA). HIPPA regulations reign supreme and contributed to a lesser involvement of GIS analysts in providing geospatial content, metrics and analytics during the pandemic. There is also the unspoken reluctance on the part of the public health community to release data sets which might be difficult to understand or easily misinterpreted by the general public. Department of Health professionals often cautious to release data – particularly in new instances such as the COVID pandemic – and leaving analysis/interpretation to internal professional staff only. Ultimately though, releasing some flavor of the data but in a more generalized context.
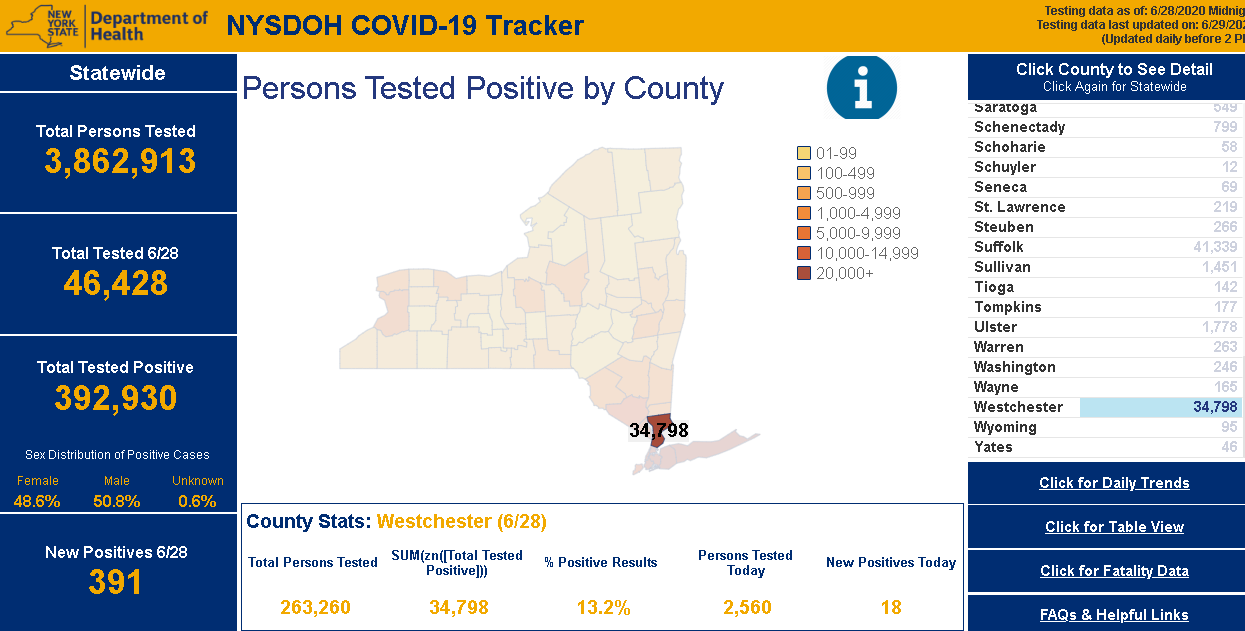
NYS Department of Health (DOH) COVID-19 reporting has improved dramatically since the pandemic appeared in March. Though while numbers are made available only on a county basis, users can access and visualize the data in a variety of ways. Reporting and posting of the data has become much more timely. DOH is also now publishing a regional “Early Warning Monitoring Dashboard“.
Advocacy Efforts
The issue hasn’t gone unnoticed across the region and New York State. On June 10th, Al Leidner, current President, NYC GISMO and past President, NYS GIS Association, made a presentation to the National Geographic Data Committee (NGAC) which focused on and summarized the concerns of MetroNYC GIS leaders and managers on the lack of COVID geospatial applications based on address level data. An excerpt from his presentation (the entire document can be downloaded here) includes:
“With COVID-19 we are seeing disturbing problems with the use of GIS. Health departments at the state and local level are using case data aggregated to zip code areas because they have been unable or unwilling to capture precise address information digitally and to then geocode it. Moreover, they are not reaching out to GIS experts in other agencies for help. GIS is being used for logistics support and to locate facilities; but precision mapping of the outbreak is rarely being done.”
For the record, its not entirely a geocoding problem. In fact, many COVID records are being scrubbed and geocoded properly but the data is not being shared or made available for the reasons noted above. However, given the enormity of the pandemic and the many moving pieces which impact the spread and/or its containment, it is more likely in the short term, maybe even long term, the generalization of addresses to larger units of geography, i.e, census blocks or block groups, will be the norm for analysis and to help guide recovery efforts.
Albeit not specific to the “lack of access” to address issue, on June 23rd, the National Alliance for Public Safety GIS (NAPSG) hosted the Open Community Forum: COVID-19 Technology & GIS Hot Wash Series highlighting lessons learned and showcasing selected government programs across the country which have been able to demonstrate successful and measurable geospatial COVID- related programs. Hesitant at first, I was particularly impressed with the collaborative work of both the City and County of Boulder, Colorado in this regard. A model to aspire to in those areas – including New York State – where the COVID pandemic has exposed issues in the sharing and accessibility of address and parcel level geospatial data across intergovernmental program areas.
With the significant presence of County GIS programs across Empire State in this space, particularly in the roles of maintaining parcel geometry and address data, to say the least of the role of County health departments which essentially act and serve as agents of the NYS Health Department, the involvement of high-level governing County organizations is essential as part of the discussion – and decision making. Illustratively, such organizations include the National Association of Counties (NACo) and it’s New York State (NYSAC) affiliate or the National Regional Association of Councils (NARC), and it’s New York State (NYARC) affiliate – which represents many NYS counties. Even the Appalachian Regional Council includes several NYS counties. And lest not forget the participation or input of the New York State Association of County Health Officials (NYSACHO).
Other Geospatial Opportunities Abound
And while gaining access to COVID address level data has been and continues to be a major point of discussion within the Empire State GIS community, many other geospatial opportunities have emerged particularly with regard to supporting community service and outreach programs. Here in Westchester County, we have seen a tremendous growth in the interest and use of GIS mapping among nonprofits and community groups and the COVID pandemic has only heightened interest and access to the technology. It is an important space as many of these organizations fill unique roles in the health and human services network and augment many government sponsored and funded programs.
Leveraging ESRI’s NearMe application, illustrative Westchester County GIS applications either in use or in development in this regard include:
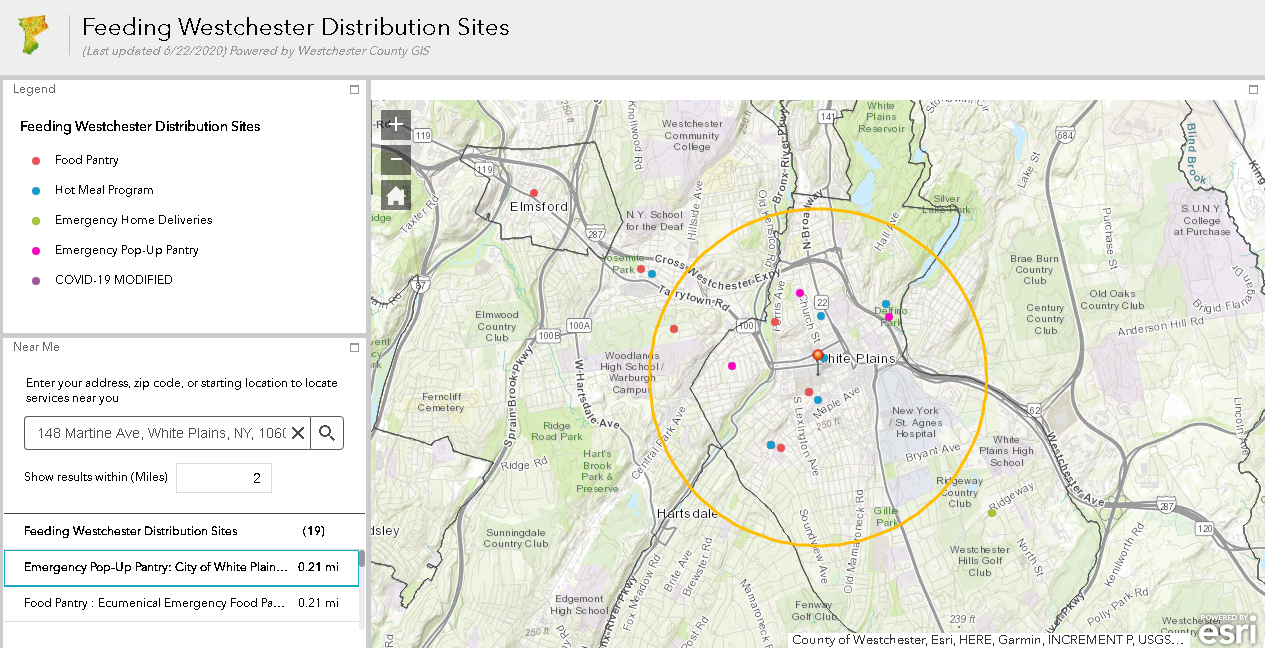
As a member of the Food Bank Association of New York, Feeding Westchester serves nearly 200,000 people each year supplying 95 percent of all food distributed annually across the region’s food pantries, soup kitchens, shelters, and daycare and residential programs. Delivering over 9.3 million pounds of food and 7.8 million meals to people in 2018. This COVID specific application enables users locate the nearest Food Pantry, Hot Meal Program, and Emergency Food Delivery. Due to the pandemic, many events are changing on a weekly basis and are also included in the map. Similar to all other NearMe apps, users can set their own search radius and from any location (address). Feeding Westchester expertly sources and distributes food in every municipality in Westchester County.
Child Care Council of Westchester
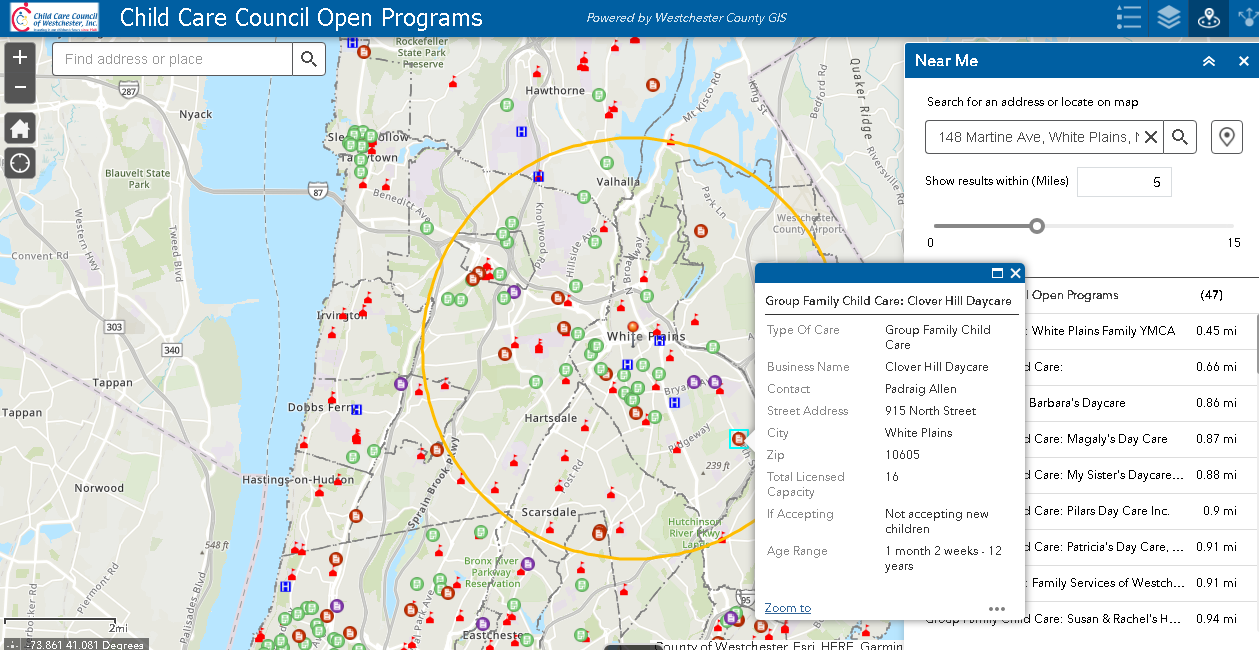
This soon to be launched viewer is in support of the Child Care Council of Westchester. “New York State on PAUSE” created numerous issues in the child care industry resulting in parents with few options in finding services. With child care facilities slowly reopening across the County, the Council approached Westchester County GIS to publish a map showing availability of facilities across the county highlighting opened/closed status, accepting new children (yes/no) and other contact information. The application provides a candidate list based on a user defined search radius. At larger scales the application also shows the locations of medical facilities, public transportation network, and information on educational facilities – all important features connected to the child care network
Vulnerable Populations and Neighborhood Services
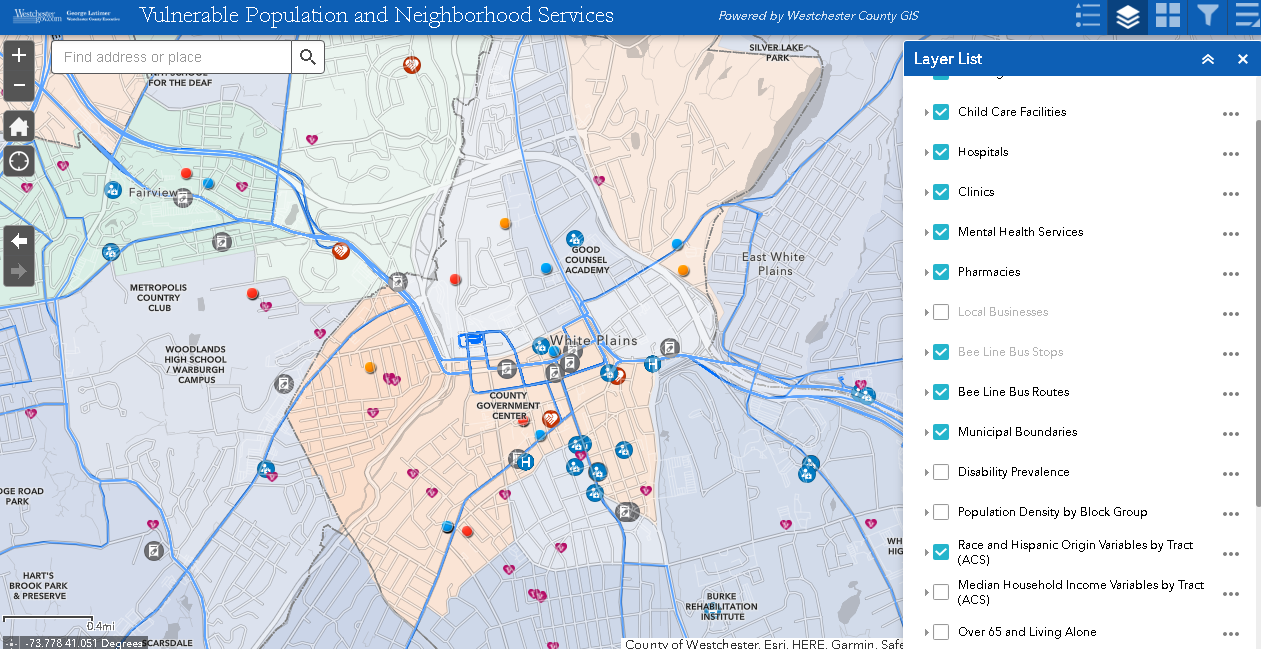
This application originally started out in discussions with a liaison to the county’s Hispanic community but was later expanded and generalized to “vulnerable” communities – much of which has already been the focus of COVID-related mapping across the county. (Here’s an ESRI COVID Vulnerability StoryMap). This application will be shared with community groups in helping identify services at the neighborhood level: Health care providers, urgent care facilities, pharmacies, public transportation infrastructure, demographics on minority populations and senior citizens, and other human service programs. It is anticipated COVID case data will ultimately be generalized to census geography to highlight areas of greatest need and focus.
Faith Based Services
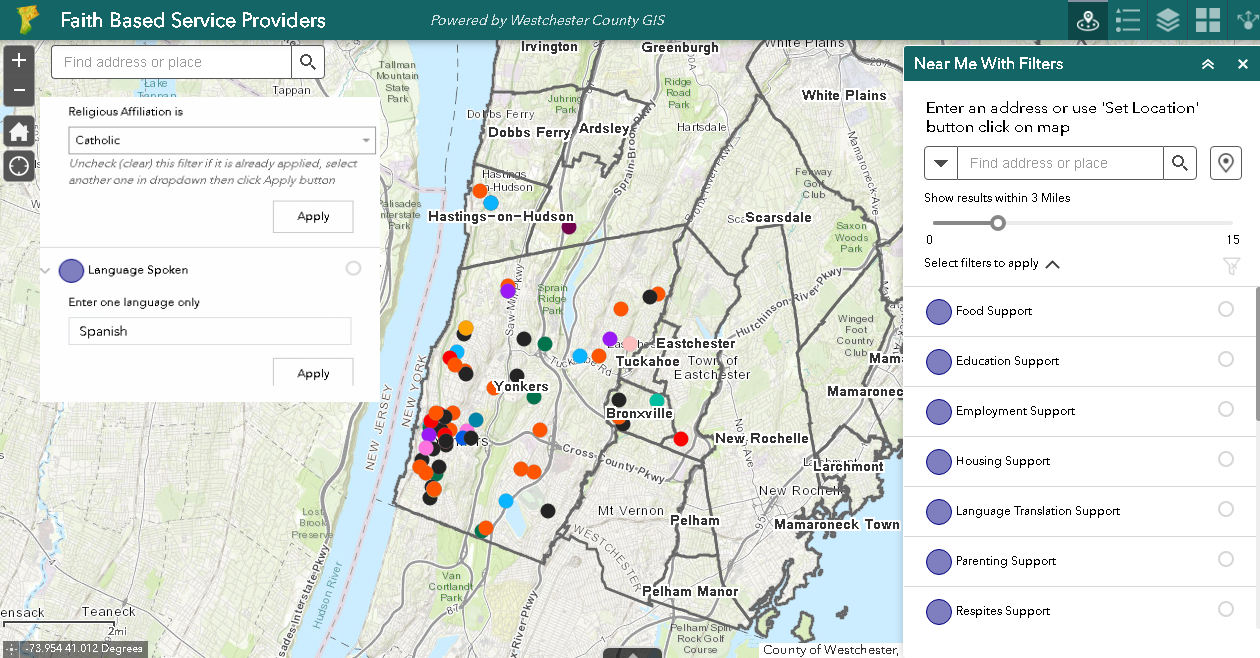
While not a specific result of the COVID pandemic, Westchester County GIS had already started discussions with the County’s Department of Social Services and United Way of Westchester and Putnam in identifying faith-based organizations which provide certain types of counseling and family services. With the social services support network at already near capacity, these programs s are increasingly being utilized in the support network. The image above has been modified to show that this NearMe application allows users to filter the database on service type (right hand column) as well as by Faith and Language spoken. While this Yonkers-based example is still just a prototype, it is expected the program will be launched as part of the other COVID recovery geospatial applications.
Summary
Even without having access to address specific COVID data, there are many opportunities for government GIS programs to participate and in providing support to our communities. The need is great – particularly in the health and human services and with organizations with limited technology capacity. Governments often already have relationships with nonprofits and community groups and in many cases have specific liaisons to work closely on mutual business needs and to help facilitate the collaboration.
It’s a great time to jump in and provide this geospatial leadership.