Here in southeastern New York State, it’s amazing how fast the COVID wave came and went. At first, mid-March to mid-May seemed like an eternity, but now, not so much. I likened the preparation for COVID to preparing for Super Storm Sandy. Albeit phenomenally different, the buildup and the anxiety of waiting for it to show up. Peering out the windows to see the outcome of a completely different kind of damage and suffering altogether. Physical and psychological. Now July, it seems and feels like we can see the first wave of the pandemic in the rear view mirror. But then as we refocus on the road in front of us, we know there are speed bumps ahead of us. Not if, but when.
There were a plethora of interesting and meaningful geospatial viewers created across the state during the mid-March to mid-May time frame. Most included highlighting COVID case numbers by larger units of geography (municipal or zip code boundaries), generalized heat or pattern maps, impacts to businesses and institutions, as well as information on hotlines and sources of assistance. However, its pretty well documented the geospatial community across the state has struggled with being part of providing detailed spatial analysis or mapping support functions at the address level. Or for that matter, even being asked to participate in this regard.
Personal health related data is uber protected with its use regulated and governed by the Health Insurance Portability and Accountability Act (HIPPA). HIPPA regulations reign supreme and contributed to a lesser involvement of GIS analysts in providing geospatial content, metrics and analytics during the pandemic. There is also the unspoken reluctance on the part of the public health community to release data sets which might be difficult to understand or easily misinterpreted by the general public. Department of Health professionals often cautious to release data – particularly in new instances such as the COVID pandemic – and leaving analysis/interpretation to internal professional staff only. Ultimately though, releasing some flavor of the data but in a more generalized context.
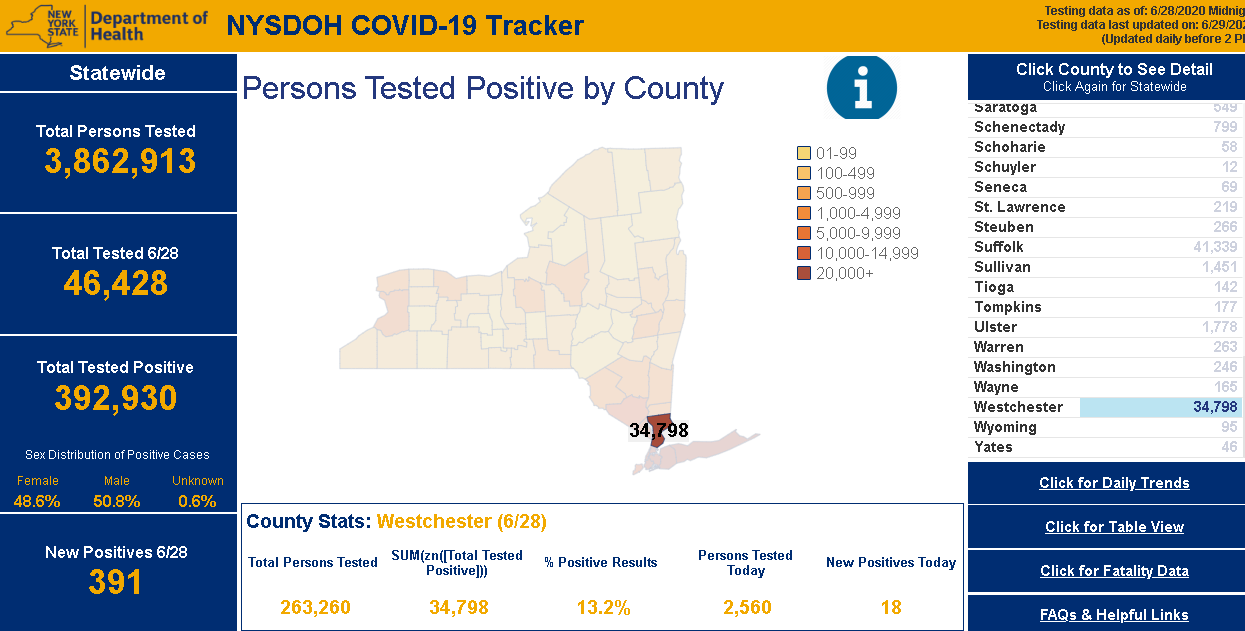
NYS Department of Health (DOH) COVID-19 reporting has improved dramatically since the pandemic appeared in March. Though while numbers are made available only on a county basis, users can access and visualize the data in a variety of ways. Reporting and posting of the data has become much more timely. DOH is also now publishing a regional “Early Warning Monitoring Dashboard“.