Introduction
A rare treat in eastern upstate New York, mostly in the Adirondacks, although sometimes in the Taconic Highlands along the Massachusetts and Vermont borders and within the Catskills, is to see moose in the wild. Moose (Alces alces) are the largest member of the deer family (Cervidae) and the largest land mammal in New York State. Having been absent from the Empire State since the 1860s, the species began to reenter the state on a continuous basis in the 1980s. While re-establishment of the moose population in New York has been viewed and supported as a positive sign of a healthier, more complete natural ecosystem, it does not come without a range of potential problems associated with their return and the need for proactive management and monitoring by New York State Department of Environmental Conservation (DEC) wildlife biologists and researchers.
So in 2020 it should come as no surprise that wildlife biologists in New York State – and around the world – are using geospatial technologies to support their work. In addition to estimating moose population size, New York’s wildlife biologists and scientists also focus on improving moose survival and reproductive rates and to assess their diet and health. Assisting the DEC’s work towards researching moose habitat and resource requirements is David W. Kramer, Research Scientist, in the Division of Fish and Wildlife. The toolkit which augments his moose research includes a mixture of GPS, remote sensing imagery, a variety of GIS data layers, and both ESRI and “R” software. R being a free, open source software package for statistical computing and graphics commonly used in the research community.
Population Counts and Observations
To date, Mr. Kramer and colleagues have been observing the locations of 26 moose which were collared with either a Lotek or Telonics GPS unit which can store data “on board” the collar that can then be retrieved by getting the collar back or by getting close enough to the moose to download the data to a receiver. “Uplink” collars can store data on the collar as a backup, but also send daily data uploads via satellite and are then stored online. Moose are captured (to put the collar on) by a crew which “net-gun” the animal from a helicopter. For their research, DEC staff focuses on female moose (cows) for two reasons: (1) wanting to track of how many offspring each cow has; the collars facilitate the “following” of the females in the summer to count calves, and (2) male moose (bulls) go through physiological and body changes during the same period that do not make the collaring of males practical or even unsafe. Data associated with the collars are important in analyzing survival and calving success as well as the geography associated with habitat selection.
Moose are also observed via aerial surveys. Winter aerial surveys (2016-2019) resulted in a NYS Department of Environmental Conservation’s (DEC) estimate of the Adirondack moose population of approximately 400 animals. As part of the process, survey crews also identify the geographic location, determine age and sex of each animal, and record general habitat characteristics.
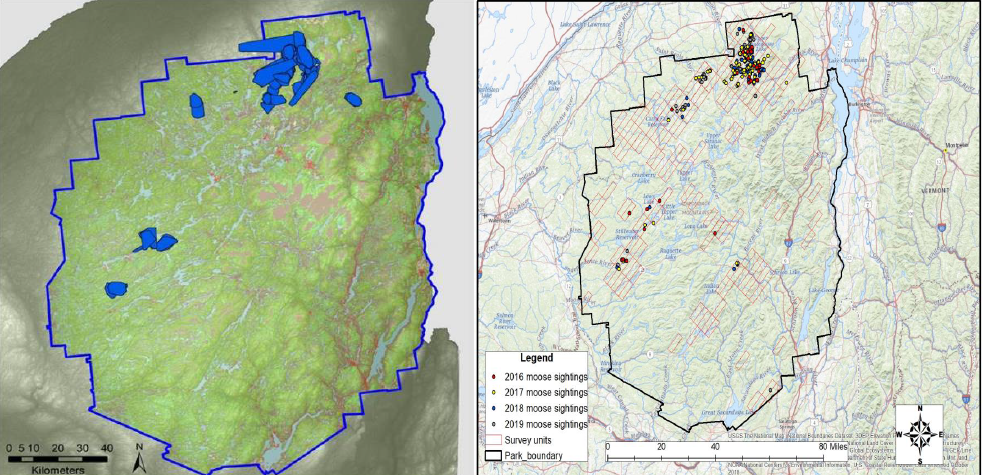
On the left, blue polygons representing home ranges of GPS collared moose in Adirondack Park. Image on the right includes state aerial observation counts of moose 2016-2019. (Image courtesy Dr. Joe Hinton, SUNY-ESF).
Habitat Identification
Physical counts and observations of the moose augment Kramer’s work in building predictive models of identifying optimum and preferred moose habitat. Recognizing how important timber treatments are on creating optimum habitat for moose, Kramer and staff use a variety of datasets and geoprocessing tools to locate these habitat areas. Kramer notes “Since mature forest is not optimal habitat for deer and moose, we look for early-successional stands with dense understory forage. This is why our moose population is most dense in areas where timber is regularly being removed, creating young forests.” The regrowth of browse species timber operations offer nutritious food in large quantities needed by moose. The challenge, however, is identifying forested areas which have been logged or treated.
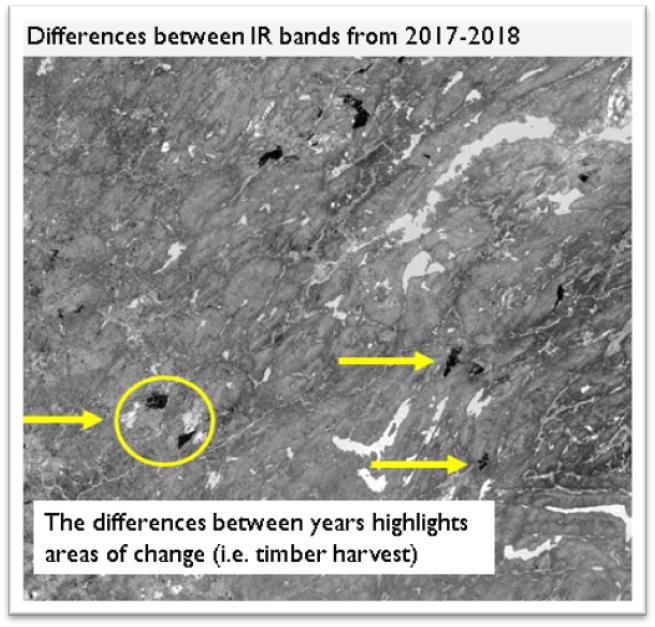 Since timber harvests are not found in traditional National Land Cover Database (NLCD) maps, 2017-2018 Landsat 8 imagery covering the Adirondacks was analyzed and processed to identify and create a predictive timber harvest map using the Normalize Difference Vegetation Index (NDVI) derived from the Landsat bands. These geographic areas were then combined with other known layers such as the Adirondack Park Agency (APA) wetlands, DEC owned lands, and the NLCD (selected land use classifications) using ArcGIS Raster Calculator and Raster Reclassify and the modeling done in R to build the “Master Map” which includes 10 land cover types. (A pdf of a more detailed description and process in developing both the predictive and master habitat maps is available for download here.) Ground truthing is built in to the model process as the moose researchers use timber location data from industry sources such as Landvest and Lyme to periodically calibrate the model.
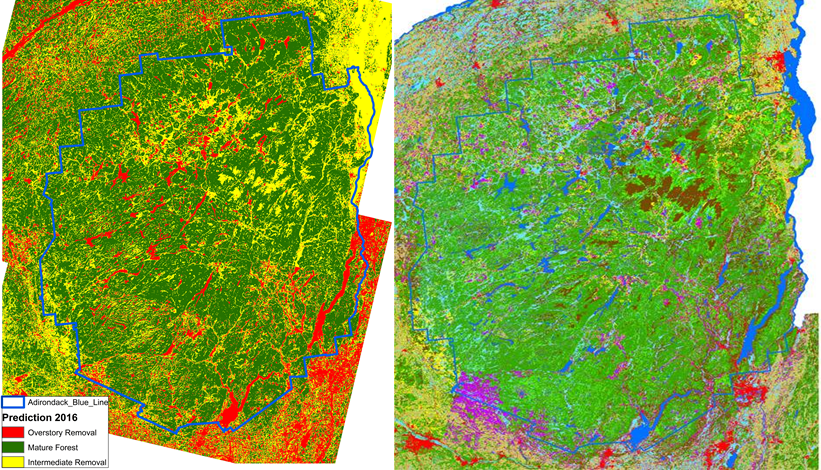
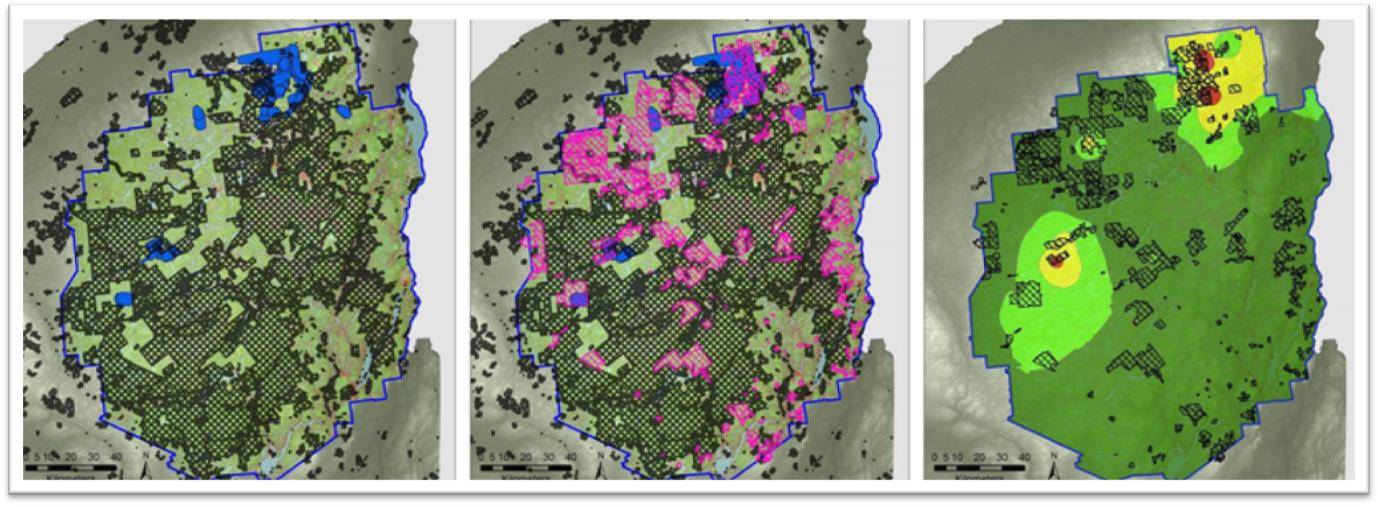
In the Predictive Landsat-based image (left), areas of timber harvest are yellow and red. With over story removals (60%+ stand removal) represented in red and shelter wood removals (30-60% stand removal) in yellow. On the right, the magenta in the Master map are ‘predictive’ timber tracts. Much of the red in the prediction is actually water (blue) in the Master map because of the high reflectance of water in satellite images. Notice the big brown patches (conifer) in the High Peaks area where those continuous patches are some of the largest swathes of undisturbed wilderness in the region.
Analyzing and identifying optimum areas can also include the use of DEC Easement Lands as these lands often have timber management plans tied to the easement. Such timber management easements are considered to have some of the best moose habitat lands in the Adirondacks. In the image below, the first panel includes the blue ranges of the collared moose plus public owned DEC land (black diagonals). The second panel includes private lands that are enrolled in DEC Easements (pink diagonals) – showing that most of the collared moose were on easement land. Finally, the third panel is a kriged map created with ArcGIS Spatial Analyst. “Kriging” is geostatistical interpolation process based on statistics and is used for more advanced prediction surface modeling. This map uses the known points from aerial surveys with red having a higher density of moose, then yellow, and then green having the lowest. In this panel, the black grid is conservation easement land (i.e. the best habitat typically)
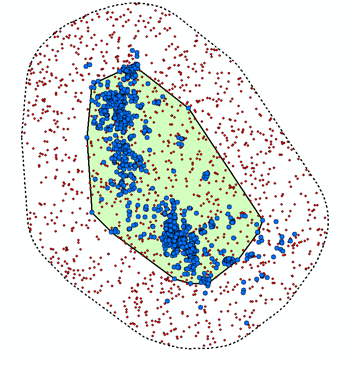
Finally, at a more micro-level, research can be isolated to analyze habitat preferences of just one moose. In the image below, blue dots represent the collar points from just one moose being tracked as part of Kramer’s research. They use a method known as a ‘kernel density estimator using locational data to create the selected moose’s normal habitat range (green area) which is then spatially buffered by 1km to represent an extended available habitat (dotted line). The distance of 1km is used because it is the normal average width of a home range, so it’s within reason that a moose could occupy areas in the extended area if they wanted to.
DEC moose researchers use a modeling approach called a “Resource Selection Function” (RSF) which is a class of functions that are used in spatial ecology to assess which habitat characteristics are important to a specific population or species of animal, by assessing the a probability of that animal using a certain resource proportional to the availability of that resource in the environment. Kramer and staff use R software when applying RSF.
Random points are created in the buffer zone. Using the known points to represent ‘habitat use’ and random points to represent ‘habitat availibility’, they can statistically identify types of habitat that moose preferred.. Identifying preferred habitat helps to inform management decisions for future habitat management practices. Additionally, by identifying habitats most likely to be preferred by moose, DEC can adapt their aerial surveys to ensure that they survey locations which have the best chance in spotting moose.
Summary
Moose are a protected wildlife species in the State of New York and cannot be hunted. Today it is revered as an important large game wild animal. DEC, SUNY College of Environmental Science and Forestry, Cornell University’s Cooperative Fish & Wildlife Research Unit and Animal Health Diagnostic Center, the Biodiversity Research Institute, and the Wildlife Conservation Society Adirondack Program are conducting a multi-year research project to obtain information on the status of New York State’s moose population, health of the moose, and the factors that influence moose survival and reproductive rate. The goal of the Adirondack moose study is to gather data that will be used to create a moose management plan for New York State. “Our moose research work is an important component in developing a comprehensive New York State moose management study where geospatial technologies and data are key elements of our research” notes Kramer. “We look forward to our continued efforts and collaboration with our partnering organizations in protecting this important state wildlife species”.
Contact:
Dave Kramer
Research Scientist
Division of Fish and Wildlife
New York State Department of Environmental Conservation
David.Kramer@dec.ny.gov
Jim Stickles
Region 5 Big Game Biologist
Division of Fish and Wildlife
New York State Department of Environmental Conservation
James.Stickles@dec.ny.gov
For more information and reading:
Moose in New York
New York State Department of Environmental Conversation: Moose
Moose Management