10 Questions: ChatGPT for New York State GIS

I thought I was going to get out in front of all the ChatGPT for GIS discussion for the New York State GIS community, but that turned out to be off by a magnitude of sorts.  YouTube is already replete with ChatGPT for GIS tutorials and if we wait until next week there will probably be another ChatGPT alternative.  (I found the Matt Forrest YouTube video a good ChatGPT for GIS intro – actually formed a question after one of his examples).  Even Amazon jumped into the frey recently with their Amazon Bedrock option.  Take your pick, Bing Chat, Chatsonic, YouChat, Google Bard (available via a waiting list) and a whole host of others on the market in 2023. 

No, the robots aren’t taking over and I suspect we won’t see any of the early Terminator Cyberdyne Systems androids applying for your local GIS Analyst position anytime soon – though it might be a solution for those long dreadful digitizing jobs in the cart lab.  One way or another, Chatbot AI technology is definitely here to stay, evolve, and become another piece of the geospatial toolbox.  

Nothing specific or implied in any the questions.  Just random chains of thought though it does take a little getting used to putting the questions together vs. a basic Google search.  And it does seem to help to refresh and ask the same question twice – or even three times – to get more detailed results.  Never was a programmer, so a little short on questions in that space.

A lot here.  Actually 17 questions in all.  Straight copy and paste. Skim through as you want – find a topic/question you might be interested in.  There are tons more which could have been included.

Without any further adieu, my first machine interview: 

eSpatiallyNewYork:  What freshwater fish datasets are best for mapping fish population based on water depth in the Great Lakes?

ChatGPT:  There are several freshwater fish datasets that can be useful for mapping fish populations based on water depth in the Great Lakes. Here are a few options:

  1. Great Lakes Acoustic Telemetry Observation System (GLATOS) – This dataset provide information on the movements and behaviors of tagged fish in the Great Lakes.  It includes data on depth, temperature, and location, which can be used to create maps of fish populations based on water depth.
  2. Great Lakes Fishery Commission (GLFC) – The GLFC maintains a database of fish populations in the Great Lakes.  This dataset includes information on fish specifies, size, and location, which can be used to map fish population based on water depth.
  3. Great Lakes Environmental Database (GLENDA) – GLENDA is a comprehensive database of environmental data for the Great Lake region.  It includes information on water depth,  temperature, and environmental factors that can be used to map fish populations.
  4. USGS Great Lakes Science Center – The USGS Great Lakes Science Center conducts research on fish populations in the Great Lake and maintains a database of fish surveys.  This dataset includes information on fish species, abundance, and location which can be used to map fish populations based on water depth.

Ultimately, the best freshwater fish dataset for mapping fish populations based on water depth in the Great Lakes will depend on the specific research question and the type of analysis being conducted.

eSpatiallyNewYork:  To what degree of accuracy can I map features from New York State orthophotography?

ChatGPT:  The degree of accuracy with which you can map features from New York State orthophotography depends on various factors such as the resolution of the imagery, the accuracy of the ground control points used for georeferencing, and the skill and expertise of the analyst.

New York State orthophotography typically has a resolution ranging from 0.5 to 1 meter, which means that individual features such as buildings, roads, and other infrastructure can be identified and mapped with a reasonable level of accuracy. However, mapping smaller features such as individual trees, shrubs, or small structures may be more challenging, as these features may not be visible at this resolution.

The accuracy of mapping also depends on the quality of the georeferencing. The accuracy of the ground control points used for georeferencing should be of a similar or higher resolution than the orthophotography itself. This ensures that the imagery is correctly aligned with the ground, allowing for accurate measurements and mapping.

The skill and expertise of the analyst are also critical factors in the accuracy of mapping features from orthophotography. A trained analyst with experience in image interpretation and feature extraction techniques can accurately identify and map features with a high degree of accuracy.

Overall, mapping features from New York State orthophotography can provide a reasonable degree of accuracy for larger features such as buildings, roads, and other infrastructure. However, mapping smaller features may require higher resolution imagery or other sources of data. It is always important to validate and verify the accuracy of the mapping results through ground truthing and other quality control measures.

Continue reading

Geospatial Student Spotlight: Ge (Jeff) Pu

Academic Institution:

SUNY College of Environmental Science and Forestry
Department of Environmental Resources Engineering
Ph.D Environmental Resource Engineering (Dec 2020)

Drexel University
Department of Civil and Environmental Engineering
B.S. & M.S. Environmental Engineering

Research Focus:

Ge’s doctoral research focused on monitoring riparian vegetation conditions overtime and quantifying correlations to selected water quality variables. In addition, he focused on quantifying the impact of riparian vegetation presence on river channel boundary changes. Such riparian vegetation environments have a significant role in filtering contamination and maintaining water quality in riverine and stream systems. His research involved the use of high spatial resolution aerial photos to detect and delineate riparian vegetation status. Riparian ecosystems across New York State remain under stress from climate change, agricultural practices and urbanization.

Study Area and Background:

Ge’s study areas included the Genesee River which originates in Gold, PA flowing north to Rochester, NY and ultimately into Lake Ontario.   Land cover in the study area is dominated predominately by agriculture and forest, with smaller amounts of developed land, including a mixture of residential, commercial, transportation, and other non-developed lands.  Various parts of the Genesee River are currently listed as impaired on Section 303 (d) of the Federal Clean Water Act based on the presence of various pollutants, which includes phosphorus, sedimentation, oxygen demand, and pathogens.  Riparian buffers along the Genesee River play a significant role in improving the overall condition of the river and help combat many of the water quality related problems through filtering various contaminations, trapping sedimentation and ultimately improving river water quality.

The Mount Morris gravity dam on the Genesee River was utilized as a separation point when comparing the results of riparian vegetation indices. This separation formed a logical break since upstream of the dam the channel follows its natural path, whereas flow downstream of the dam is regulated by the dam instead of natural flow regimes.  An interactive web map of the study area is here.

The Genesee River watershed stretches from Lake Ontario in the north to Northern Pennsylvania in the south.

Data and Software:

 Data:  Central to Pu’s research was the use of the Google Earth Engine (GEE) which includes two freely accessible image programs: (1) United States Department of Agriculture National Agriculture Imagery Program (NAIP) imagery, and (2) Landsat products.  The NAIP images are airborne color-infrared orthorectified images acquired at 1 meter ground sampling distance. This fine spatial resolution enables interpolation of detailed information on the boundaries of river channels and riparian vegetation. The NAIP program collects imagery on a regular basis, with images of the study area available from 2003–2015. GEE provides access to Landsat 5 and 8 8-day Normalized Difference Vegetation Index (NDVI) and Enhanced Vegetation Index (EVI) composites.                                                     

Other geospatial datasets also utilized included USGS water quality data, and (2) National Oceanic and Atmospheric Administration (NOAA) weather data. Downstream water quality data was collected by the USGS in the Genesee River at the Ford Street Bridge in Rochester, NY and downloaded through the USGS Water Data for the Nation.  Parameters collected include water temperature, specific conductivity, pH, turbidity and dissolved oxygen.  Daily weather data is collected by the National Oceanic and Atmospheric Administration (NOAA) at three airports within the watershed: Greater Rochester International Airport, Cattaraugus County Olean Airport, and Dansville Municipal Airport. Weather parameters recorded include daily mean precipitation and daily cumulative air temperature. Weather parameters across the three stations were averaged to eliminate micro climate effects. Water flow/gauge data provided by the U.S. Army Corps of Engineers.

 Software:  Data was examined and processed in a variety of desktop software packages and cloud platform including, as previously identified, Google Earth Engine as well as  ArcMap, QGIS and R.

 Project Findings:

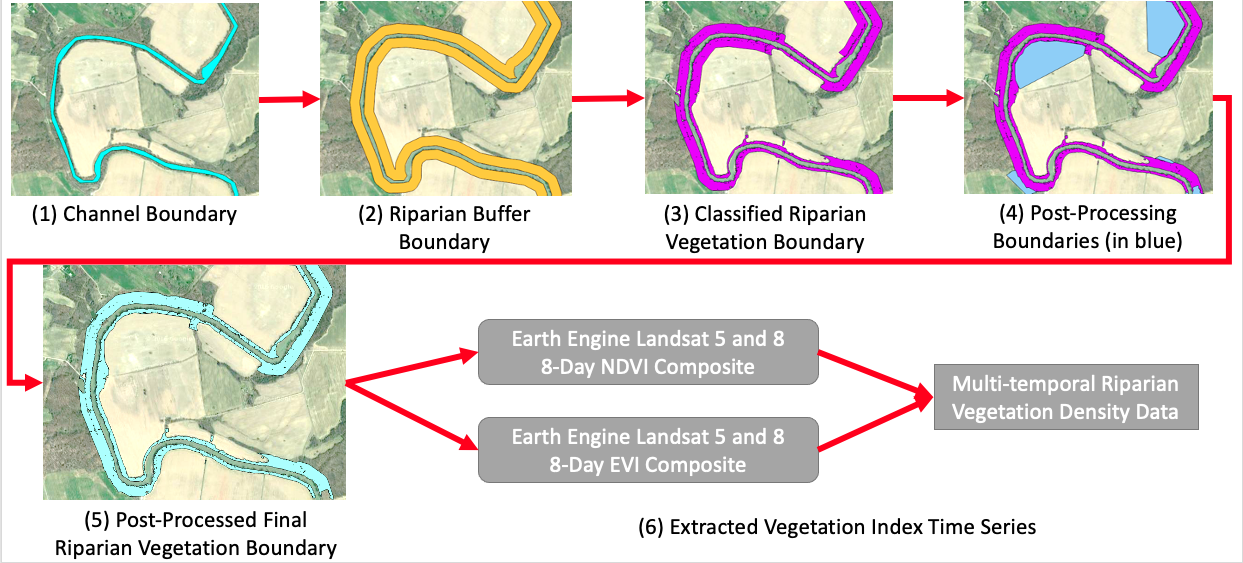
This project developed a new method to extract multi-temporal riparian vegetation indices directly from satellite image composites which included five major steps: (1) Identifying the channel boundary, (2) creating a buffer around the channel, (3) classifying land cover within the riparian buffer, (4) converting pixel-based vegetation buffers to polygons, and (5) generating final riparian buffer boundaries.

Pu’s Genesee River riparian mapping was based on GEE’s multi-petabyte catalog of satellite imagery and geospatial datasets which are available for scientists, researchers, and developers to detect changes, map trends, and quantify differences on the Earth’s surface.

The project utilized GEE for both image processing and spatial analysis processes, along with some usage of QGIS.  GEE was found to provide an efficient means to perform environmental data monitoring because it eliminates the processing time and effort involved with downloading, sorting, and combining datasets in order to perform the calculations and other processes necessary to obtain time series vegetation index data calculations.

Findings indicate that downstream water temperature and dissolved oxygen have moderate to strong correlation to riparian vegetation index (magnitude of Spearman’s correlation coefficient generally above 0.5), while other water quality parameters do not. Water temperature was positively correlated with the vegetation index values, while dissolved oxygen was negatively correlated. There were no significant differences in terms of correlation between the two sections of the river.

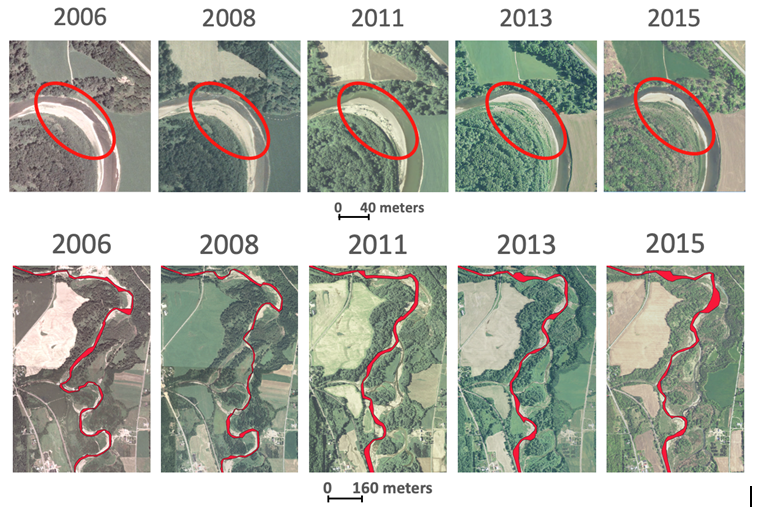
Analyzing nearly a decade of imagery covering the Genesee River footprint, Pu’s research shows the meandering of both the main river channel and at major river bends both of which impact adjacent riparian habitats.

Overall, the study developed a new method to rapidly extract time series of riparian vegetation indices directly from satellite image composites.  In delineating the main channel of the Genesee River and mapping riparian vegetation within 90 meters of the channel the research observed the expected annual trends, where the index rises in the summer season while falling in the winter season.

Findings will be useful to riparian stakeholders and managers to conduct informed riparian vegetation management and restoration. Delineating riparian vegetation extent from higher resolution imagery allows one to identify riparian zones that have significant riparian removal or channel variations and to prioritize restoration sites considering both spatial and temporal scales. Results drawn from Pu’s research has been and will continue to be presented at local and international conferences for improving current riparian management approaches.

A more complete and detailed document on Pu’s research containing further discussion/analysis, statistics and graphs, and summary details can be downloaded here.

Google Earth Engine (GEE):

 Jeff’s extensive use of GEE as part of this doctoral work led to additional work which was primarily funded through AmericaView and SUNY-ESF.  Funded primarily through a grant from the U.S. Geological Survey, Ameriview is a consortium comprised of university-led, state-based consortia working together to sustain a network of state and local remote sensing scientists, educators, analysts, and technicians.   The state’s AmericanView affiliate is New York View   (NYView) which is administered through the Department of Environmental Resources Engineering (ERE) at SUNY-ESF.  The NYView academic consortium includes the State University of New York (SUNY) College of Environmental Science and Forestry (ESF), the Institute for Resource Information Sciences (IRIS) at Cornell University, SUNY Fredonia, and SUNY Plattsburgh.

Through this NYView project, Jeff developed a series of 16 free-to-access Google Earth Engine online training videos (available on YouTube) for the beginner to advanced which demonstrate applications to support teaching, research, and outreach in remote sensing and image processing.  GEE is a cloud-based platform that combines a catalog of satellite imagery and geospatial datasets with planetary-scale analysis capabilities. This platform is available for academic, non-profit, business, and government users to analyze and visualize the Earth’s surface.  He was able to also work closely with the Google Earth Engine development team which provided access for development and programming assistance.  A one-page summary of the NYView 2019-2020 Mini-Grant project can be downloaded here.

Summary:

Jeff is currently preparing for a postdoctoral research position. He hopes to become a professor in the future based on his of research and associated work in academia.  His research interests continue to evolve in the realm of water resource engineering with a focus of utilizing the latest technologies to help solve water resource challenges across both urban and rural environments.

Contact:

Ge (Jeff) Pu
State University of New York – College of Environmental Research and Forestry
Department of Environmental Resource Engineering
gpu100@syr.edu

Dr. Lindi Quackenbush
Associate Professor
State University of New York – College of Environmental Research and Forestry
Department of Environmental Resource Engineering
ljquack@esf.edu


Geospatial Student Spotlight: Christopher Plummer

Academic Institution:

The University at Albany, SUNY
Department of Geography and Planning
Pursuing M.S. in Biodiversity, Conservation, and Policy

B.S The College at Brockport, SUNY, Environmental Science and Biology

Research Focus:

Using drones to assess white-tailed deer abundance and habitat preference in the Albany Pine Bush Preserve

Plummer’s overall research goal was to use thermal imaging drones to perform aerial surveys of white tailed deer and associated drone technology to produce an up-to-date habitat assessment of the study area to assess both white-tailed deer abundance and associated habitats. Plummer’s research proposes drones:

  • Offer a faster and lower cost of aerial data capture
  • Can be flown with lower detection from wildlife
  • Can be equipped with thermal sensors to aid in wildlife detection
  • Offer high accuracy population data with robust statistical strength

Study Area and Background:

Located northwest of Albany, the Albany Pine Bush Preserve (APBP) is approximately 3,350 acres supporting a broad variety of habitats highly fragmented by roads developed areas.  Hunting, fishing and trapping are recreational activities that are carefully regulated in the preserve following relevant APBP and New York State Dept. of Environmental Conservation (NYSDEC)  rules and regulations.

Historically, the monitoring of whitetail deer (WTD) has been difficult to establish due to obtaining reliable abundance estimates as traditional survey methods are normally very work intensive and/or expensive.  In the past such estimates have been done within the preserve with spotlight surveys and camera trap surveys.

(Historically, obtaining reliable abundance estimates of white-tailed deer has been difficult to establish, with more traditional methods being work intensive and/or expensive, and having issues with imperfect deer detection. In the past such estimates have been done within the preserve with spotlight surveys and camera trap surveys. Plummer plans to use the findings from the previous work to help understand how the use of drones compares to the more traditional survey methods.

Unmanned Aerial Vehicles (UAV) technology, more commonly called drones, was chosen as a means to facilitate WTD data collection and analysis in the Preserve.  Specifically, DJI Mavic 2 Enterprise Dual was used for the thermal deer survey while other DJI drones (Phantom 4 and  Insprie 2) were used to help create the orthophoto map.  A MicaSense RedEdge 3 multispectral camera which was attached to one of the drones helped pick up additional reflectance characteristics of varying vegetation types.  This camera has 5 bands, with the two additional bands sensing red edge (~715 nm) and near infrared (~825nm) wavelengths.

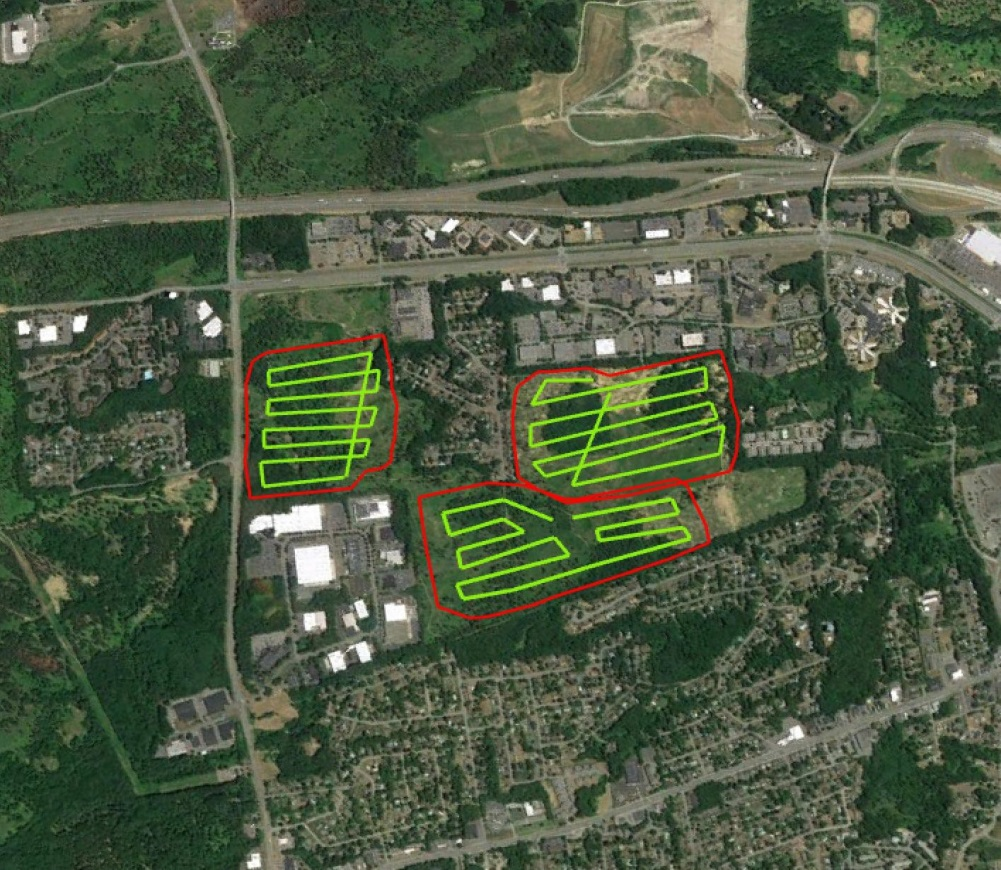
Universal Ground Control Station (UGCS) and DJI Pilot software was used to develop flight plans over three distinct focus areas in the Preserve.  Multiple flights were made to acquire enough images with sufficient overlap.  Plummer used Agisoft photogrammetry software to generate orthophotos of the study areas.

ENVI software was used to generate a supervised canopy cover classification of the study area.  Plummer was able to classify the entire orthophoto with >95% accuracy into herbaceous/open canopy, deciduous canopy, coniferous canopy, bare ground/no canopy, and developed canopy.  ArcMap 10.6 was used in a variety of ways as well as R-Studio and Microsoft Excel for data analysis.

Three flight plans in Blueberry Hill East and West and the Kaikout Kill Barrens

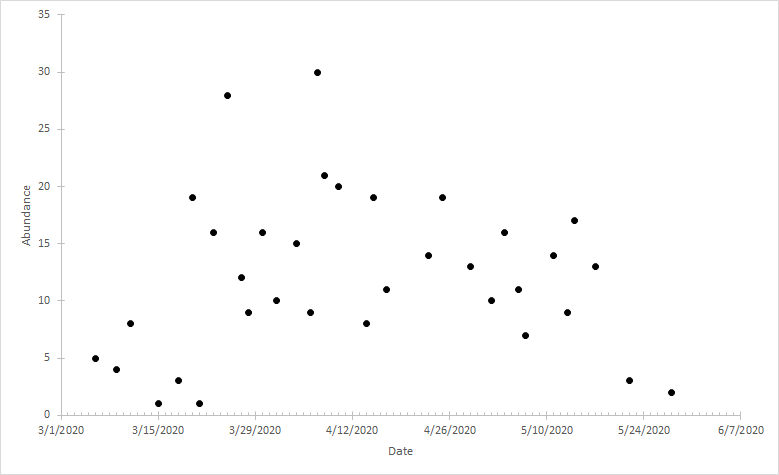
The research team flew a total of 34 surveys between March 9th and May 22nd 2020 with all flights occurring within 1 hour of sunrise collecting over 950GB of imagery files.  A total of 405 deer were spotted and identified in 143 unique locations.

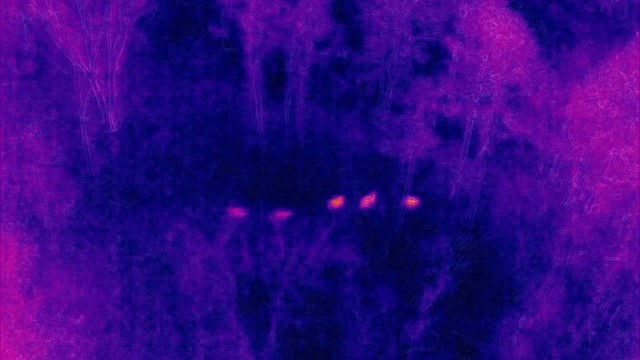
Silhouettes of five deer as seen through Plummer’s use of thermal imaging photography

Project Findings

Plummer’s initial calculated observed average density of 13 deer per sq. km is unlikely to be uniform over the entire Preserve due to varying  landscape dynamics and various habitat types. The abundance within their study area varied widely over time, which Plummer suggests  is explained by daily movements made by individual groups into the nearby residential areas.  With regards to habitats, deer were more frequently found in the following areas of the Preserve:  (1) areas of recent timber harvest, (2) Pitch Pine cover and in the pitch-pine scrub oak barrens, (3) areas with significant dune activity, and (4) close to the edge of Preserve boundaries. He believes this new method for assessing white-tailed deer abundance has high potential in the wildlife monitoring space and hopes  his findings about deer within the Preserve will help generate well informed deer management decisions.

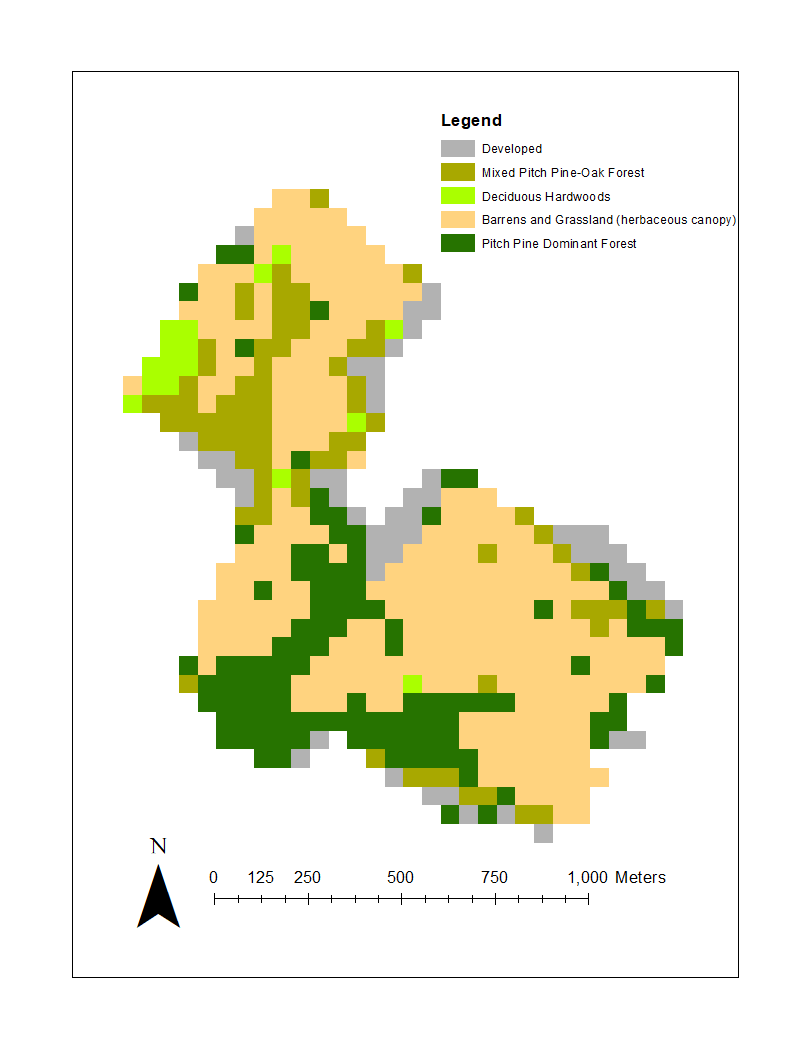
Plummer generated a habitat classification map based on the percent of each canopy type within a 50m x 50m grid covering the entire study area. The Pitch Pine Dominant Forest habitat along the southern border of the Preserve was one of the areas with the highest WTD counts.

Actual WTD observed during any given survey varied over time. Over the near three month data collection period in early 2020, WTD observation counts ranged from 1 to 30

Summary

Plummer’s SUNY Albany graduate work suggests that thermal drones are a viable tool to assess WTD population dynamics and can generate reliable abundance estimates.  Drone deployment provides the ability to survey large geographic areas in a small amount of time and a cost effective manner.  Results show that deer use a variety of habitat types in the Preserve and numbers at any one location varies temporally.  A detailed video presentation Chris made outlining his work to the members of the APBP is available here on YouTube.

Post-graduate work, Plummer would welcome the opportunity to work for an agency such as U.S. Fish & Wildlife Service or NYSDEC Division of Fish and Wildlife. He’s not opposed to going back to school for a PhD but not anything immediately.  He is also very interested in public policy related to climate change and sustainability.

Contact:

Chris Plummer
Graduate Student
University of Albany
Geography and Planning
ccplummer@albany.edu

Dr. Alexander Buyantuev
Associate Professor
University at Albany
Geography and Planning
http://www.albany.edu/gp/Buyantuev.php

Game Time: Mapping Moose in New York State

Introduction

A rare treat in eastern upstate New York, mostly in the Adirondacks, although sometimes in the Taconic Highlands along the Massachusetts and Vermont borders and within the Catskills, is to see moose in the wild.  Moose (Alces alces) are the largest member of the deer family (Cervidae) and the largest land mammal in New York State. Having been absent from the Empire State since the 1860s, the species began to reenter the state on a continuous basis in the 1980s.   While re-establishment of the moose population in New York has been viewed and supported as a positive sign of a healthier, more complete natural ecosystem,  it does not come without a range of potential problems associated with their return and the need for proactive management and monitoring by New York State Department of Environmental Conservation (DEC) wildlife biologists and researchers.

So in 2020 it should come as no surprise that wildlife biologists in New York State – and around the world – are using geospatial technologies to support their work.  In addition to estimating moose population size, New York’s wildlife biologists and scientists also focus on improving moose survival and reproductive rates and to assess their diet and health.  Assisting the DEC’s work towards researching moose habitat and resource requirements is David W. Kramer, Research Scientist, in the Division of Fish and Wildlife.  The toolkit which augments his moose research includes a mixture of GPS, remote sensing imagery, a variety of GIS data layers, and  both ESRI and “R” software.  R being a free, open source software package for statistical computing and graphics commonly used in the research community.

Population Counts and Observations

To date, Mr. Kramer and colleagues have been observing the locations of 26 moose which were collared with either a  Lotek or Telonics GPS unit which can store data “on board” the collar that can then be retrieved by getting the collar back or by getting close enough to the moose to download the data to a receiver. “Uplink” collars can store data on the collar as a backup, but also send daily data uploads via satellite and are then stored online.  Moose are captured (to put the collar on) by a crew which “net-gun” the animal from a helicopter. For their research, DEC staff focuses on female moose (cows) for two reasons:  (1) wanting to track of how many offspring each cow has; the collars facilitate the “following” of the females in the summer to count calves, and (2) male moose (bulls) go through physiological and body changes during the same period that do not make the collaring of males practical or even unsafe.  Data associated with the collars are important in analyzing survival and calving success as well as the geography associated with habitat selection.

Continue reading

Belated News Flash: Empire State GIS Web Maps Got Juice!!

Maybe a bit of yesterday’s news, but apparently many of us in the statewide GIS/geospatial circles were asleep at the wheel this past December when Governor Cuomo signed Senate Bill 9061 amending section 4511 of the Civil Laws and Practices Rules (CLPR).  In laymen terms, the bill “gives Google Maps and other global imaging websites the presumption of accuracy when they are used as evidence in New York courts.   Information taken from similar sites (web mapping services, etc) to Google Maps would be presumed accurate unless “credible and reliable evidence” is presented showing that it is not.”   The bill was introduced by Senator Michael Gianaris (D-Queens) earlier in 2018 and approved on June 15, 2018.  I reached out to Senator Gianaris’s office to inquire regarding his interest and/or constituent support in this space, but my emails were not answered.  If you are so inclined, the full grownup version of the bill can be found here.

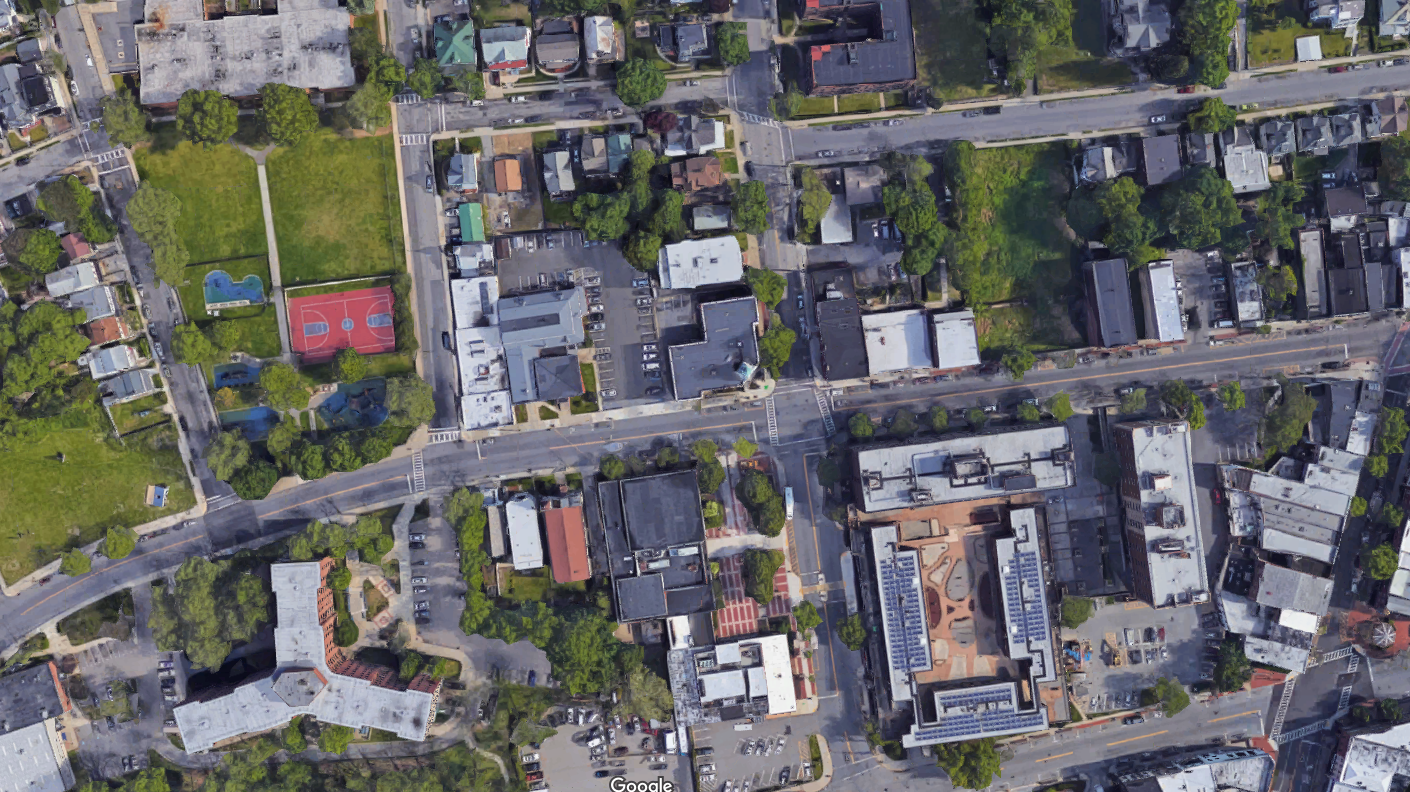
This downtown Peekskill, New York Google Maps image is a staple in context of submitting “imagery” as evidence in New York State courts. Though readily available and easy to access by litigants, other government-based web mapping programs across the state often contain more detailed information and are available for increased use in court cases.

The reasons for the lack of notice, or interest for that matter, are probably for a myriad of reasons.  Could be there was simply a lack of attention because the statewide geospatial community was still dizzy from excitement by passage of the National Geospatial Data Act of 2018 last fall and its anticipated benefits to government and business GIS programs across the Empire State.  (Btw – if you are keeping a GDA scorecard, here is a May 2019 presentation on how the Act is moving forward on behalf of your GIS program.)

Though having received little attention and discussion across the GIS/geospatial communication channels and/or social media, the approved S9061 2018 legislation actually received a fair amount of dialogue in New York State law journals and blogs (i.e., Bleakley & Platt, Neufeld, O’Leary & Giusto, and Sahn Ward Coschignano among others).  With no real formal monitoring process or legislative agenda to effectively influence legislation on behalf of the statewide “profession”, legislation such as S9061 may continue to go unnoticed.  By comparison in contrast to the legislative agendas and committees of aligned Empire State geospatial professions such as surveying and engineering.

While Google internet mapping content will continue to be a norm, this legislation provides the opportunity for expanded credibility on the value of government and public facing internet web mapping sites to the legal community and in support of the  judicial process.   And by extension, one of the primary reasons in passage of S9061 – cost savings – as the new law should save litigants significant time and money and speed up trails.  In some instances, litigants have had to pay for companies to fly over a desired area and photograph it at a high cost, so that a witness would be available to authenticate the picture. Passage of S9061 also represents yet another way in which New York State legal rules are changing for the better to accommodate new technology. Notes Adam Rodriguez, Esq., attorney at Bleakley & Platt in White Plains, “This is a very practical amendment to the C.P.L.R. that will promote efficiency by saving time”

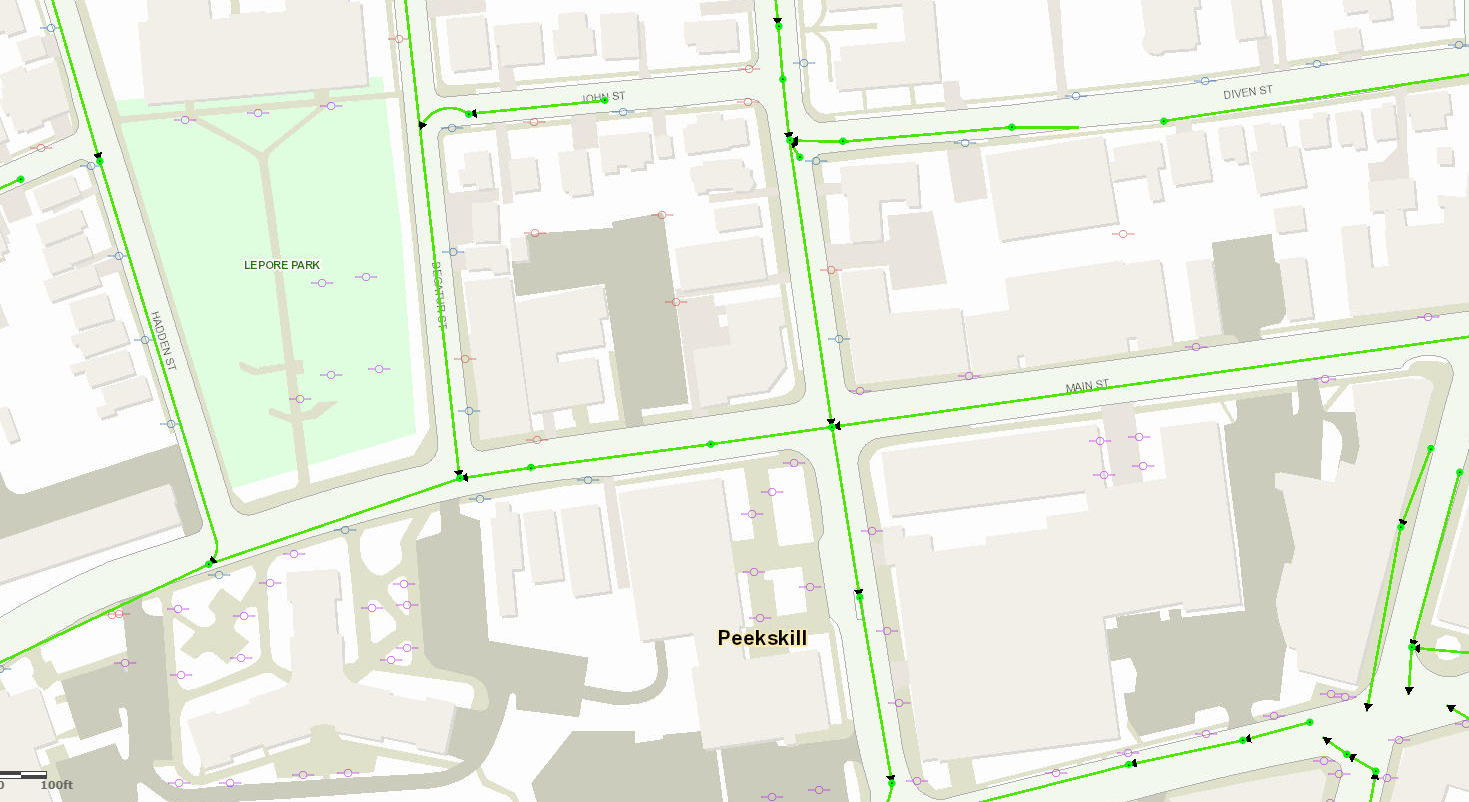
Using approximately the same Peekskill footprint as the image above, this Westchester County web mapping application renders completely different data including planimetrics, utility poles, and a sanitary sewer network. Increased outreach from government GIS programs to the legal community can illustrate the detail and richness of data which can be obtained from online web mapping programs.

Of course while the legislation gives the legal community more freedom in the use of online mapping content, it still recognizes that it may not be entirely correct and gives relief to opposing parties to challenge admis­sion of the web map content through “credible and reliable evidence that the image, map, location, distance, calcula­tion, or other information” does not “fairly and accurately portray that which it is being offered to prove.”  As such, expanded use and access to online web mapping content will increasingly require attorneys to better understand both the accuracy and limitations of the geospatial products (particularly hardcopy products generated from online applications) being submitted as evidence.

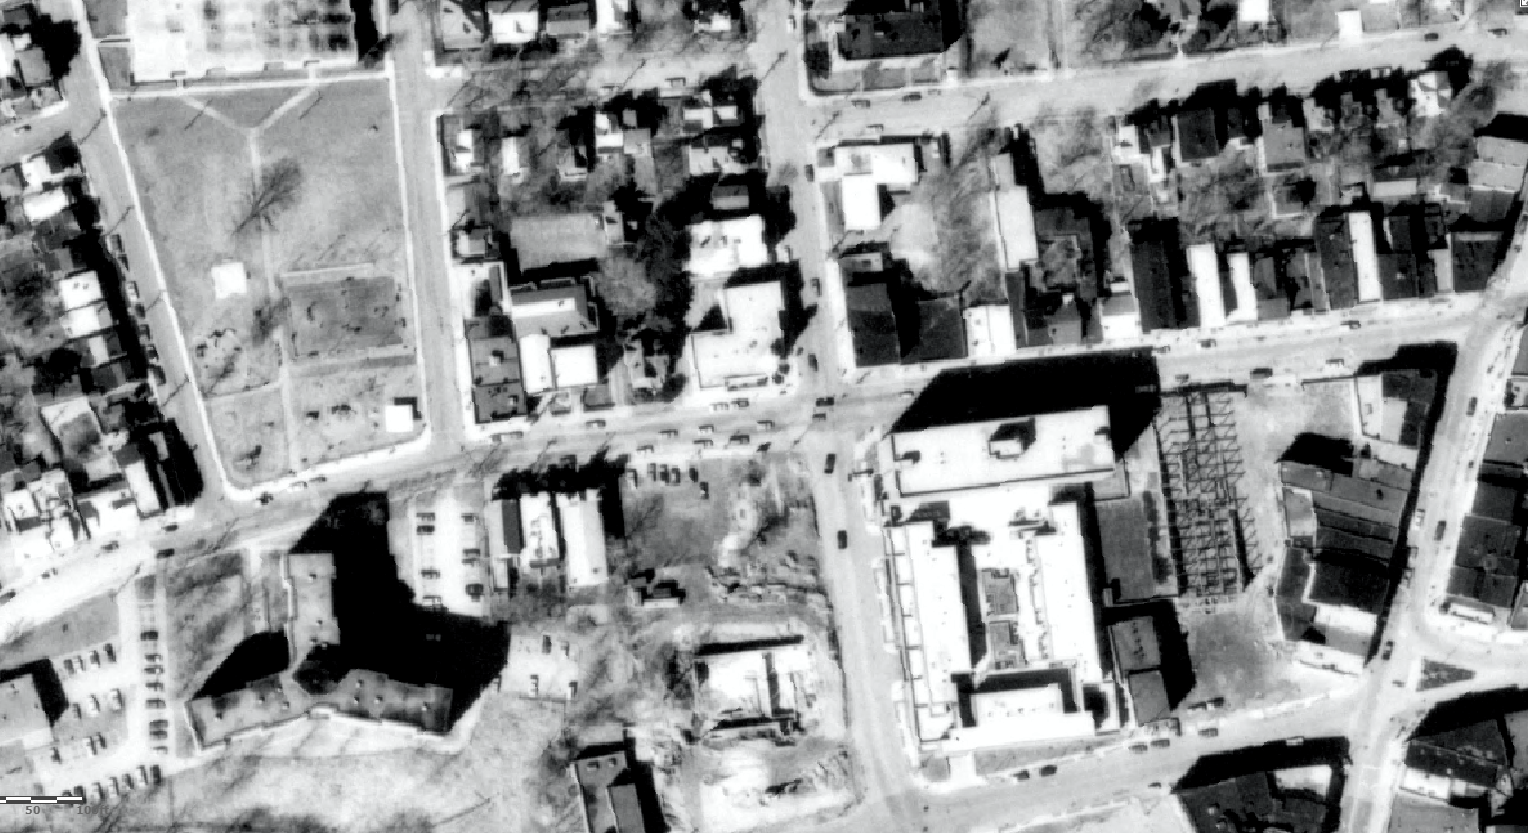
Post-World War II (1947) imagery of the same Peekskill footprint. While the Westchester County 1947 photography is of outstanding quality, conversion of such panchromatic photography to digital format can often introduce various types of errors and distortions. As such, not all “online content” is always correct and the legal community will need to continue to be cautious – and educated – about using “as is” online web mapping products.

The bill will make New York State practice consistent with Federal practice, which allows courts to take judicial notice of Google Map images because they “can be accurately and readily determined from sources whose accuracy cannot reasonably be questioned” under Federal Rule of Evidence 201.

Another plus for our tax payer funded geospatial products.  Albeit not on a day-to-day basis, but nonetheless, providing cost efficiencies in the judicial system and a little more something for the GIS program return-on-investment (ROI).

Talk to your government attorneys or firms which represent your GIS program about Senate Bill S9061.

Geospatial Business Spotlight: EagleHawk One, Inc.

Company Name:                EagleHawk One, Inc

Website:                             www.eaglehawkone.com

Established:                       2016

Employees:                       6 + Nationwide network of certified drone pilots

EagleHawk was founded in 2016 by Willard Schulmeister and Patrick Walsh in Buffalo, NY, and has grown to be one of the most successful drone data and services operations in New York State today. Together they bring years of technological and business expertise to the fast moving startup company. Willard has a Master’s degree in Geographic Data Science and Geography from the University at Buffalo and Patrick holds a Master’s degrees in Aerospace Mechanical Engineering from the Rochester Institute of Technology as well as an MBA from Rollins College. Both are licensed sUAS (drone) pilots with the Federal Aviation Administration. EagleHawk has recently added Jonathan Byrd to its executive team. Jon holds an MBA from Harvard Business School and has over 15 years of experience in strategy, finance, engineering, and operations, and has held leadership roles in a variety of companies and industries. EagleHawk’s professional staff includes engineers, pilots, data scientists and industry experts located at their offices in Buffalo, Syracuse, Charlotte and Orlando, as well as other remote locations in the U.S.

EagleHawk has built a solid reputation within the drone community and has completed work for over 100 customers to date, many of which are repeat clients. EagleHawk is a Launch NY portfolio company and an Esri Emerging Business Partner. They are active in the NYS GIS Association and in both the central and western NYS GIS  communities. EagleHawk recently won $500,000 prize in GENIUSNY, the world’s largest business accelerator program for drone systems and technology based in Syracuse, NY.

Geospatial Products and Services

EagleHawk provides a portfolio of specialized services, but they are most often sought out by corporations, universities, and developers for their expertise in campus-wide aerial infrared roof inspections. To date, EagleHawk has inspected over 800 buildings and has found that nearly 80% of those roofs show signs of leaking.

The company has established a routine inspection program that empowers clients with a means to proactively manage and extend the average lifespan of their roofs, enabling a logical and fiscally responsible approach to capital planning and budgeting for roof maintenance. EagleHawk is currently developing a GIS-based asset management software solution that uses artificial intelligence and machine learning to derive meaningful insights from the data they collect.

EagleHawk specializes in the following areas:

  • Geographic Data Collection and Map/Data Processing
  • University and Corporate Campus Physical Inspections
  • Aerial Infrared Roof and Building Analysis
  • Utility and Infrastructure Inspections
  • Sensor Integration with UAV’s

A more detailed listing of EagleHawk’s services can be found at: www.eaglehawkllc.com/droneservices

University and Corporate Campus Mapping & Inspections

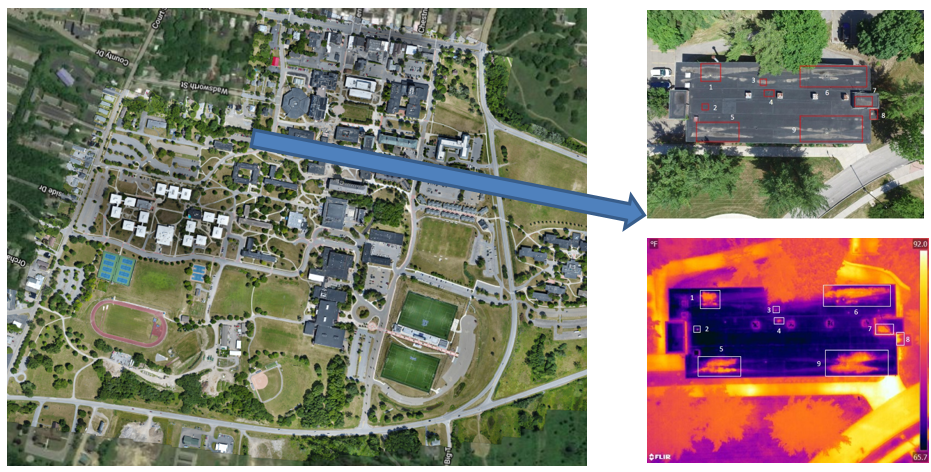
EagleHawk has conducted several large inspections for universities and corporate campuses throughout the Eastern United States.  For these projects, the campuses are carefully mapped in order to generate useful information for the inspection, such as building dimensional information, or roof elevation profiles.  EagleHawk conducts both façade and roof inspections  using advanced thermal imagers to detect issues not visible to the naked eye. EagleHawk certified data analysts conduct a building-by-building evaluation and generate meaningful insights from the data collection.

This image, from a SUNY campus, identifies wet and areas of concern within the building roof insulation invisible to the naked eye.  These areas are within the georeferenced “red rectangles” in the upper right image.

Pre-Construction Site Analysis

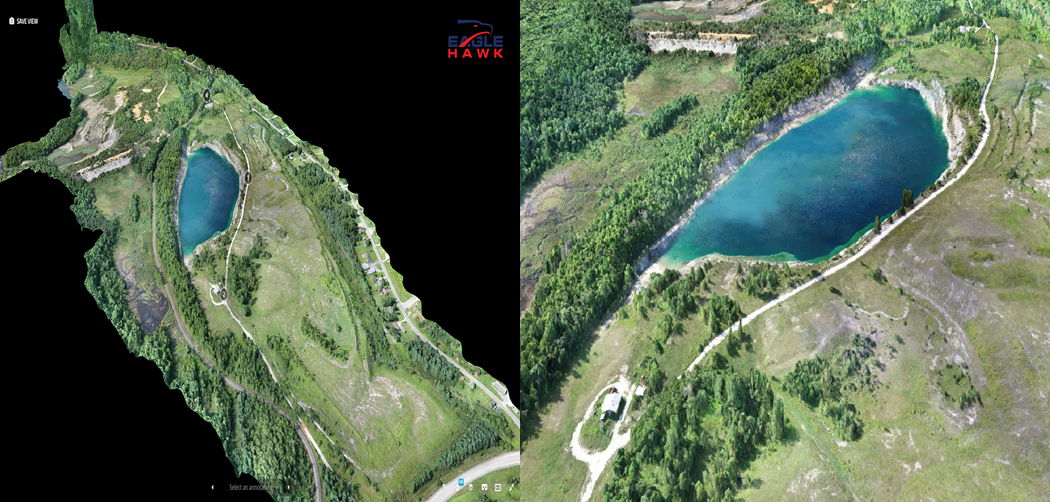
For this project EagleHawk collected approximately 550 acres of map data and imagery over a rural area in upstate New York for a client. Elevation data was needed for a pre-construction site analysis in order to determine if the area was viable for development.  EagleHawk generated an orthomosaic map, elevation contours and a massive 3D point cloud which allowed for critical decision making regarding plans at the site. This project was a great example of the benefits of drones in capturing geographic data for a large site effectively and efficiently.

For this upstate project, EagleHawk used two drones with 20MP cameras to collect imagery in one field day.  Imagery captured was processed to generate orthomosaic and topographic data delivered in common GIS & CAD formats. Clients receive the data as well as access to an interactive GIS with the data.

Buffalo Niagara Waterkeeper

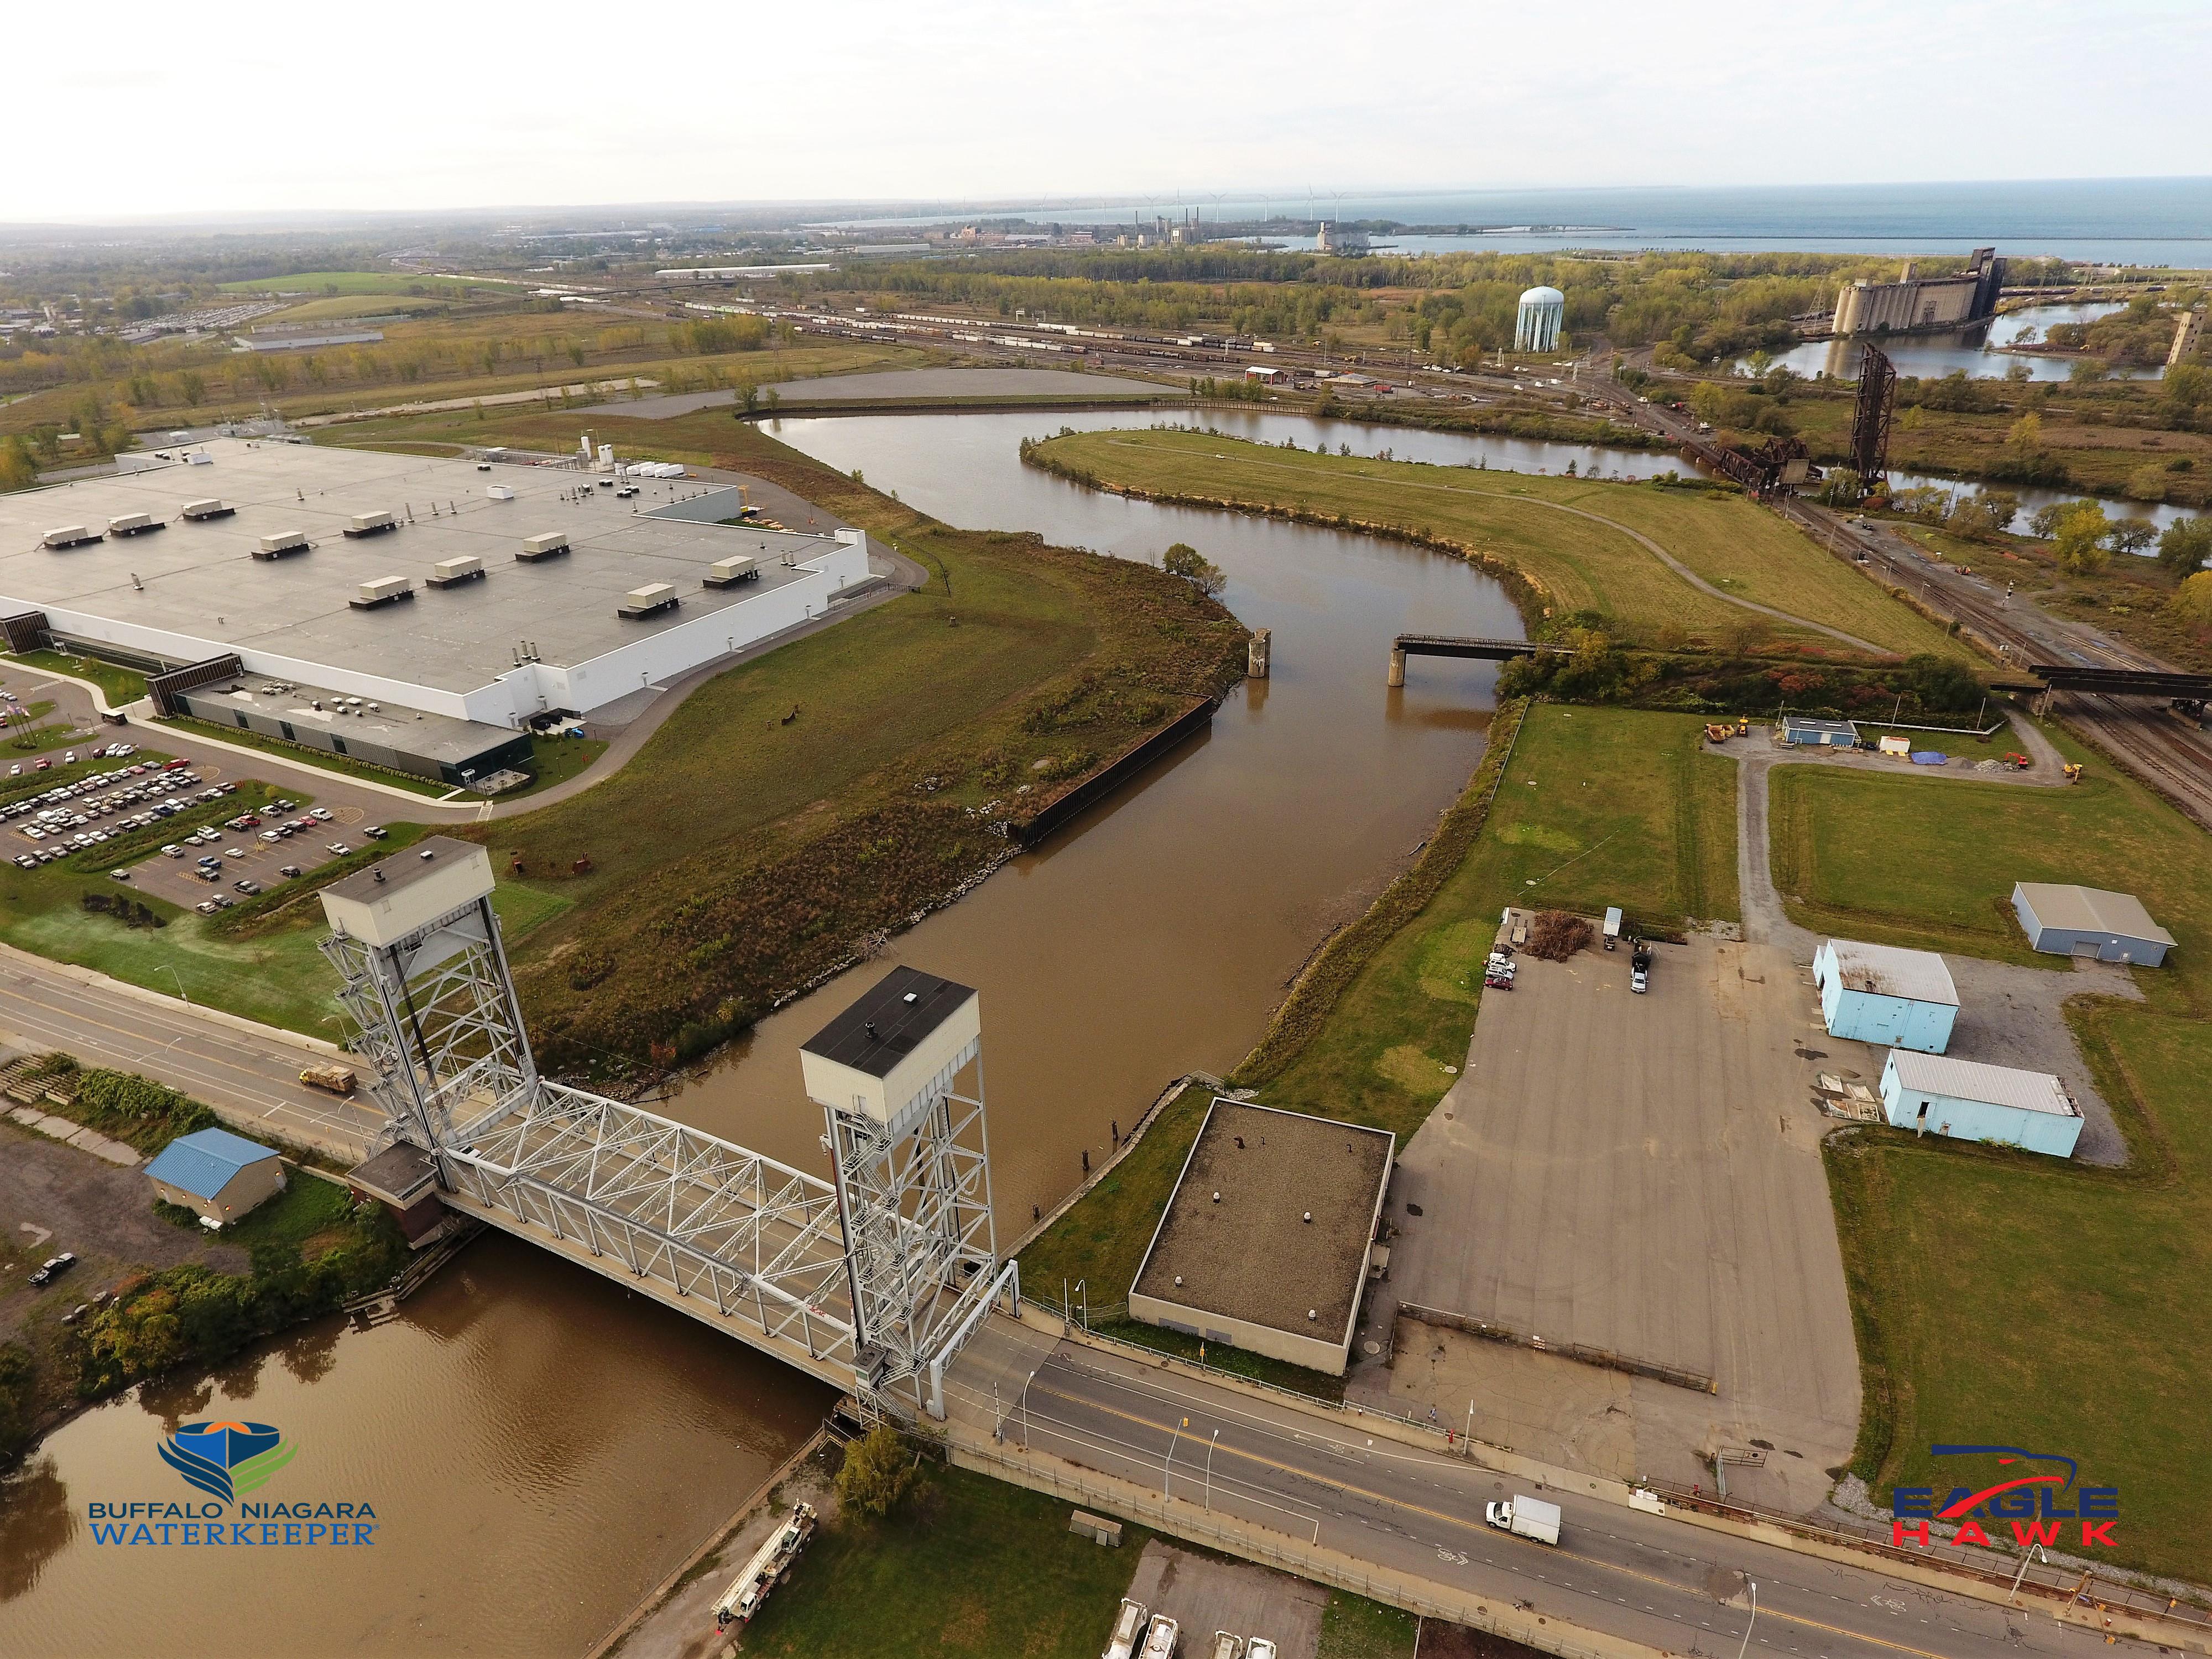
EagleHawk has worked with Buffalo Niagara Waterkeeper on more than a dozen different project sites throughout western New York including the Buffalo River, the Niagara River, Ellicott Creek and at Tifft Nature Preserve. EagleHawk collects aerial imagery and maps project sites to document change and also generates useful geographic data to aid in shoreline enhancements and restoration efforts.

The Buffalo River is one of eight habitat restoration projects in the Buffalo area that EagleHawk  is collecting imagery on.

Contact:

Patrick Walsh CEO – pwalsh@eaglehawkllc.com
Willard Schulmeister COO – wschulmeister@eaglehawkllc.com
Jonathan Byrd CFO – jbyrd@eaglehawkllc.com

EagleHawk One, Inc –  844-4-UAS-DATA  |   716-810-1042  | info@eaglehawkllc.com
FAA Certified Commercial Drone Operations

NYSAPLS 60th Annual Conference January 28-30 Saratoga Springs

eSpatiallyNewYork had the opportunity to participate in the recent New York State Association of Professional Land Surveyors (NYSAPLS) annual conference in Saratoga Springs in late January.  In doing so, I was able to meet with numerous NYSAPLS members, including briefly with current NYSAPLS President Greg de Bruin, as well as several vendors in the exhibit hall.  Having run almost exclusively in the statewide GIS circle for the past 25+ years, and having really no reference point what to expect at the show – I was not disappointed.
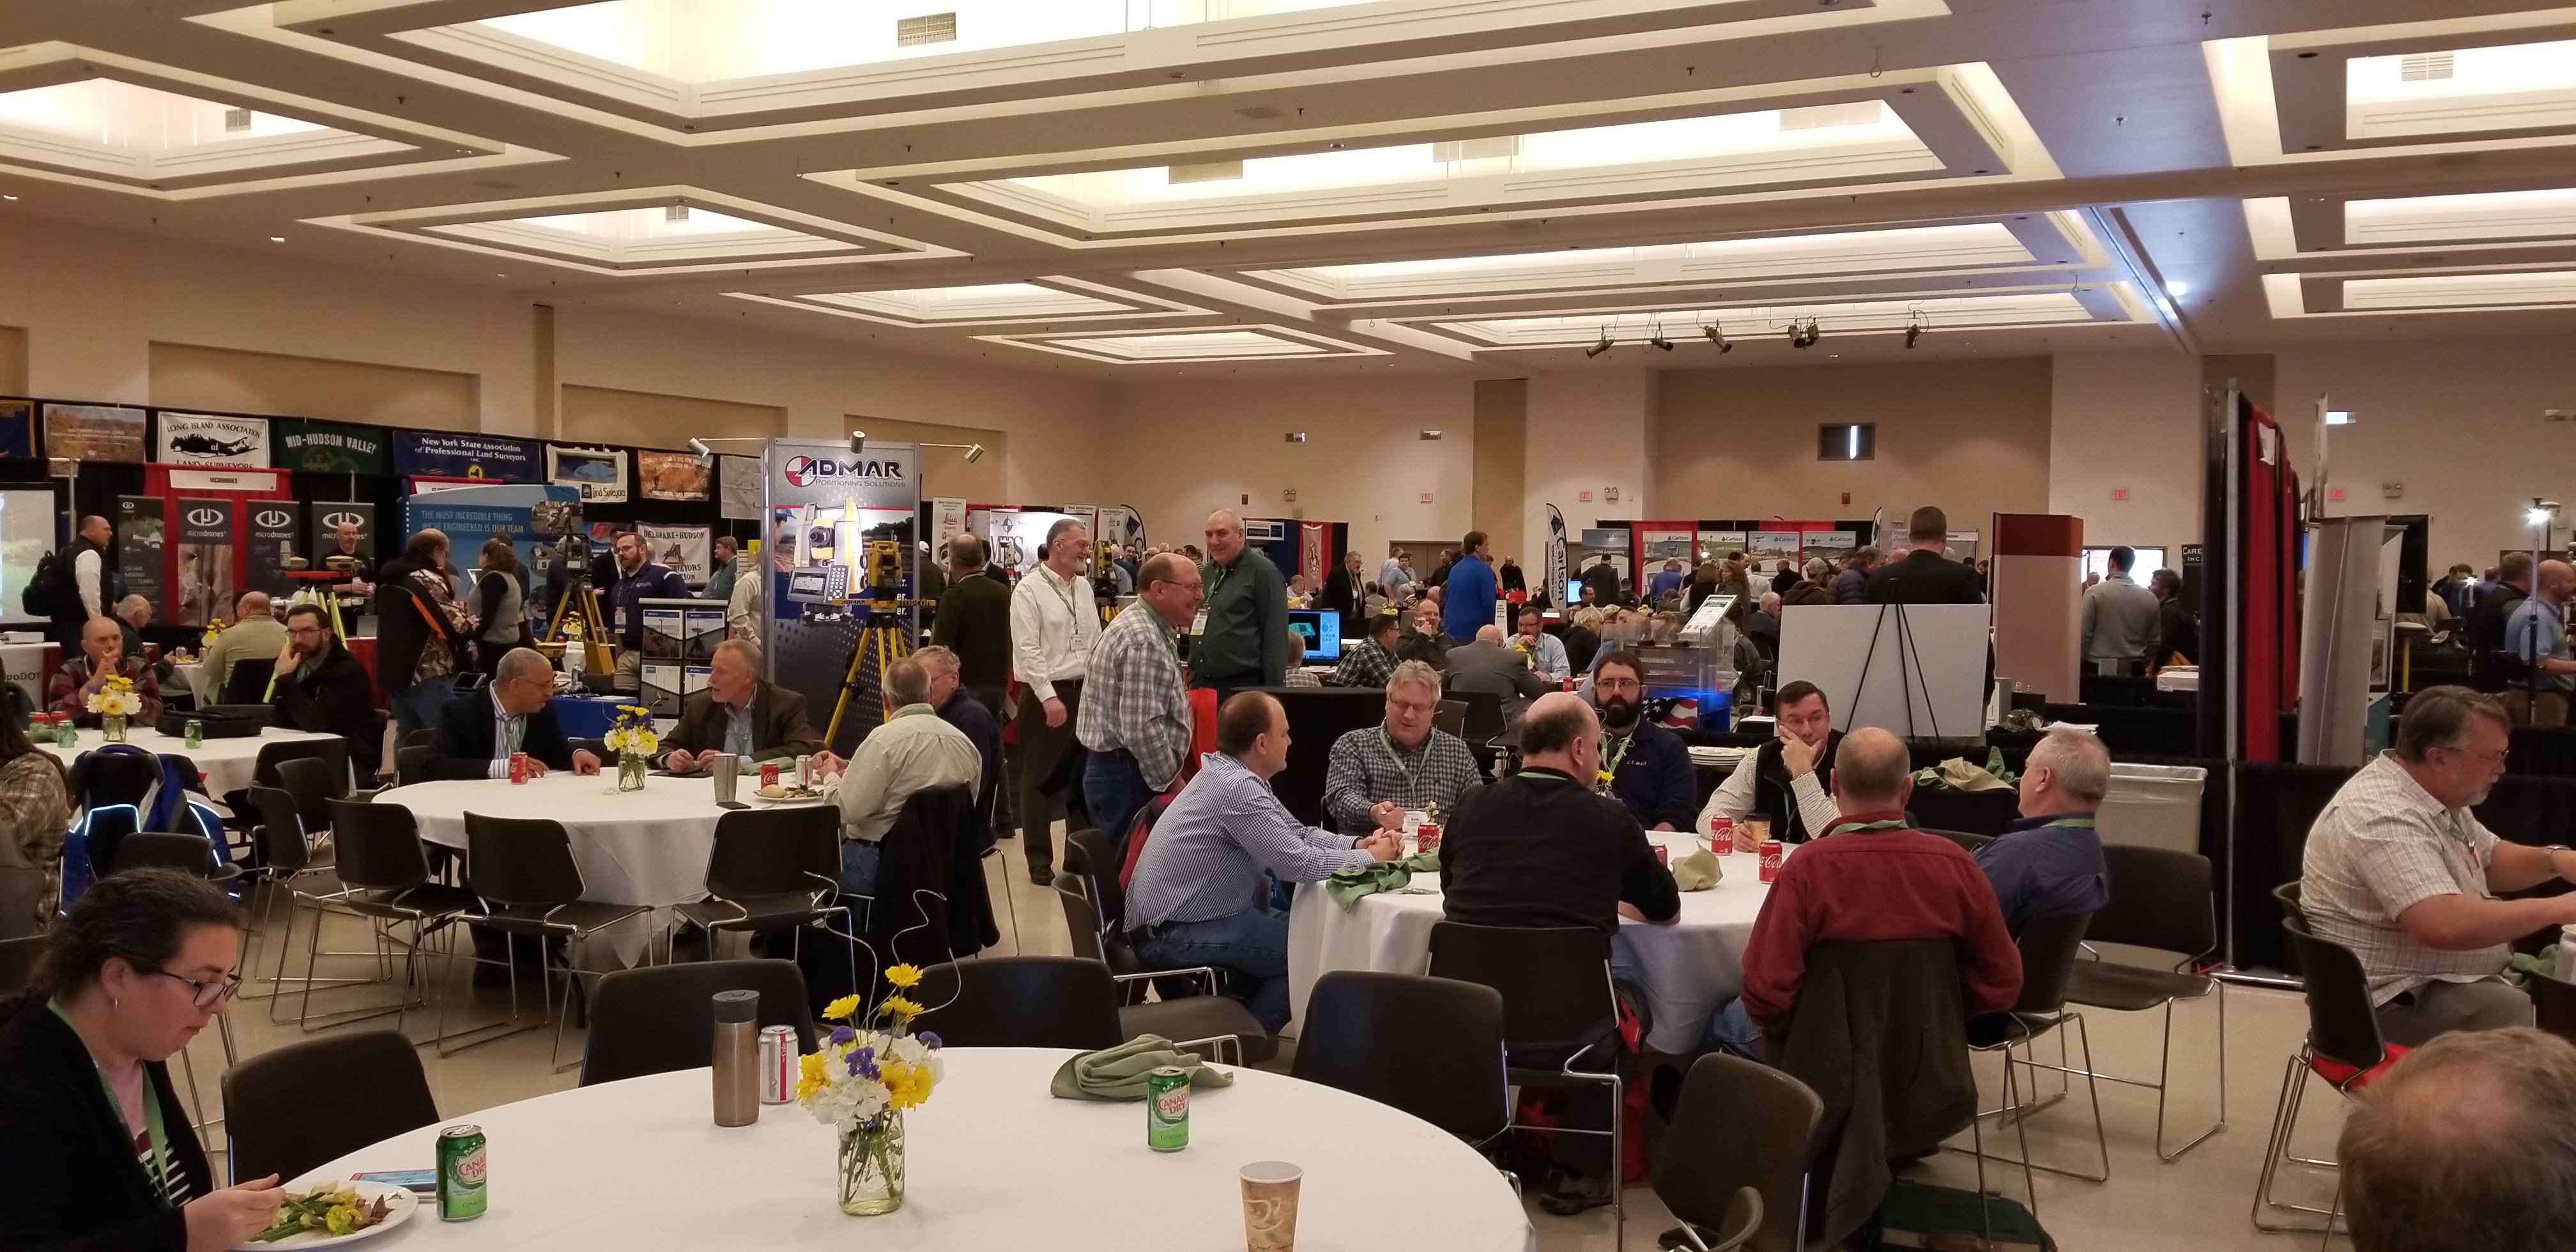
The three-day conference brought together 704 registered attendees with the overall total reaching 775 when including 31 exhibitor representatives.  While I was almost certain to see components of the traditional surveying profession (i.e.,  leveling rods, measuring tapes, tripods, safety equipment/clothing, nails and spikes, monuments,  flagging and marking paints – the customary surveying equipment fare), I was pleasantly surprised to see in both the exhibit hall and throughout individual presentations evidence of the statewide surveying community investing in a variety of developing technologies such as laser scanning, drones, 3D, advanced GPS and photogrammetry, and an abundant number of emerging mobile and field programs.   Quite noticeably, surveying firms offering a broader range of geospatial products and services.   It was clear on the exhibit hall alone how the Empire State surveying community is embracing state-of-the-art geospatial technologies in 2019.

The exhibit hall at this year’s NYSAPLS conference offered an impressive line-up of vendors. The daily Strolling Lunch with Exhibitors engages attendees with the exhibitors.

The conference offered a very diverse range of presentations, classes and workshops.  Of particular interest was to see presentations focusing on Building Information Modeling (BIM), 3D Building Rights and Air Rights, and several focusing on the drone/UAV.  Given the surveying profession’s important role in the development and maintenance of statewide tax maps, there were a number of sessions dedicated to the issues associated with land ownership including easements and right-of-ways, tying into and using historical documentation, tides and tidal datums, highway law, and even canal boundary retracement.  Though I was unable to attend, a class on stone walls focusing on their importance in land records and property boundary definition  was held.  Even a class on “Dendrology for Surveyors” class was included on the agenda. Of course there was a very visible presence of the field of photogrammetry which remains a staple throughout the profession, while new capabilities in the field of underground and subsurface mapping were also on display.  Making reference to the range of content at the conference, Ben Houston, Professional Engineer, Associate Member of NYSAPLS and NYS GIS Association Board Member commented  “This year’s NYSAPLS Conference offered a nice mix of training and social/networking opportunities. I was particularly impressed at the number and variety of professional services and geospatial data vendors in the exhibit hall.”

Of course there was ample time for mixers and social events at this year’s NYSAPLS conference. One of the Special Events at the show was the Field Olympics. Participants were able to compete against others in three events one of which was Tree Identification. Is that Ginkgo Biloba in #4? And here are the winners of this year’s map contest!

An important takeaway for me from the NYSAPLS conference was the focus on the business of surveying.  A geospatial profession largely dominated by private practice, business and industry, and enabling itself to create a presence in Albany.  As part of this presence, NYAPLS has recently created a Political Action Committee (PAC).  PACs are a type of political committee, once properly registered, which can engage in promoting candidates for election to public office that share the views, interests, and concerns of the land surveying community. This new committee is one of several active NYSAPLS groups working on issues such as standards and strategic planning.  Outreach and communication to the professional engineering communities and the State Board for engineering, land surveying, and geology remain priorities as well. (New York State professional surveyor accreditation and licensing is administered through the NYS Education Department Office of the Professions.)  “This year’s conference was outstanding”, notes current NYSAPLS President Greg de Bruin, “the facility, content, conference coordination were all first rate.”

For those involved in mapping technologies within the Empire State, it’s worth the time to visit the NYSAPLS website to see the many areas and programs this professional organization touches across the geospatial community.  There are a multitude of opportunities for collaboration.

Contact:

Amber Carpenter
amber@nysapls.org
518-432-4046

Greg de Bruin
gdebruin@gayrondebruin.com
516-805-4118

URBAN-X: Supporting New York Geospatial Startups

Curious to know about technology accelerators in New York State which are supporting  geospatial startups?  Look no further than Brooklyn-based URBAN-X built by MINI and Urban Us and operating since 2016 offering customer development, product development, and fundraising support to get selected startups off the ground into production and operation.   Geospatial is not the only type of startup  URBAN–X supports  (its actually much more)  with an existing resume of 37 firms in its portfolio covering technology solutions in the areas of real estate, transportation, energy, infrastructure, public health, and government among others.  The URBAN-X startup focuses on the urban tech environment developing hardware and software solutions which address key needs of city systems, as well as businesses and individuals.   The accelerator’s current cohort consists of seven  startups which each received $100,000 and five months of immersive mentorship.  This cohort was selected from over 500  applications this past November.

Every six months Urban-X selects up to 10 startups and invest $100,000 per company. The 20-week accelerator program also includes six on-site “experts-in-residence”.

Illustrative of the geospatial startups which have come through the accelerator is Citiesense.

Citiesense creates data-driven maps and dashboards that layers information about new permits, recent sales and property changes in urban areas, guiding real estate investors and other local stakeholders to support more informed business decisions.  Using interactive mapping and data visualization techniques, the company continues to focus on helping business districts better understand market demand and dynamics.   Citiesense uses Carto software to support their mapping applications and leverages data available in the NYC Open Data Portal.  Examples of their mapping apps are at the Downtown Brooklyn website and the Long Island City Partnership.  Citiesense is also referenced in a 816 New York article “3 map-based tech tools perfect for neighborhoods and housing authorities”.

I quickly developed an account on the Citiesense website and immediately started mapping various features around 347 East 105th Street. Out-of-the-box the application provides access to dozens of variables and features. This image shows recent 311 Reports, the NYC Street Tree Inventory, and the Commercial Overlay Districts layer.

Starting a tech company is never easy” notes Citiesense CEO Starling Childs. “I think this is particularly true of ‘Urban Tech’ startups. Joining URBAN-X was like adding the perfect final cofounder to our team right when we needed to begin testing our idea in the market. The people behind URBAN-X know the challenges urban tech companies face when thinking about solutions that consider some level of government and private sector collaboration. They understand the value of things like open data; how it supports public private sector collaboration and accelerates innovation in cities.”

Other URBAN-X supported startups in the location and navigation space include Revmax, Rentlogic, WearWorks and Swiftera.

Revmax:  Revmax develops fleet management and routing software for ride-hail vehicles. Its technology maximizes vehicle utilization by proactively forecasting rider demand based on historical data and future events. Revmax ensures that vehicles are in the optimal location to find rides quickly — increasing fleet revenue while reducing pollution and congestion.  According to  CEO Jonathan Weekley and chief operating officer Briggs Fraser,  cabs and Uber cars are empty some 50 percent of the time — highly inefficient for drivers trying to make the most of their time on the road. But the real target market for Revmax, Weekley says, is auto manufacturers such as GM and Ford, who are looking to get into ride-hailing. “They see declining car ownership, and they need to figure out a way to keep building cars and use that fleet more efficiently,” he said. Those manufacturers will have extra incentive to optimize routes, since they, not the drivers, will own the cars that are out on the road.

Rentlogic:  Rentlogic is a standards organization that measures and letter-grade rates the quality of multi-family residential buildings. Rentlogic ratings recognize building owners that invest time and energy in to operating great buildings, and helps connect them with residents trying to navigate a difficult marketplace.  Data underneath the application is harvested from the city’s 311 system.    Every week, roughly 4,000 complaints are initiated by renters about their landlords via calls to the #311 system. These complaints can include mold, heat and hot water issues, infestations, structural problems and more – all of which are used in the application.  It is Rentlogic’s aim to bring transparency and standardization to the residential real estate market.

WearWorks:  WearWorks is a New York-based haptics design company using sensory feedback systems to communicate information entirely via touch. Using vibration-based language, their product augments the senses of blind and visually impaired users through a non-visual interface, helping them to easily and effectively navigate to any destination.  Btw – WearWorks technology was worn/used by Simon Wheatcroft, a blind runner, in the 2017 New York City Marathon.

Swiftera: Swiftera’s business plan is to support citizens, businesses and municipalities in mobility, leisure and urban planning decisions. By providing access to fresh and actionable geospatial data at a competitive cost, the company leverages its novel urban-imagery technology to help customers analyze the past, explore the present and be the first to see the future.  While still in development, Swiftera anticipates delivering unprecedented urban imagery: available all-the-time, in real time.  For more information visit their website or contact them at info@swiftera.co. 

Summary:

URBAN-X provides an excellent opportunity for startups – including those in the geospatial space – to get started in a way which would otherwise be financially and logistically very difficult.    URBAN-X is itemized in a 2017 Dreamit article as one of the leading voices in the New York City “nascent urban tech movement”.  In the broader statewide context, the Empire State Development corporation supports several regional certified business incubators.  The New York State geospatial community is fortunate to have both the access and ability to work with companies such as URBAN-X.

Contact:

Micah Kotch
Managing Director
URBAN-X
Micah.Kotch@urban-x.com
Mobile: +1.646.645.0459
www.urban-x.com

10+ Questions: Eileen Allen

Eileen Allen is a familiar and respected face across the New York State GIS landscape.  First a foremost an instructor at SUNY Plattsburgh, she has instructed and mentored hundreds of students who are now part of the statewide geospatial fabric.  And in her spare time she has participated and contributed to numerous statewide GIS advisory committees over the past 20 years.  Always upbeat and a pleasure to work with, she is most certainly a first ballot lock for the GIS wing at the Hall of Fame in Cooperstown.  

eSpatiallyNewYork:  How long have you been at SUNY Plattsburgh?

Allen:  I was an undergraduate student at Plattsburgh State from 1973-1977.  In August 1984, I was hired to help finish a remote sensing research grant mapping historical beaver locations in the Adirondacks.  I’ve been here ever since.

eSpatiallyNewYork:  Where are you originally from and tell us about your journey that led to Plattsburgh.

Allen:  Both my husband and I grew up in Plattsburgh.  Fortunately there were state and federal programs to help me get a college education.  After college at SUNY Plattsburgh, I went to McGill and worked on a Master’s in physical geography.  Everything seemed to go wrong with my advisor and the research.  It was hard but necessary to leave there.   Fortunately, I could use my McGill credits and finish a Master’s program in Natural Resources at SUNY Plattsburgh while I worked on research projects.  I thought about getting my PhD but I just didn’t end up going in that direction.   Besides, I liked the research projects I was working on too much!

eSpatiallyNewYork:  You’ve been associated with the GIS program at Plattsburgh since its origin.  How did it get started?  Who was involved?

Allen:  My involvement with teaching GIS developed out of research projects and the need to train student workers. Dr. Richard Lamb was instrumental in developing the GIS courses and a minor in addition to his planning courses and practice.  He started the GIS course in the late-1990s and by the early-2000s we would take turns teaching the Introduction to GIS class.  I took over all the GIS classes when he retired and the Remote Sensing courses when Dr. Donald Bogucki retired.

But there is more, because so many chance occurrences determine our path.  Also, it has been noted that many more women are in GIS than in other natural sciences.  When taking college classes, I was often one of a very few or the only female.  Many people think that because GIS is so collaborative, women often gravitate towards it.  This is certainly true for me.

As an undergraduate, I was interested in many things but was unsure what I would major in and tried out several paths.  I needed a Social Science course and Physical Geography was on the list, so I took it.  Drs. Donald Bogucki (Geography) and Gerhard Gruendling (Biology) were working on a pilot project mapping wetlands and demonstrated this in their classes.  The grant was to investigate the use of remote sensing to estimate the impact of regulating the Richelieu River (the outflow of Lake Champlain, NY-VT) because of flooding concerns in Quebec.  Dr. Bogucki showed some color infrared imagery of wetlands in Physical Geography class and I was totally flabbergasted!  I absolutely had to be involved with the project!  It took several days for me to get the courage up to ask if I could be part of the research.  It so happened that they needed someone to use a transit to establish ground control.  I had been working with my father, a land surveyor, for many years and was enlisted by Dr. Bogucki to help set out targets and map them.

In the early 1970’s, it was very unusual for an ecologist and a geomorphologist to work together.  That was part of the attraction, though, where many of my interests could be combined. By chance, at about the same time, the Environmental Science Program was started at SUNY Plattsburgh and I had found my academic home.  I continued to be part of the project mapping Lake Champlain wetlands using custom flown 70-mm imagery until my graduation.
Continue reading

Geospatial Business Spotlight: Mapillary

Company Name:                 Mapillary

Website:                              http://www.mapillary.com/

Established:                       2013

THE COMPANY

Mapillary is a new and different approach to Street View. Using computer vision, Mapillary stitches together photos taken with any device to create street-level imagery for extracting geospatial data. By empowering anyone anywhere to easily create street-level imagery, Mapillary aims to create a photo representation of the world. To date, Mapillary’s community has contributed 63 million photos spanning over 900,000 miles across all seven continents.

Mapillary was founded in 2013 by Jan Erik Solem, Johan Gyllenspetz, Yubin Kuang, and Peter Neubauer, who share a vision for putting mapmaking into the hands of people everywhere. Solem, who serves as CEO, previously founded Polar Rose, a facial recognition software that was bought by Apple in 2010.  The company is headquartered in Malmö, Sweden, and has fifteen full-time employees located around the world.   Mapillary’s New York office is based In Brooklyn, NY.

PRODUCTS AND SERVICES

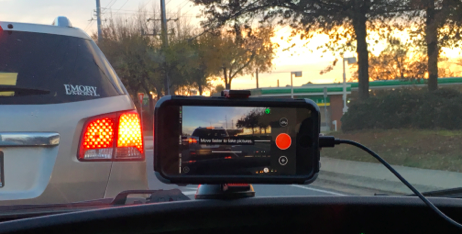
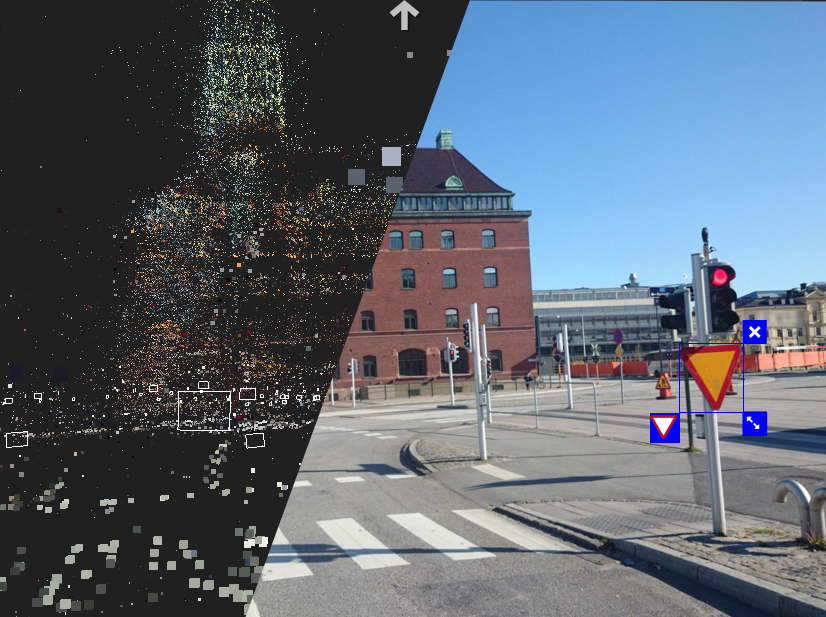
Mapillary allows community members to create and explore a crowd-sourced, street-level view of the world through its app, which is available for web, iOS, Android, and Windows Phone. Users can upload photos from their smartphones or other digital cameras and Mapillary then combines the images together geotagging each using GPS metadata. The resulting 3D reconstruction is created using computer vision and the company’s own open source “Structure from Motion” algorithm. Mapping isn’t limited to streets—the community has captured hiking trails, favorite bike routes, and even a stretch of Antarctica. Mapillary integrates with any mapping platform through simple APIs.

Street-level photos can be captured using Mapillary's iPhone app

Street-level photos can be captured using Mapillary’s iPhone app

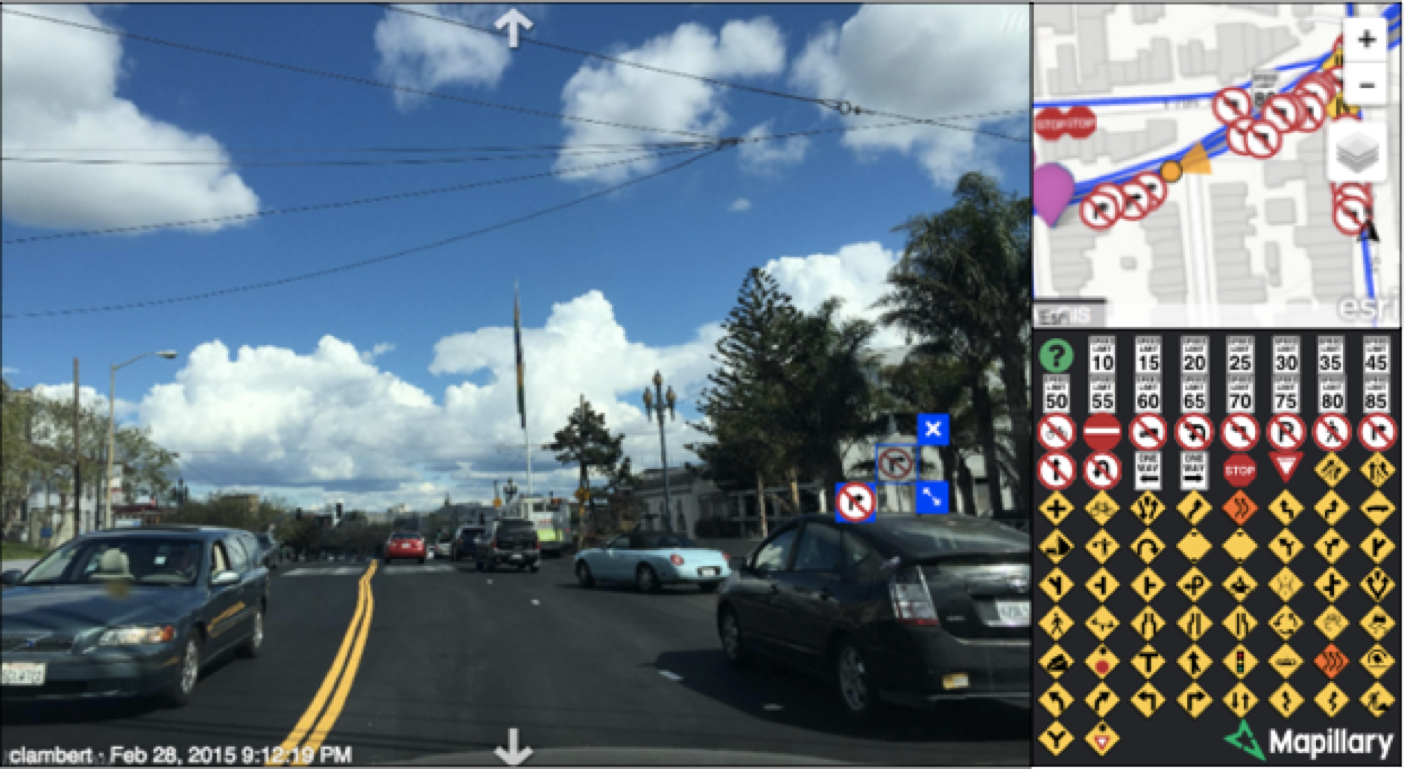
In addition to creating photo-maps, Mapillary also utilizes computer vision techniques to extract useful data from uploaded images. For instance, the software can recognize symbols on street signs in photos taken in the U.S. or Europe. This capability grew out of the app’s need to blur faces and license plates for privacy purposes, and is now used by groups like city governments for urban planning, land surveys and asset inventory. Using Mapillary with Esri’s ArcGIS platform has helped cities streamline infrastructure updates, from speed limit changes to road surface quality checks.

Mapillary uses computer vision to automatically detect traffic signs and extract geospatial data

Mapillary uses computer vision to automatically detect traffic signs and extract geospatial data

Humanitarian organizations also use Mapillary to further their initiatives. In Haiti, the American Red Cross and Humanitarian OpenStreetMap partnered with Mapillary to help record previously unmapped areas to aid disaster response efforts. Mapillary has also been used by the World Bank and other groups in Dar Es Salaam, Tanzania, to record infrastructure in flood-prone areas of the city to help plan improvements. The app is ideally suited for these sorts of tasks because it doesn’t require any special equipment beyond a basic smartphone.

Street level imagery is reconstructed by creating point clouds from photos.

Street level imagery is reconstructed by creating point clouds from photos.

Mapillary is free to use for individuals and for non-profit or educational purposes. For commercial solutions, ranging from embedding a photo-map into a webpage to extracting specific data from images, Mapillary has several pricing plans available.

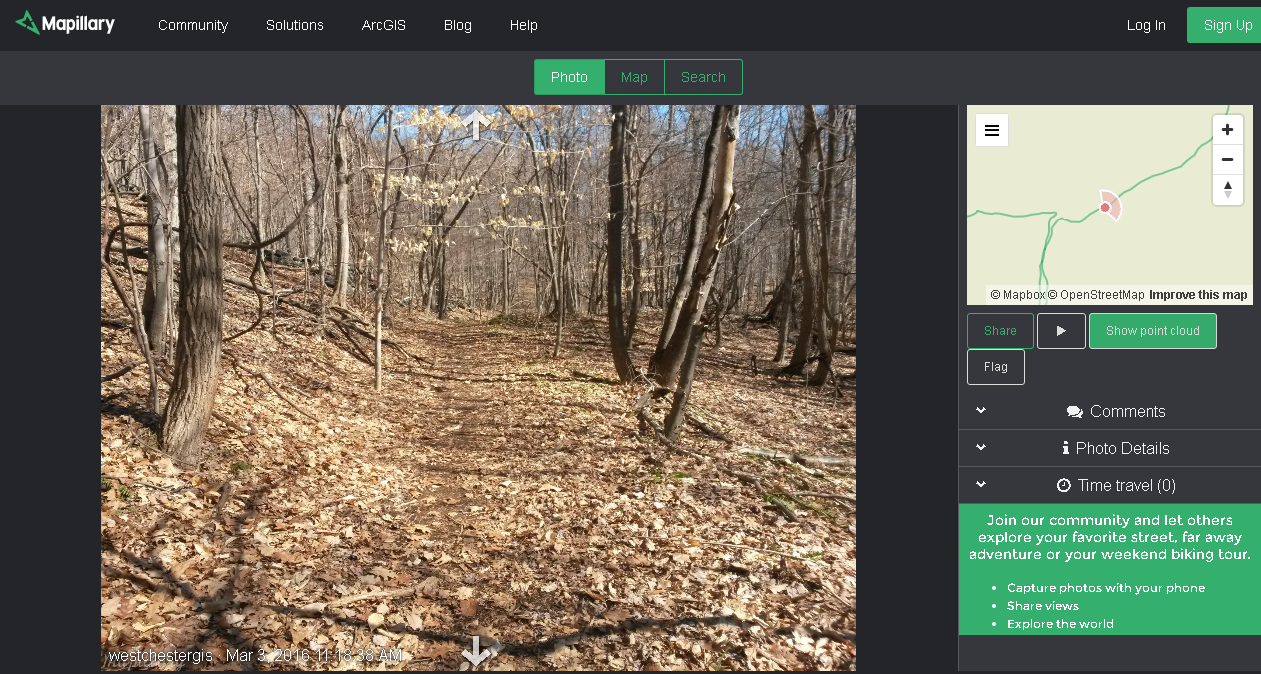
Westchester County GIS is using the Mapillary app to inventory hiking trails in County parks

Westchester County GIS is using the Mapillary app to inventory  hiking trails in Westchester County parks

To find out more about Mapillary, visit their website.

CONTACT: 

hello@mapillary.com
Bredgatan 4, 211 30 Malmo, Sweden
www.mapillary.com