Online Application Provides Tools and Data for Communities at Risk Along the Hudson River
Background
The Hudson River Flood Impact Decision Support System (HRFIDSS) is an online mapping application as well as a collection of geospatial products and data which illustrate the scale of potential flooding for tidally-affected shorelines of the Hudson River Valley and Westchester County coastal communities. In all, the viewer covers the shoreline communities in 11 counties in the region. Developed by researchers from Center for International Earth Science Information Network (CIESIN), Stevens Institute of Technology, and the Columbia Water Center, the application enables individual residents, community groups as well as municipal and regional planners to evaluate risk based on potential outcomes, and to determine the impact on and effect of social vulnerability, natural resilience, and critical infrastructure.
The tool also provides downloadable estimates of flooding impacts, including affected population and critical infrastructure, and cost estimates of building damage. It is further enhanced by including hydrological models which expands the flooding impacts to include storm tides/storm intensity and the contributions of river tributaries and streams.
The Hudson River Flood Impact Decision Support System helps address the growing interest across all levels of government in the New York region towards developing better forecasting capabilities and a better understanding of flood probabilities under a variety of sea level rise and storm frequency scenarios.
The application was developed using OpenLayers. Critical infrastructure data is housed in a relational PostGIS database which are served as a Web Feature Service (WFS) using Geoserver. Flood layers are raster data published from an ArcGIS Server at CIESIN while supporting imagery layers are consumed from New York State.
Impact Assessments
In addition to a variety of unique mapping tools, one of key features of the application is the generation of “Impact Assessments”. These are generated by application flood maps using a combination of historical and synthetic flood events which include water depth, surge, rainfall, and sea level rise scenarios of 0″, 6″, 12″, 18″, 24″, 30″, 36″, 48″, 60″, 72″ as well as 5-year through 1000-year flood zones. Flood scenarios presented in the mapping tool are accompanied by a set of impact estimates at the local level. These are divided into three themes: critical infrastructure, social vulnerability, and natural resilience features.
Locations of Critical Infrastructure
Critical infrastructure impacts are estimated at the municipal level and consist of loss estimates derived from the HAZUS-MH 2.2 Flood Model, as well as counts of affected facilities, landmarks, and physical features. Understanding the location of critical infrastructure, such as hospitals, schools, and nursing homes is crucial to planning for future sea level rise and storm surge events. With this information, planners can accurately determine which critical infrastructure is most vulnerable to flooding. Adaptation measures and preventive strategies can be implemented to secure the safety of these buildings and the individuals within them. For example, during many flood events, public schools are used as shelters for residents evacuated from their homes. City officials and emergency planners must know which schools are located in vulnerable zones so that shelters are not located in risky areas.
It is worth noting recognizing the importance of comprehensive building footprint inventories in any flood impact assessment or analysis, CIESIN furthered its work with New York State Energy Research and Development Agency (NYSERDA) as part of the development of HRFIDSS in undertaking another project to fill in critical data gaps in building footprint databases across the Hudson River Valley and New York State. This building footprint data set combines data collected from local governments and the Microsoft USBuildingsFootprints database, manually digitized from New York State Orthoimagery, as well as footprints extracted from LiDAR data where available. Data covers all counties in New York State, excluding New York City. County-specific data is being published on an ongoing basis. Building footprints from this project are currently being published by New York State.
Social Vulnerability Index
The social vulnerability information is summarized at the municipal and block group levels and is derived from a social vulnerability index based on the 2010 US Census, and American Community Survey (ACS) data. It identifies at-risk populations focusing on factors such as social and economic status, health, education, and housing to determine which areas have populations that would be particularly vulnerable to a flood if it occurred, or that lack adequate resources to develop resilience from flood hazards will be most negatively impacted by a flood event so response resources can be better planned for and more effectively allocated.
Natural Resilience Data
Natural resilience data can be used to determine existing natural resources that might help protect a community against flood risks and are important for conservation and stormwater amelioration. In contrast to developed areas, natural features like forests and wetlands retain, slow, and filter water to the soil, reducing erosion and flood impacts. It can also help determine the vulnerability of natural areas in the face of climate change. Derived data and statistics in this impact assessment category are consistent with natural features outlined in the New York State Department of Environmental Conservation (NYSDEC) Climate Smart Communities Certification Manual.
Note: Each of these sets of impact estimates are described in more detail in the Impact Estimates section of the project report which can be downloaded here.
Scenario Building
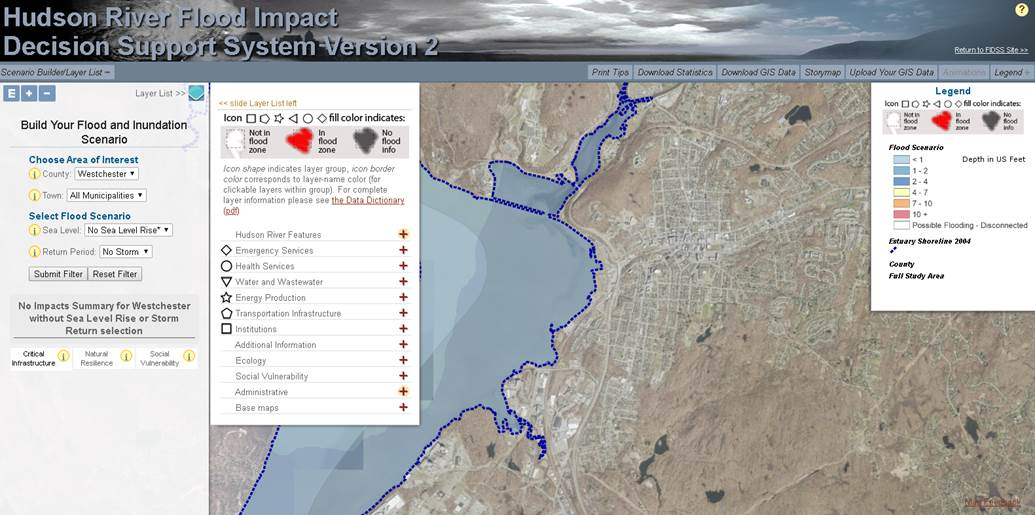
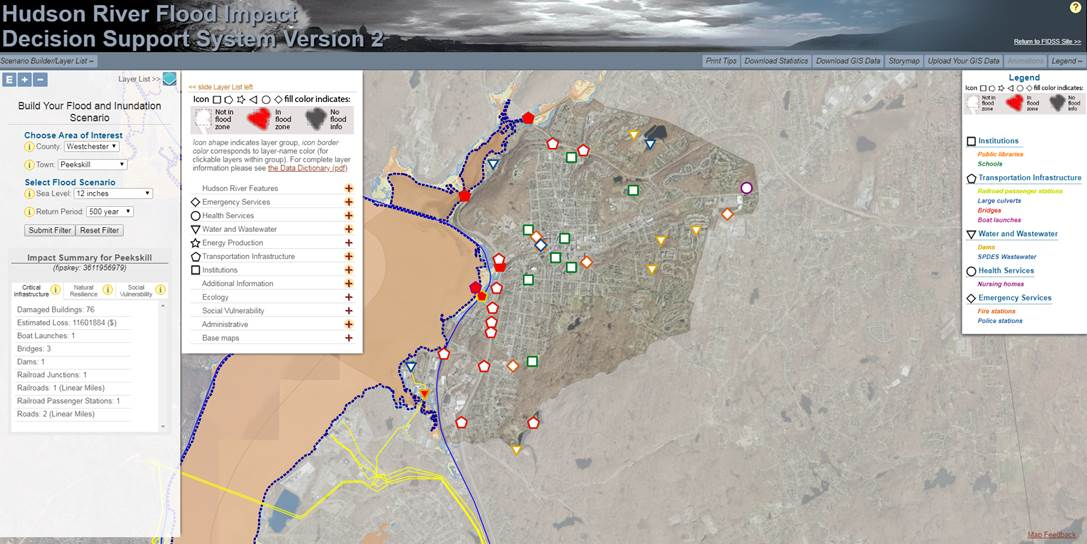
Within the geographic footprint that the application covers, users can scenario build and filter on a wide range of variables. In the example below, In the Choose Area of Interest pull-downs I selected both Westchester County and then the City of Peekskill. From Select Flood Scenario I choose a Sea Level Rise of 12 inches and the 500-year flood (Return Period). In the adjacent box I selected several features associated with the Water and Wastewater, Transportation Infrastructure, and Emergency Services among others. Finally, I clicked the Submit Filter button to run the scenario.
The viewer also includes several useful button/tabs above the viewing window providing the user with the ability to download both scenario-wide statistics in Excel format (Download Statistics) or in GIS format (Download GIS Data). Users can also upload their own GIS data into the application (Upload Your GIS Data).
Clicking the Critical Infrastructure Impact Summary button shows the results of the flooding effect on the selected features including 76 buildings, three bridges, one dams, an estimated loss of $1,601,884 and two linear miles of roadway can be compromised as well as the Peekskill train station. “The Impact Summary is one of the most useful tools of the Hudson River Flood Impact Decision Support Tool application” says Andy Peck, Ph.D, who works with The Nature Conservancy and has led numerous workshops along the Hudson River as part of the Community Resilience Building Workshop program. “It produces tangible, meaningful and valuable metrics, i.e., number of road miles, bridges, and other infrastructure components that community groups can relate to ” Peck went on to note similar HRFIDSS impact summaries were presented in the Hudson River community workshops in Red Hook and Rhinebeck earlier this year.
Climate Change, Flooding, and the Hudson River
The Hudson River viewer is part of a growing body of work and research focusing on the impacts of climate change throughout the Hudson River Valley and across the Empire State. Libby Zemaitis, Climate Change Program Coordinator, Hudson River Estuary Program | Cornell University, notes “We direct our municipal partners to the mapper all of the time and have a mapper comparison on one of our program webpages. (This is a really good comparison chart and worth a look – with HRFIDSS being one of the more comprehensive for the Hudson River). Libby’s team uses screen shots of the mapper in community presentations, reports and posters and use the raw data from the application to create their own maps in the Climate-adaptive Design (CaD) studio at Cornell University. “As a supporting agency, we continue to be very happy with the results of the Hudson River viewer” adds Amanda Stevens, Project Manager at NYSERDA, “it very comprehensive work and it is nice to see how it is being applied by the user community.”
The Hudson River Flood Impact Decision Support System is a free, publicly-available online tool design to help coastal communities in the Hudson River Valley better understand potential risks and impacts associated with a combination of storm related events, flooding, and sea level rise. If you live or work in these areas, it is worth taking the time to review and apply the application to your community.
The Editor acknowledges the work of Mark Becker (1961-2014) who served as the original Principal Investigator (PI) on this project.
Contact:
Kytt MacManus
GIS Developer, CIESIN, Earth Institute at Columbia University
Adjunct Lecturer, School of International and Public Affairs, Columbia University
Adjunct Lecturer, E3B Dept of Columbia College, Columbia University
PO Box 1000, 61 Rt 9W
Palisades NY 10964 USA
V: 845-365-8939 F: 845-365-8922
www.ciesin.columbia.edu
www.sedac.ciesin.columbia.edu