The American Recovery Plan Act (ARPA) of 2021: Where’s the GeoBeef?

There's lots of money out there. But few in the GIS community seem to be talking about it

During the waning months of my service with Westchester County last fall, I began to see references and documentation connecting geospatial technology to Coronavirus State and Local Fiscal Recovery Funds (SLFRF) program which was enabled as part of the American Rescue Plan Act (ARPA) passed earlier in 2021.  Earmarked monies for each government in New York State.  This was followed by passage of the Infrastructure Investment and Jobs Act (IIJA) passed in November 2021.   In general, SLFRF funding is more directed to local governments and IIJA funding being more focused on state government appropriations.  The progams certainly haven’t gone unnoticed by GIS software companies such as ESRI and Cartegraph which have published documentation outlining how specific categories of ARPA funding  can be used to support local government geospatial activities.  Even Autodesk, the AutoCAD giant, has recognized the relevance and importance of these landmark funding programs.

Empire State organizations such as the New York State Association of Towns (NYTOWNS), New York State Association of Counties (NYSAC) and the New York State Conference of Mayors and Municipal Officials (NYCOM) which represent the many levels of local governments across the state are also busy tracking funding allocations and keeping their own scorecards.  For example there is NYCOM’s Municipal ARPA Plans and Programs inventory, NYTOWNS procurement guide, and NYSAC’s county-level breakdown of funding   And there’s more.  The U.S Treasury Department’s Allocation for Metropolitan Cities  or the Brookings Local Government ARPA Investment Tracker.  Your county or municipality may have yet to make the connection to these geospatial opportunities.  

The Brookings ARPA Investment Tracker is one of several sites monitoring the use of grant funds. Erie County’s use of the funding is highlighted here with 92% of the funding being used for infrastructure purposes. Other New York State government interim reports can be found here.

But even with all of this publicly available information, and aggressive marketing by the vendor community, there seems to be a limited amount discussion about how these major federal grant funding programs can be woven into local geospatial initiatives.  And this is unfortunate because its very clear there ARE local activities which are “ARPA eligible” in the areas such infrastructure management, economic development, health and human services delivery, housing, transportation and community revitalization to name only a few.  So who is leading the statewide local government ARPA geospatial discussion?

Diving a little deeper, I took out attempting to survey the statewide local government geospatial community on the ARPA and IIJA programs by issuing a simple survey via the NYS GIS listserv, as well as having a link put on the NYS GIS Assocation’s website (thank you, Association webmasters).  Perhaps I would have gotten a better response to the survey offering links to both of the funding programs, but instead, wanted to capture the respondent’s immediate understanding/awareness of the programs when opening the survey.  Providing links to the programs would have defeated the purpose of the survey.   And I made it clear the survey was only for New York State local government users and/or their contractors.    That takes a lot of potential respondents off the table via the listserv and with local government representation in the Association hovering around less than 25% of the total membership, I wasn’t sure what the response would be.  Though not included in the images below, I emailed a handful of former county colleagues separately ahead of the online survey which resulted in very similar results.

The results can hardly be considered a statistically representative sample of the statewide local government GIS user community.  I received only 20 responses of which 18 provided usable data.   As such, I would submit the following pie charts can be considered illustrative or reflectiveof the current overall awareness, if not understanding, of the current ARPA funding programs.  While only a third of the respondents indicated they were even aware of the ARPA program (first pie chart),  there was barely any understanding of the funding as it relates to geospatial (second pie chart) and only one of the respondents indicated he/she had been involved in any discussions regarding the use of ARPA funding (third pie chart) in their organization.   Though to some degree many GIS practitioners across the state often hold down technical positions in department-line staff positions which are normally far removed from the grant funds discussions being held in much higher administrative offices.

Unfortunately, as historically been the case, the top level NYS government associations noted above have rarely made GIS/geospatial a visible and outward facing part of their agenda.  Even today, Its hard to find anything really meaningful for the local government GIS community when using keyword searchs such as  “GIS, geospatial, or mapping” on any of their websites.  And its highly doubtful there will be, or can be, any real meaningful advocacy through any state program offices as this political or elected official outreach framework doesn’t even exist on behalf of local government GIS programs.    As the next generation of local government GIS/geospatial programs evolve, particularly in the urban environments where the focus will be more on the public infrastructure, utilities, sustainability and climate change impacts, large scale and high resolution mapping and surveying – the collective internet of things (IoT) – discussions and geospatial strategies with most state government offices in this space will  become more distant.    Geospatial programs for different levels of government in New York State evolving in completely different directions.   Albeit for sure New York City is on a different level when is comes to infrastructure and underground mapping, but it’s Underground Infrastructure Project concept does represent an important direction of the next generation of local government GIS programs in urban areas across the state.  It’s just a matter of degree.

The list below, from an ESRI publication and is available on numerous websites, highlights the local government programs in play.  No, not necessarily direct funding to your GIS office, but does serve as a roadmap of who GIS practioners should be talking with at the local level.  EcoDev, public health, infrastructure and public works, and cooperative efforts with utilities.  And then find out who is administering your government’s ARPA funding.    You can be assured someone or some agency has dibs on the funding.  And apparently the GIS programs are only visible in the rearview mirrow. 

The four major ARPA funding program areas include:

1.  Support public health expenditures, by, for example, funding COVID-19 mitigation efforts, medical expenses, behavioral healthcare, and certain public health and safety staff
2.  Address negative economic impacts caused by the public health emergency, including economic harms to workers, households, small businesses, impacted industries, and the public sector
3.  Replace lost public sector revenue, using this funding to provide government services to the extent of the reduction in revenue experienced due to the pandemic

4.  Invest in water, sewer, and broadband infrastructure, making necessary investments to improve access to clean drinking water, support vital wastewater and stormwater infrastructure, and to expand access to broadband internet

Within these overall categories, recipients have broad flexibility to decide how best to use this funding to meet the needs of their communities

While actually securing funding is much easier said than done, often requiring great grant and proposal writing skills as well as involving many individual offices and agendas in the organization.  But the almost complete lack of even a discussion by the statewide local government GIS/geospatial community to date seems amiss.

There are so few funding opportunities such as these 2021 federal grant programs to take advantage of.  These are generational programs.  Right now the onus of finding representation and advocacy for local government GIS funding in the federal grants arena falls squarely on local government GIS leaders and their representatives.  As well as local GIS practitioners.

Right now, though, the silence is deafening.

Focus on Hudson River Flooding Impacts

Online Application Provides Tools and Data for Communities at Risk Along the Hudson River

Background

The Hudson River Flood Impact Decision Support System (HRFIDSS) is an online mapping application as well as a collection of geospatial products and data which illustrate the scale of potential flooding for tidally-affected shorelines of the Hudson River Valley and Westchester County coastal communities. In all, the viewer covers the shoreline communities in 11 counties in the region.  Developed by researchers from Center for International Earth Science Information Network (CIESIN), Stevens Institute of Technology, and the Columbia Water Center, the application enables individual residents, community groups as well as municipal and regional planners to evaluate risk based on potential outcomes, and to determine the impact on and effect of social vulnerability, natural resilience, and critical infrastructure.

The tool also provides downloadable estimates of flooding impacts, including affected population and critical infrastructure, and cost estimates of building damage.  It is further enhanced by including hydrological models which expands the flooding impacts to include storm tides/storm intensity and the contributions of river tributaries and streams.

The Hudson River Flood Impact Decision Support System helps address the growing interest across all levels of government in the New York region towards developing better forecasting capabilities and a better understanding of flood probabilities under a variety of sea level rise and storm frequency scenarios.

The application was developed using OpenLayers.  Critical infrastructure data is housed in a relational PostGIS database which are served as a Web Feature Service (WFS) using Geoserver.  Flood layers are raster data published from an ArcGIS Server at CIESIN while supporting imagery layers are consumed from New York State.

Impact Assessments

In addition to a variety of unique mapping tools, one of key features of the application is the generation of “Impact Assessments”.  These are generated by application flood maps using a combination of historical and synthetic flood events which include water depth, surge, rainfall, and  sea level rise scenarios of 0″, 6″, 12″, 18″, 24″, 30″, 36″, 48″, 60″, 72″ as well as 5-year through 1000-year flood zones.  Flood scenarios presented in the mapping tool are accompanied by a set of impact estimates at the local level. These are divided into three themes: critical infrastructure, social vulnerability, and natural resilience features.
Continue reading

The Essential New York Climate Change Science Clearinghouse

There is no lack of geographic information these days on Climate Change and its increasing impacts across the Empire State in the areas of sea level rise, rising heat indexes, more frequent and intense storms, changes to the natural environment and critical habitats, and its influence on a broad range of public health issues to name only a few.  And we see geospatial technologies at the core of sciences being used to analyze, respond, and prepare for future consequences.

Whether it be policymakers, planners, business and industry, residents or community groups, New York State is fortunate to have its own geocentric one-stop website on climate change issues as part of the New York Climate Change Science Clearinghouse (NYCCSC).   Hosted by NESCAUM (Northeast States for Coordinated Air Use Management) , NYCCSC contains documents, data, websites, tools, and maps relevant to climate change adaptation and mitigation across New York State. The goal of the NYCCSC is to support scientifically sound and cost-effective decision-making. It was developed to provide a framework where users can find information in multiple ways, including through interactive tools that use data from different sources.

Established in 2015, the site today contains nearly 2100 resources including over 200 web maps and viewers and an assortment of data products and datasets and is curated by Ingrid H. H. Zabel, Ph.D.  Initially the site was populated by resources that had been referenced in the 2011 ClimAID Report and several other key documents, as well as resources identified by groups of sector experts.  Today, the site curator continues to seek out new content from a variety of sources to keep the site current and fresh.  Submissions to the Clearinghouse are welcome though each are reviewed based on relevance, utility, credibility, and accessibility as described in the site’s Business Rules.   The underlying mission of the site is to provide resources that are relevant to communities of many different sizes around New York State, are focused on practical, applied science and that are open access as much as possible.

Dr. Zabel is assisted by a Content Team and Sector Expert Groups consisting of individuals originally involved in the development of the site, from Cornell’s Northeast Regional Climate Center, the Paleontological Research Institution,  , Northeast States for Coordinated Air Use Management (NESCAUM), Frontier Spatial, and New York State Energy and Research Development Authority (NYSERDA). The sector experts were identified by NYSERDA, NYS Department of Environmental Conservation, and the NYCCSC team, and include individuals from New York state agencies, academia, and nonprofits such as (New England Interstate Water Pollution Control Commission (NEIWPCC),  , and the New York State Floodplain and Stormwater Managers Association (NYSFSMA).

Users can explore and mine through the site via ad hoc interactive mapping, topic specific web maps, data charts, and for published documents and reports.  In addition to offering advanced search tools, site content is also grouped thematically in categories such as Climate and Weather, Sea Level, Energy, Flooding, Plants and Animals, Social and Economic, among others.

Some options on the user interface to dive in and start searching for data include:

Interactive Mapping and Web Maps

One of the focal points of the website is an interactive map of climate change and related data for New York State.   Users can select data layers to display from a menu, filter layers by sector, vary parameters within certain layers, and select from a variety of base layers and regional boundaries. For each layer, links are available to metadata and the original source. Data being made available in the viewer has been curated through more of a group effort, with the NYCCSC team getting requests and feedback from a variety of places, including project managers (NESCAUM) and sponsor (NYSERDA).

The NYCCSC interactive mapper also leverages map services from authoritative sources. For example, this GAP Land Cover Dataset is a service being published by the USGS. Users can click the ‘i’ icon for a given layer which provides metadata on relevant URLs. The interactive mapper also includes a function for the user to add a map layer of their own using the Layer Import button found along the toolbar in the upper right hand corner of the viewer (circled in red). Imported layers do not get added to the map permanently, but rather are a means to temporarily “mash-up” local data with the permanent collection of content in the application

The site is built almost exclusively with open source products and largely supported by Steve Signell at Frontier Spatial.  PostgreSQL is the geodatabase used to store and manage map layers and metadata.  A combination of Geoserver and Leaflet are used to create and manage the web services and support the user interface. Javascript and CSS coding was used to create the custom UI and map functions.

If you’re looking for standalone web and story maps for specific Empire State climate change issues – look no further. As the date of publication of this article, the site listed 203 separate maps from a wide variety of contributors including this one from Westchester County focusing on the potential impacts of sea level rise on critical infrastructure assets.

Among the many great offerings, sites found in the catalog of interest include The Natural Resources Navigator (The Nature Conservancy), New York State Geographic Information Gateway (NYS Department of State), Surging Seas Risk Zone Map:  New York (Climate Central), Environmental Justice Screening and Mapping Tool (U.S. Environmental Protect Agency), and Trees for Tribs Statewide Data Explorer (New York Natural Heritage Program) to name only a few.

Climate Data Grapher

User-generated time series graphs of climate data, both observed and projected (future and historical.)  The data grapher provides access to climate data which can be summarized by the user according to various geographic units such as counties. The same summaries are used in the maps & GIS viewer to attribute the corresponding map layers for county and watershed boundaries.  Both user interfaces (Interactive Mapping and Data Grapher) draw on the same raw data sources but offer different capabilities for query, summary and visualization.

I used the interactive graphing tool to plot Westchester’s Winter Average Temperature. It’s one of
19 types of climate related data which can be charted by either geographic area: state, county, or river basin. (Upper left hand corner pull-down). Other datasets area available by gauging and/or weather stations. The chart renders different results depending on which RCP radio button (4.5 or 8.5) is selected. RCP (Representative Concentration Pathway) 4.5 and 8.5 are scenarios of future climate change based on varying degrees of societal progress in reducing human contributions to greenhouse warming.

Documents

A wide range of documents and reports on statewide climate change issues including the author(s) or publishing agency, a pdf download option and where available a corresponding website URL. The first document itemized –  a document central to the launch of the site – is  Responding to Climate Change In New York State: The ClimAID Integrated Assessment for Effective Climate Change Adaptation in New York State: Final Report (2011) which provided information on climate change impacts and adaptation for eight sectors in New York State: water resources, coastal zones, ecosystems, agriculture, energy, transportation, telecommunications, and public health.

The 2011 ClimAID report is one of the first comprehensive and definitive compilations on the many challenges on impacts of climate change across New York State.

Summary

NYCCSC is a huge repository of geospatial and other content focusing on the ongoing and constantly evolving Empire State climate change issue being made available by a wide range of publishers including governments, academia, nonprofits, and industry.     And whereas much New York State climate change focus in recent years has concentrated on the impacts to our coastal communities (i.e., due to sea level rise, hurricanes/severe weather events, storm surges –  much of which is included in the repository), NYCCSC offers content and case studies covering the entire New York State footprint.   Sometimes, however, the scale of the data associated with individual sites can be an issue when looking at issues at the local level.   But nonetheless the data is there.  Itemized websites are always a good starting point for metadata, individual dataset downloads or access to public facing REST endpoints.  .

It takes a considerable amount of effort and oversight to keep such online clearinghouses up-to-date and to this end NYCCSC is fortunate to have an ongoing relationship with NYSERDA for continued support of the project.  NYCCSC continues to welcome submissions but does not accept every resource that is submitted. At the bottom of the site landing page there is a button labeled “Propose Content” which provides access to a form in which content can be proposed.

Contact:

Ingrid H. H. Zabel, Ph.D.
Climate Change Education Manager and Curator, New York Climate Change Science Clearinghouse
Paleontological Research Institution, Affiliated with Cornell University
(607) 273-6623, ext. 122
info@nyclimatescience.org
nyclimatescience.org

10 Questions: Bob Wills

Bob Wills, Senior GIS Project Coordinator, Dutchess County Department of Planning and Development has been a mainstay with the Dutchess County GIS program for over twenty years and involved in many Lower Hudson River Valley geospatial projects.  Widely recognized across the state, Dutchess County GIS exemplifies a federated style of GIS development across the enterprise by supporting and building GIS capacity in different program areas. While the geospatial concepts are very similar, though very different, Bob came into the GIS space with an architectural background. He is a Registered Architect in the State of New York and board Certified by the National Council of Architectural Registration Boards (NCARB). I recently caught up with him to talk about the Dutchess County GIS program, it”s history, and current efforts.

Continue reading

10 Questions: Michael R. Martin, CLM

GIS applications in water quality analysis and mapping historically have not been one of the more visible uses of geospatial technology across the Empire State.  While revisiting some of my contacts in the Adirondack Region, I connected with Michael Martin, CLM (Certified Lake Manager) at Cedar Eden Environmental. Michael has a long history of professional work based in the North County which intersects mapping and geospatial data collection with water quality analysis, watershed management, and land use planning. He is actively involved in several professional organizations and continues to work across the region.

eSpatiallyNewYork: How did Cedar Eden Environmental get started? 

Martin:  I started Cedar Eden Environmental after 16 years in the environmental field working in the public, private and non-profit sectors. I was born and raised in New Hampshire and had an interest in the environment, lakes and ponds in particular, from a very early age. I attended the University of New Hampshire when, at the time, there was no such thing as a degree in Limnology (the study of freshwater systems), so UNH co-taught limnology through the Botany and Zoology departments. While at UNH, I specialized in phytoplankton and limnology. After graduating with a BS in Botany, I was hired by the State of New York’s Department of Environmental Services in the limnology department, where I sampled numerous lakes around the state and became the State’s expert on phytoplankton. From there, I went to work for an environmental consultant in Pennsylvania. In 1992, I moved to the Adirondacks to establish the Adirondack Aquatic Institute, a non-profit research institute focused on human impacts to water quality. Over the past 30 years I have worked throughout New England, the Northeast, the Adirondacks, Mid-West and West Coast diagnosing water quality issues, conducting environmental monitoring and developing holistic, long-term water quality and aquatic plant management plans for individuals, municipalities, water suppliers, lake associations, environmental organizations, NGOs and government agencies.  In addition to my business, I established a non-profit educational outreach, LakeStewardship.org, in 2006 to promote lake and environmental stewardship in North America and to serve as a resource for lake residents, lake associations, lake managers and cottage owners associations.

eSpatiallyNewYork: So lake, watershed and environmental management services are the focus of your work?

Martin: The main focus of my work is on environmental management, especially lake water quality, watershed management and aquatic plant management. What happens on the land within a watershed determines the water quality of downstream water bodies. I use a combination of data collection, data analysis and geographic data processing in the development of management plans. I also use GIS-based models and GIS-derived data to predict the impact of land use and changing land use on water quality. In addition to lake and watershed management planning, I have been involved in a number of projects that evaluate large datasets consisting of 10 to 20 years of data, where I use GIS and statistical software to analyze both temporal and geographic trends in water quality.

 eSpatiallyNewYork:  Tell us a little about your geospatial background and how you introduced it into Cedar Eden’s client service.  

In 1980, my college advisor had an interest in acid rain impacts and got me started on creating isopleth curves for pH and alkalinity in NH lakes. This was very early GIS so I had to digitize everything on a large table-sized digitizing board, including the outline of the State of New Hampshire and the locations of each of the lakes in the state. I developed algorithms to convert point data into isopleth curves across the state. This fascinating work got me interested early on in the power of geographic tools for environmental assessment. While working for NH  Department of Environmental Services I sampled lakes and built computer models to evaluate the impact of development on lakes.  As a result, I was asked to serve on NH’s GIS Steering Committee.  Examples of CEE’s GIS work can be found on my website.

Having grown up along with GIS, I am thrilled by the availability of data nowadays. Gone are the days when users would have to digitize everything by hand such as soil polygons from county soil books and wait overnight while our computers geo-rectified and created topology for the digitized layers (and hope the application didn’t crash during the night). I have been using ESRI products since the beginning, starting with ArcCAD and some early desktop mapping products. I was one of only 100 worldwide recipients of the Geodyssey Environmental GIS research Grants sponsored by ESRI & AuotDesk for using desktop GIS technology in environmental applications. As recipients, we were brought to Redlands, CA for training at ESRI headquarters.  Currently, I am using ArcGIS 9.x and use readily-available base data as the starting point for my projects. I have not upgraded to ArcGIS 10 although I have used ArcGIS 10 while working on subcontracts. I use standard GPS (Garmin Oregon 650t) and GPS-enabled depth finders (Eagle/Lowrance Model 480 Recording Sonar\GPS+WAAS Mapping Unit) for data collection since I generally do not need sub-foot accuracy for my projects. I have been involved in several projects requiring more accuracy and have subcontracted for digital surveying and digital topography from aerial photography. In my space, the use of drones has the potential to assist in efforts  like aquatic plant mapping.

eSpatiallyNewYork:  How does water-based (surface, submerged, etc) geospatial data collection differ from land based data collection?

Martin: Geospatial data collection for water-based applications is similar to land-based applications, though it tends to be more time-consuming. On land, you are able to stand still while acquiring data but this is not possible while floating on a lake.  This is an area where I believe there will be growth in the use of drones  – mapping features (like aquatic plants) in open water.  Generally, however, because we do not need sub-foot accuracy, we are able to acquire data while moving. For instance, to create a bathymetric map, we use a GPS-enabled fathometer that continuously records water depth and location. The same system can be used to map the edges of a littoral zone (area of plant growth) of a lake by driving a boat towards and away from land and triggering a waypoint each time the edge of the littoral zone is passed over.

 eSpatiallyNewYork:  Cedar Eden has been involved in some focused non-watershed/water quality mapping projects such as agricultural inventories – what can you tell us about these projects?

Martin: CEE has been involved in a number of non-watershed mapping projects. In Fulton County, we provided mapping for use in the development of an updated county-wide agricultural management plan. In Lewis and Columbia Counties in the early 2000s, I created master GIS libraries and provided on-site GIS training for their County Soil & Water Conservation Districts (SWCD). Columbia County SWCD was particularly interested in the Hudson River Valley, so I also created a detailed topographic and resource-based map of the Hudson River Valley. The Town of Santa Clara is close to my office in Saranac Lake and is adjacent to one of the largest Adirondack lakes which I have studied for years. In the mid-1990s I was asked by the Town to prepare a new zoning map for them. I saw this as a perfect opportunity to utilize GIS for its data management and mapping capabilities. I worked with the Town Supervisor to transform the Adirondack Park Agency land use map into town-based zoning.

eSpatiallyNewYork:  Cedar Eden was part of a Statewide Agricultural Environmental Management (AEM) GIS project.  What was the size/scope of this project?

Martin:  The Statewide AEM program is a tool used by the County SWCDs to monitor and assist agricultural activities within their respective counties with the goal of minimizing environmental impact. I was hired by NYS Department of Agriculture and Markets and the NYS Soil & Water Conservation Committee early on to develop a GIS-based data entry and management system so that each county could track AEM participation using GIS and so that the State could evaluate statewide trends in AEM. I built customized GIS base layer datasets for each county, created a data entry system using Visual Basic and then traveled around the State teaching the counties how to use the new program. I also collated all of the initial data into a statewide GIS and provided the initial statewide analysis of the results from the program. The AEM program is still in use today, tracking agricultural entity’s participation in various incentives designed to minimize the environmental impact of agricultural activities.

eSpatiallyNewYork:  You’re involved in professional organizations such as the North American Lake Management Society, New York Federation of Lake Associations, Certified Lake Managers, what is the role of geospatial technologies in these circles/organizations?  Is geospatial a “must-have” skill set to work in water quality/watershed management disciplines?

Martin:  Involvement in relevant organizations is important to both gain and share knowledge. I was past-president of the North American Lake Management Society (NALMS), past Regional Directors for NALMS and the New York Federation of Lake Associations and was a founding member of the Indiana Lake Management Society. I am a Certified Lake Manager through NALMS. Early on, geospatial technologies were experimental and research-based. Over time, as the technologies matured, and the usefulness of their application became apparent, geospatial technologies began to move into the fields of limnology and watershed management; and therefore knowledge of these technologies became known.   GIS/geospatial are must-have skills for anyone wishing to start out in the environmental fields as geospatial information & analysis are important and pervasive tools in environmental management. There is virtually no application of applied limnology or applied environmental management where geospatial information is not processed. Citizen scientists are now being taught the use of geodata collection and geospatial mapping in order to conduct their own mapping of aquatic plants and map the locations of invasive species.

 eSpatiallyNewYork:  Invasive species is a major concern across the Empire State today. How is this playing out in your work?

Martin:  I have been involved with invasive species since I graduated in 1984. Invasive species issues have always been a concern in the northeastern United States, but where we once were projecting what might happen we are now dealing with the realities of those projections.  Invasive species are a present threat to much of what we value as natural systems, both aquatic and terrestrial. CEE work focuses primarily on the aquatic side and I am asked to deal with aquatic plant management planning more and more. It is hard to get folks to focus on much else when they see their lake being covered by Eurasian milfoil or some other aquatic non-native species. Invasive species alter the entire ecosystem, including nutrient cycles, within a lake and managing invasive species becomes an integral part of overall lake management.  I work  with a number of lake communities  now who are attempting to restore a balanced aquatic plant community because they relied on the advice of  lake management companies which over-treated the lake and had all of their native plants wiped out along with the non-native (invasive) species.

 eSpatiallyNewYork:  Do you attend any of the statewide GIS conferences?

Martin:  I do not regularly attend GIS conferences. I have attended these in the past but found that the focus was not generally in my area of interest. However, I do have information to share on the use of GIS in environmental management and will look into future conferences.  However, when I attend regional, state and international environmental conferences, I follow and often contribute to the GIS & geospatial tracks. These conferences include the North America Lake Managements Society’s (NALMS) International Symposium, the New York State Federation of Lake Associations’ annual conference, the New England Chapter of NALMS and others.

eSpatiallyNewYork:  What’s your association with the Adirondack Watershed Institute?  What other organizations do you work and collaborate with in the Adirondacks?

Martin:  In 1991, I was the founding Executive Director of the Adirondack Aquatic Institute at Paul Smith’s College. When I left in 2000, the institute was renamed the Adirondack Watershed Institute (AWI).  Today, I am only tangentially involved with their operations and occasionally   utilize their water quality laboratory for projects. I continue to stay active with the Adirondack Lakes Alliance as well as the NYS Federation of Lake Associations and the various NYS Partnerships for Regional Invasive Species Management (PRISM).

 eSpatiallyNewYork: Who are you working with now?

Martin: I have a number of municipal and association clients. On the lake management side, one of my longest running clients is the Mount Arab Preserve Association. I have been monitoring their two lakes since 1992 when I was at the Adirondack Aquatic Institute. They have stuck with me through all my career moves and we will be starting up our 27th year of monitoring this June. On the geospatial side, I am once again working with the Town of Santa Clara. The Planning Board has asked me to update the Town’s zoning map. When the map was initially created using the APA land class map, there was no parcel information and the scale of the source maps were to great for any accuracy. The Town had an issue when a property was being sold and it wasn’t clear from the existing maps what the zoning was (the parcel appeared to be split into two zones). As a result, I am in the process of using parcel maps to ensure that zoning is accurate at the parcel level. This is an iterative process, involving GIS mapping and then consultations with the Planning Board to resolve issues where the intended zoning isn’t clear at parcel-level scale. I also have a number of lake and plant management planning clients, primarily located in eastern NYS.

eSpatiallyNewYork: What’s the next big thing in New York State water quality?  

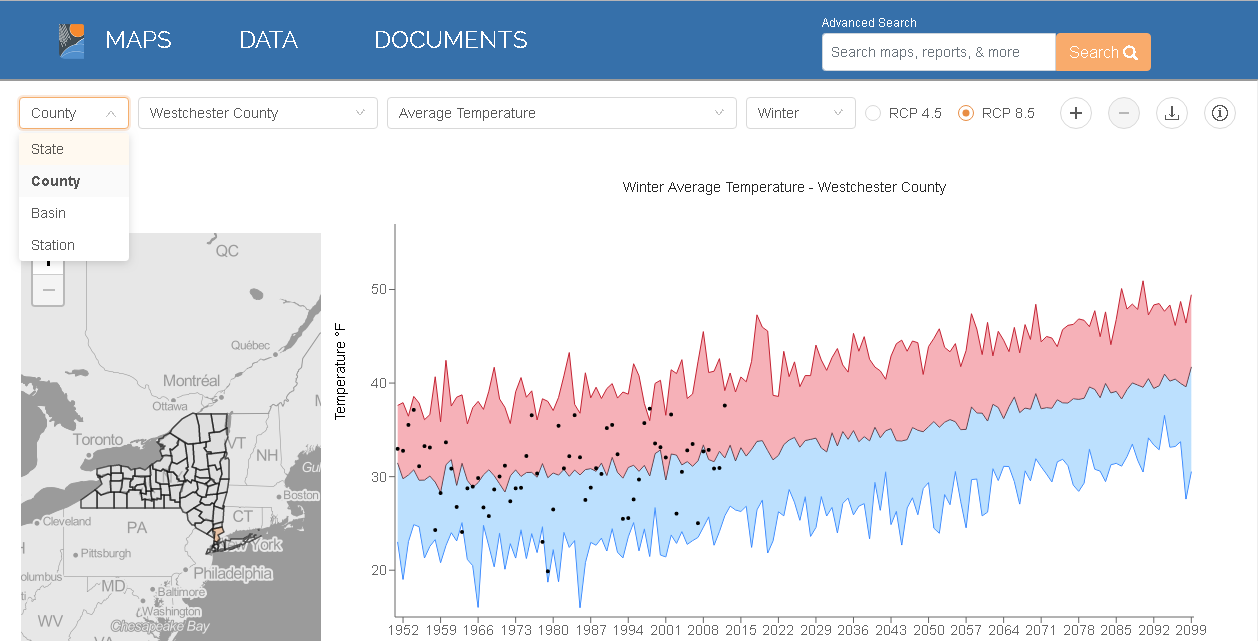
Martin:  In addition to invasive species, climate change is having a noticeable detrimental impact on the water quality of NYS’s lakes and ponds. Lakes are becoming warmer in the summer and the ice-free season is becoming longer. As a result, I see more and more lakes experiencing blooms of cyanobacteria (bluegreen algae) which are potentially toxic. Managing nutrient levels that control the growth of algae and managing aquatic plants (native and non-native) become more critical as the waters warm and the growing season lengthens. This can only be done through a combination of in-lake and land-based solutions to nutrient pollution control. It is critical that lake associations and municipalities begin to manage water quality in the long-term using a planning-based approach rather than in the short-term, using chemicals to treat symptoms. The latter approach may provide short-term relief, but it further destabilizes the ecosystem, causing chemical-dependency and additional water quality problems.

For more information, contact Michael Martin @ mmartin@cedareden.com.