Focus on Hudson River Flooding Impacts

Online Application Provides Tools and Data for Communities at Risk Along the Hudson River

Background

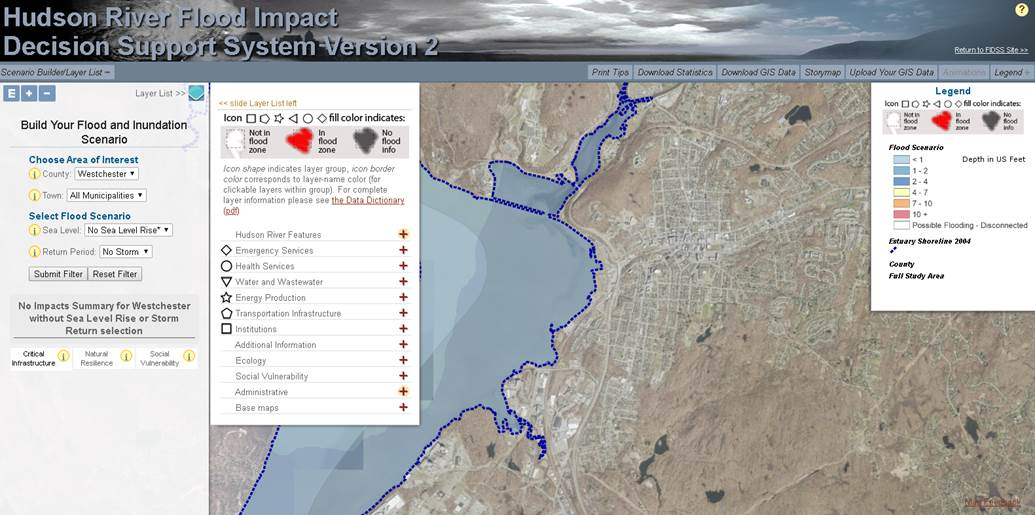
The Hudson River Flood Impact Decision Support System (HRFIDSS) is an online mapping application as well as a collection of geospatial products and data which illustrate the scale of potential flooding for tidally-affected shorelines of the Hudson River Valley and Westchester County coastal communities. In all, the viewer covers the shoreline communities in 11 counties in the region.  Developed by researchers from Center for International Earth Science Information Network (CIESIN), Stevens Institute of Technology, and the Columbia Water Center, the application enables individual residents, community groups as well as municipal and regional planners to evaluate risk based on potential outcomes, and to determine the impact on and effect of social vulnerability, natural resilience, and critical infrastructure.

The tool also provides downloadable estimates of flooding impacts, including affected population and critical infrastructure, and cost estimates of building damage.  It is further enhanced by including hydrological models which expands the flooding impacts to include storm tides/storm intensity and the contributions of river tributaries and streams.

The Hudson River Flood Impact Decision Support System helps address the growing interest across all levels of government in the New York region towards developing better forecasting capabilities and a better understanding of flood probabilities under a variety of sea level rise and storm frequency scenarios.

The application was developed using OpenLayers.  Critical infrastructure data is housed in a relational PostGIS database which are served as a Web Feature Service (WFS) using Geoserver.  Flood layers are raster data published from an ArcGIS Server at CIESIN while supporting imagery layers are consumed from New York State.

Impact Assessments

In addition to a variety of unique mapping tools, one of key features of the application is the generation of “Impact Assessments”.  These are generated by application flood maps using a combination of historical and synthetic flood events which include water depth, surge, rainfall, and  sea level rise scenarios of 0″, 6″, 12″, 18″, 24″, 30″, 36″, 48″, 60″, 72″ as well as 5-year through 1000-year flood zones.  Flood scenarios presented in the mapping tool are accompanied by a set of impact estimates at the local level. These are divided into three themes: critical infrastructure, social vulnerability, and natural resilience features.
Continue reading

The Essential New York Climate Change Science Clearinghouse

There is no lack of geographic information these days on Climate Change and its increasing impacts across the Empire State in the areas of sea level rise, rising heat indexes, more frequent and intense storms, changes to the natural environment and critical habitats, and its influence on a broad range of public health issues to name only a few.  And we see geospatial technologies at the core of sciences being used to analyze, respond, and prepare for future consequences.

Whether it be policymakers, planners, business and industry, residents or community groups, New York State is fortunate to have its own geocentric one-stop website on climate change issues as part of the New York Climate Change Science Clearinghouse (NYCCSC).   Hosted by NESCAUM (Northeast States for Coordinated Air Use Management) , NYCCSC contains documents, data, websites, tools, and maps relevant to climate change adaptation and mitigation across New York State. The goal of the NYCCSC is to support scientifically sound and cost-effective decision-making. It was developed to provide a framework where users can find information in multiple ways, including through interactive tools that use data from different sources.

Established in 2015, the site today contains nearly 2100 resources including over 200 web maps and viewers and an assortment of data products and datasets and is curated by Ingrid H. H. Zabel, Ph.D.  Initially the site was populated by resources that had been referenced in the 2011 ClimAID Report and several other key documents, as well as resources identified by groups of sector experts.  Today, the site curator continues to seek out new content from a variety of sources to keep the site current and fresh.  Submissions to the Clearinghouse are welcome though each are reviewed based on relevance, utility, credibility, and accessibility as described in the site’s Business Rules.   The underlying mission of the site is to provide resources that are relevant to communities of many different sizes around New York State, are focused on practical, applied science and that are open access as much as possible.

Dr. Zabel is assisted by a Content Team and Sector Expert Groups consisting of individuals originally involved in the development of the site, from Cornell’s Northeast Regional Climate Center, the Paleontological Research Institution,  , Northeast States for Coordinated Air Use Management (NESCAUM), Frontier Spatial, and New York State Energy and Research Development Authority (NYSERDA). The sector experts were identified by NYSERDA, NYS Department of Environmental Conservation, and the NYCCSC team, and include individuals from New York state agencies, academia, and nonprofits such as (New England Interstate Water Pollution Control Commission (NEIWPCC),  , and the New York State Floodplain and Stormwater Managers Association (NYSFSMA).

Users can explore and mine through the site via ad hoc interactive mapping, topic specific web maps, data charts, and for published documents and reports.  In addition to offering advanced search tools, site content is also grouped thematically in categories such as Climate and Weather, Sea Level, Energy, Flooding, Plants and Animals, Social and Economic, among others.

Some options on the user interface to dive in and start searching for data include:

Interactive Mapping and Web Maps

One of the focal points of the website is an interactive map of climate change and related data for New York State.   Users can select data layers to display from a menu, filter layers by sector, vary parameters within certain layers, and select from a variety of base layers and regional boundaries. For each layer, links are available to metadata and the original source. Data being made available in the viewer has been curated through more of a group effort, with the NYCCSC team getting requests and feedback from a variety of places, including project managers (NESCAUM) and sponsor (NYSERDA).
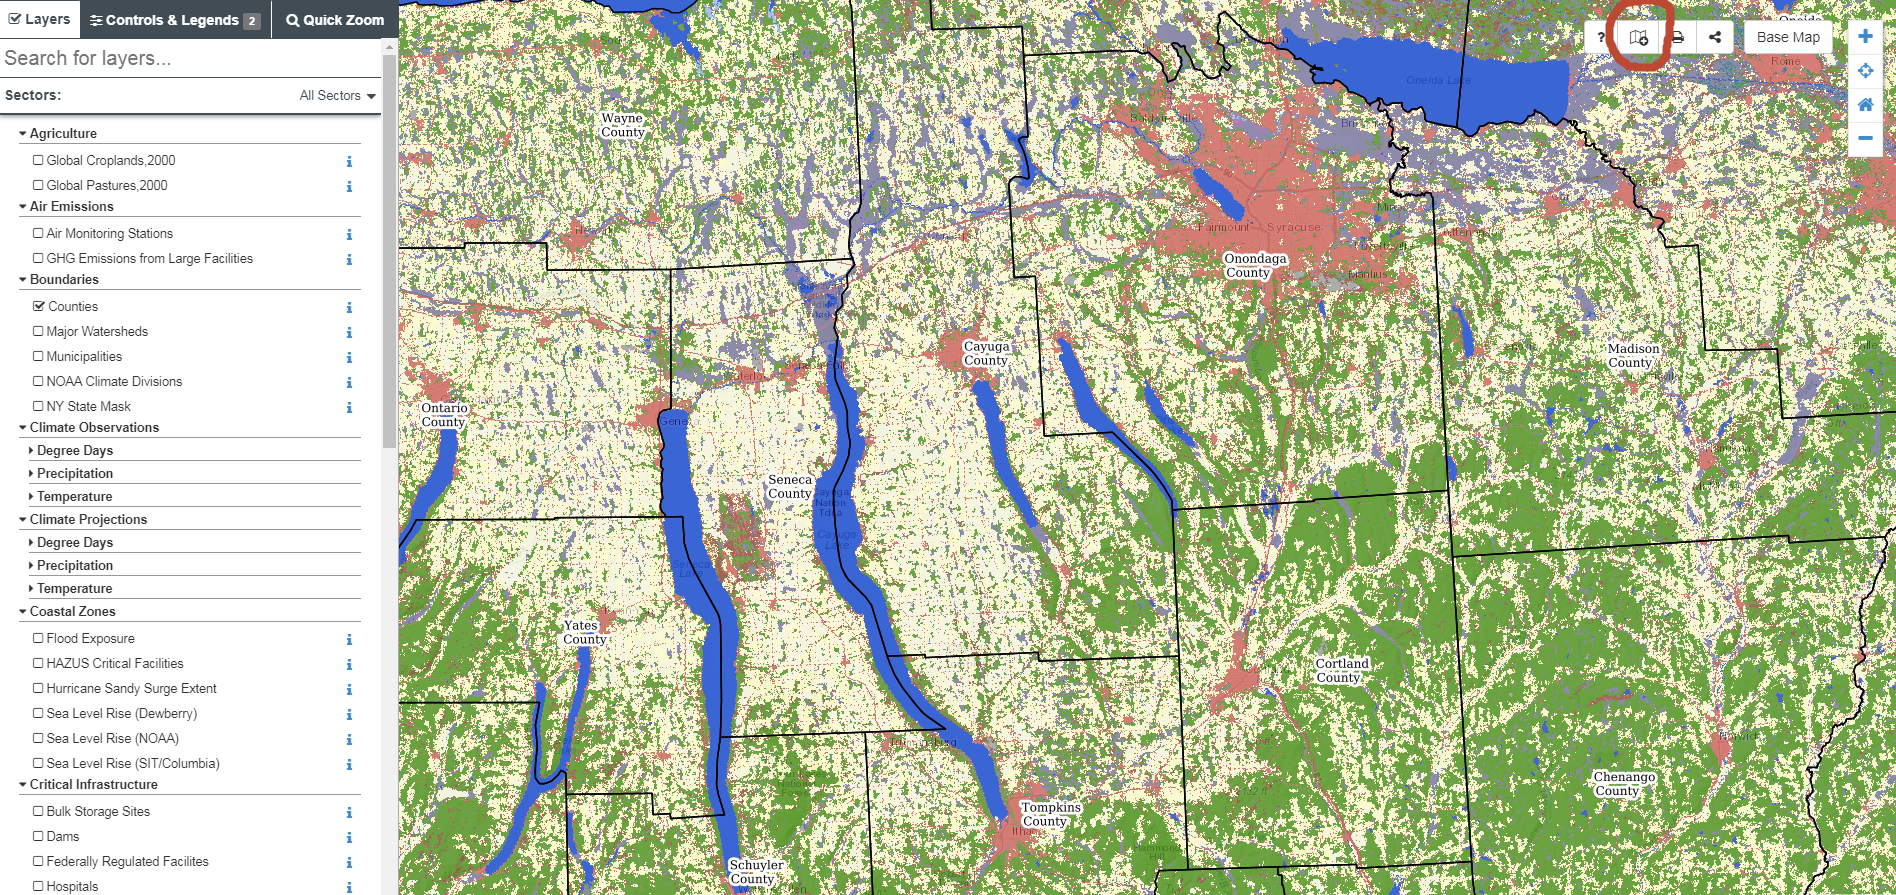
The NYCCSC interactive mapper also leverages map services from authoritative sources. For example, this GAP Land Cover Dataset is a service being published by the USGS. Users can click the ‘i’ icon for a given layer which provides metadata on relevant URLs. The interactive mapper also includes a function for the user to add a map layer of their own using the Layer Import button found along the toolbar in the upper right hand corner of the viewer (circled in red). Imported layers do not get added to the map permanently, but rather are a means to temporarily “mash-up” local data with the permanent collection of content in the application

The site is built almost exclusively with open source products and largely supported by Steve Signell at Frontier Spatial.  PostgreSQL is the geodatabase used to store and manage map layers and metadata.  A combination of Geoserver and Leaflet are used to create and manage the web services and support the user interface. Javascript and CSS coding was used to create the custom UI and map functions.
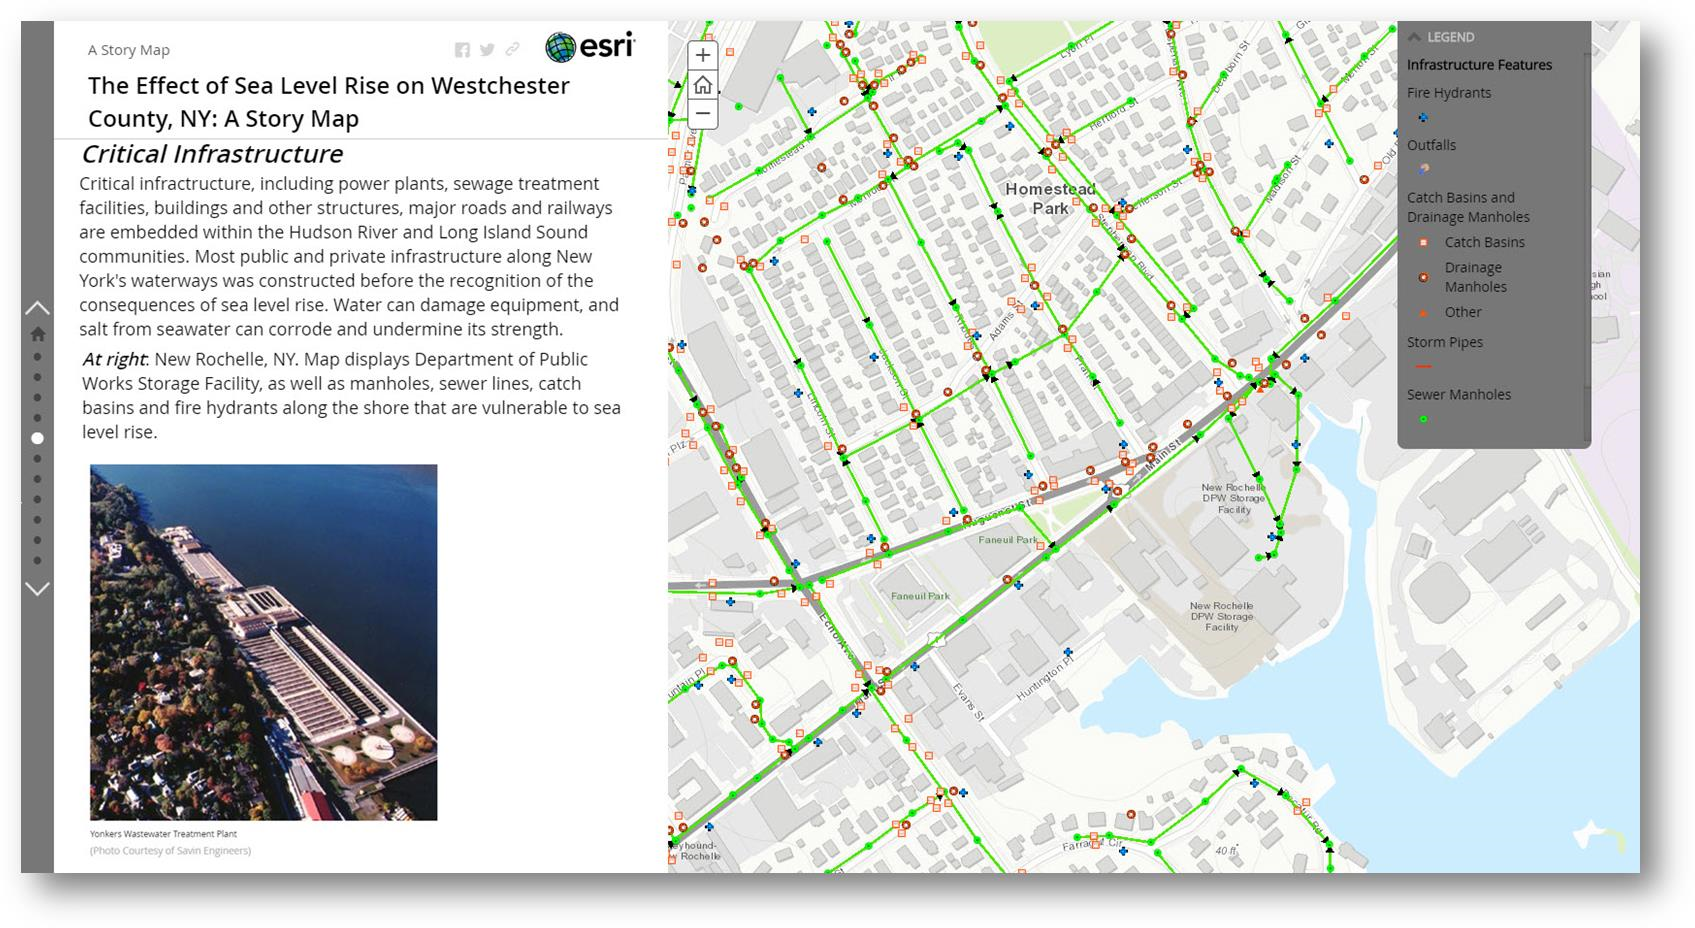
If you’re looking for standalone web and story maps for specific Empire State climate change issues – look no further. As the date of publication of this article, the site listed 203 separate maps from a wide variety of contributors including this one from Westchester County focusing on the potential impacts of sea level rise on critical infrastructure assets.

Among the many great offerings, sites found in the catalog of interest include The Natural Resources Navigator (The Nature Conservancy), New York State Geographic Information Gateway (NYS Department of State), Surging Seas Risk Zone Map:  New York (Climate Central), Environmental Justice Screening and Mapping Tool (U.S. Environmental Protect Agency), and Trees for Tribs Statewide Data Explorer (New York Natural Heritage Program) to name only a few.

Climate Data Grapher

User-generated time series graphs of climate data, both observed and projected (future and historical.)  The data grapher provides access to climate data which can be summarized by the user according to various geographic units such as counties. The same summaries are used in the maps & GIS viewer to attribute the corresponding map layers for county and watershed boundaries.  Both user interfaces (Interactive Mapping and Data Grapher) draw on the same raw data sources but offer different capabilities for query, summary and visualization.
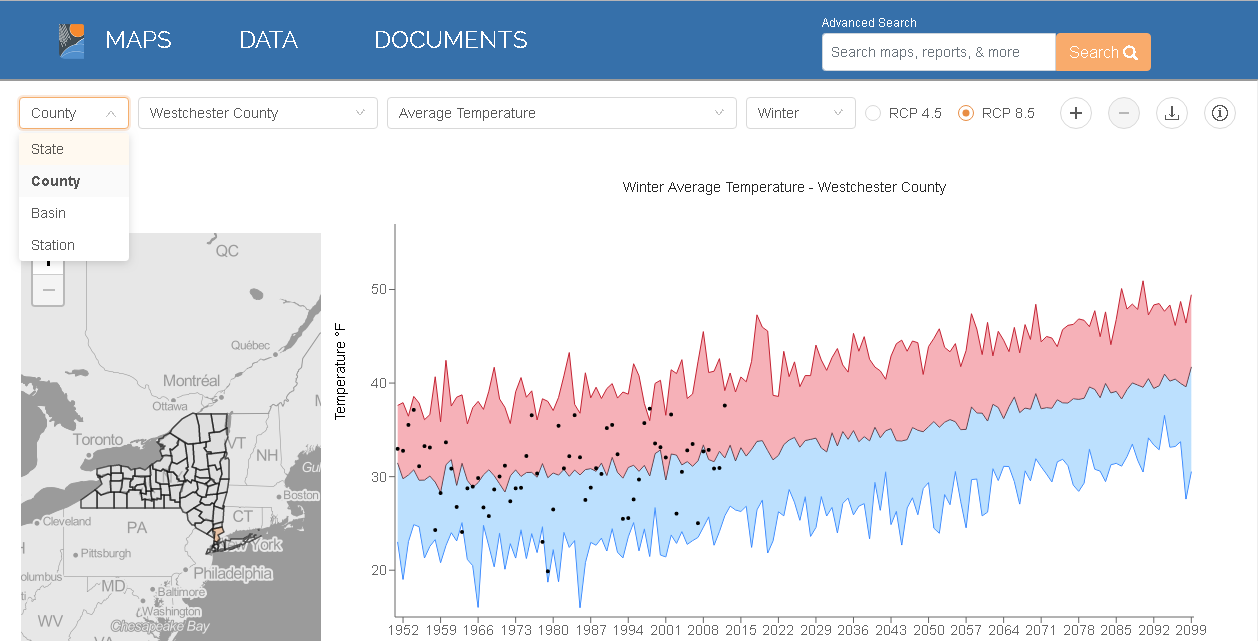
I used the interactive graphing tool to plot Westchester’s Winter Average Temperature. It’s one of
19 types of climate related data which can be charted by either geographic area: state, county, or river basin. (Upper left hand corner pull-down). Other datasets area available by gauging and/or weather stations. The chart renders different results depending on which RCP radio button (4.5 or 8.5) is selected. RCP (Representative Concentration Pathway) 4.5 and 8.5 are scenarios of future climate change based on varying degrees of societal progress in reducing human contributions to greenhouse warming.

Documents

A wide range of documents and reports on statewide climate change issues including the author(s) or publishing agency, a pdf download option and where available a corresponding website URL. The first document itemized –  a document central to the launch of the site – is  Responding to Climate Change In New York State: The ClimAID Integrated Assessment for Effective Climate Change Adaptation in New York State: Final Report (2011) which provided information on climate change impacts and adaptation for eight sectors in New York State: water resources, coastal zones, ecosystems, agriculture, energy, transportation, telecommunications, and public health.
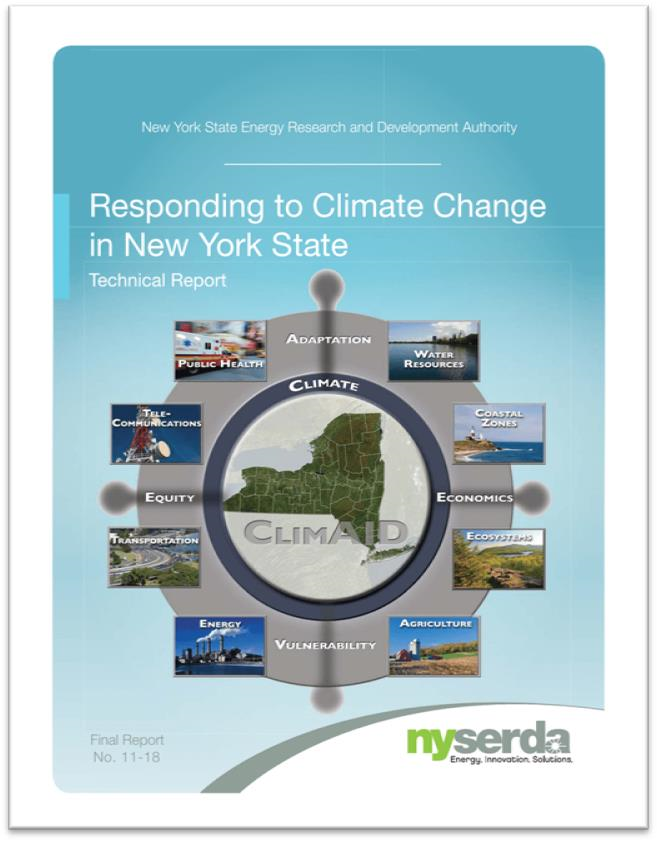
The 2011 ClimAID report is one of the first comprehensive and definitive compilations on the many challenges on impacts of climate change across New York State.

Summary

NYCCSC is a huge repository of geospatial and other content focusing on the ongoing and constantly evolving Empire State climate change issue being made available by a wide range of publishers including governments, academia, nonprofits, and industry.     And whereas much New York State climate change focus in recent years has concentrated on the impacts to our coastal communities (i.e., due to sea level rise, hurricanes/severe weather events, storm surges –  much of which is included in the repository), NYCCSC offers content and case studies covering the entire New York State footprint.   Sometimes, however, the scale of the data associated with individual sites can be an issue when looking at issues at the local level.   But nonetheless the data is there.  Itemized websites are always a good starting point for metadata, individual dataset downloads or access to public facing REST endpoints.  .

It takes a considerable amount of effort and oversight to keep such online clearinghouses up-to-date and to this end NYCCSC is fortunate to have an ongoing relationship with NYSERDA for continued support of the project.  NYCCSC continues to welcome submissions but does not accept every resource that is submitted. At the bottom of the site landing page there is a button labeled “Propose Content” which provides access to a form in which content can be proposed.

Contact:

Ingrid H. H. Zabel, Ph.D.
Climate Change Education Manager and Curator, New York Climate Change Science Clearinghouse
Paleontological Research Institution, Affiliated with Cornell University
(607) 273-6623, ext. 122
info@nyclimatescience.org
nyclimatescience.org
Geospatial Business Spotlight: Ecology and Environment, Inc.

Company Name:                  Ecology and Environment, Inc.

Location:                               Lancaster, New York

Website:                                www.ene.com

Established:                         1970

Ecology and Environment, Inc., (E & E) is a global network of innovators and problem solvers, dedicated professionals, and industry leaders in scientific, engineering, and planning disciplines working together with our clients to develop technically sound, science-based solutions to the leading environmental challenges of our time. Founded in 1970 in Lancaster, NY, E & E also has offices in New York City and Albany, as well as locations across the national and internationally. E & E is a fully integrated environmental and engineering company delivering expertise across energy, site assessment and remediation, and restoration and resilience practice areas.

Geospatial Products and Services:

In October 2018, E & E’s IT/GIS group was rebranded as the Data Intelligence Group (DIG) to better reflect the capabilities and services of the department, and how that translates into identifying and integrating opportunities for innovation and streamlined data management into client projects. DIG includes experienced professional application developers and geospatial analysts who collaborate to add value for clients by providing tailored tools to collect and manage data efficiently, collate information quickly to meet aggressive schedules, accurately visualize project data, and support community engagement and project collaboration. E & E has worked on thousands of IT and GIS projects, and has built an extensive library of code that can be efficiently leveraged to complete successful new applications for clients quickly.

Specific E & E geospatial services include:

  • Custom Application development (public and private websites)
  • Needs Assessment, System Design, Development, Implementation and Maintenance
  • Database Development and Data Management
  • Data Visualizations (e.g., Tableau, ArcGIS Insights)
  • Field Data Collection and Management (GPS, Mobile Mapping)
  • GPS/GNSS Support
  • Mobile map viewers and custom mobile application development
  • 3D Visualization and Modeling
  • Photo Simulations
  • Software and system integration
  • Website design, hosting, and maintenance
  • Document Management
  • Satellite Image Processing
  • Database design, interpretation, and migration
  • Training and Technology transfer
  • Web-integrated Monitoring of Telemetered Data Feeds
  • Unmanned Aerial System (UAS) Site Survey
  • Augmented and Virtual Reality
  • GIS Process and Workflow Analysis
  • GIS Training
  • Desktop Geospatial Services (e.g., Cartography/Report quality mapping, Geospatial Analysis, Spatial interpolation and Modeling)
  • Process Automation

Mapping Offshore Wind for NYSERDA

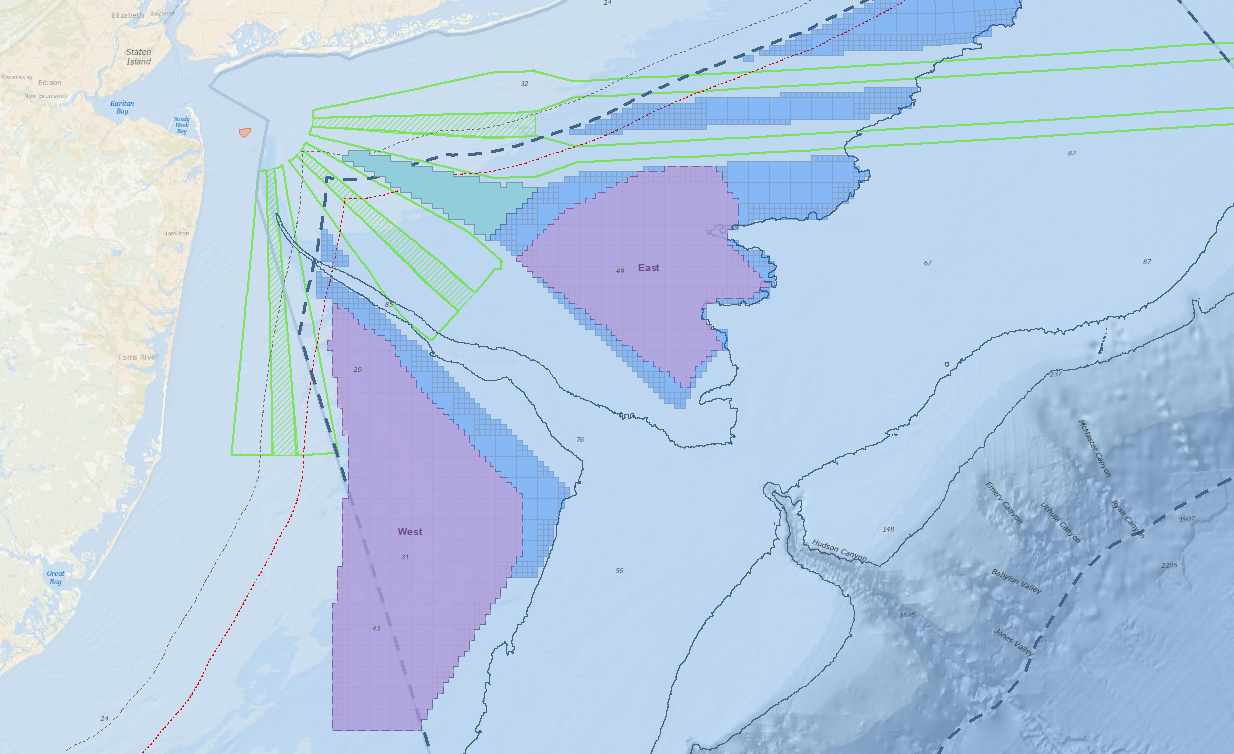
To support New York State’s commitment under the Clean Energy Standard, which requires that 50 percent of the State’s electricity come from renewable energy sources, E & E worked closely with the New York State Energy and Research Development Authority (NYSERDA) to contribute to the first-of-its-kind New York State Offshore Wind Master Plan. The plan lays out a path for development of 2.4 gigawatts of offshore wind – enough to power 1.2 million homes. Geospatial tasks associated with this project included:

  • Development of an interactive web mapping portal for team and public engagement
  • Offshore and near-shore data acquisition
  • Geostatistics of potential offshore wind development areas
  • Development of detailed map figures for published reports

Areas for consideration and indicative wind energy areas were one result of the GIS analysis performed with NYSERDA.   NYSERDA’s findings were presented to the Bureau of Ocean Energy Management to assist in designating official wind energy lease areas.

E & E also developed GIS modeling that ranked sensitivity of various offshore species receptor groups to the stressors of building and operating a wind farm over different times of the year. Geospatial data and analysis results were used to facilitate identification of areas for consideration for offshore wind development and will inform future developers, potentially reducing the uncertainty and costs of their proposals.  Download a copy of the actual Offshore Wind Master Plan.

Geospatial Services for Erie County Water Authority

E & E is proud to have worked with the Erie County Water Authority (ECWA) since 2003, helping them integrate and leverage increasingly robust geospatial technologies to benefit their customers and their bottom line. E & E’s GIS support has been critical to their day-to-day operations. E & E GIS support has provided:

  • Field crew mobile access to utility information though maps and data,
  • Analysis of water main leaks to target most-effective replacements, facilitating smart capital improvement project planning, and
  • Transportation logistical support by optimizing service calls to save on transportation and labor costs.

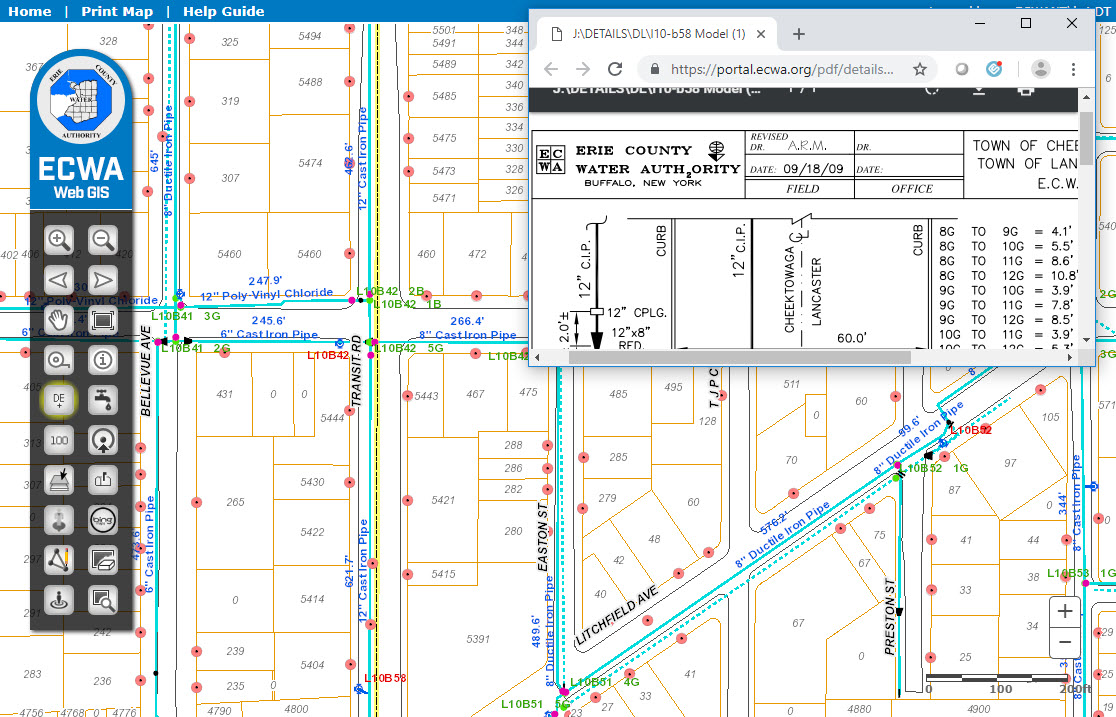
GIS has played a significant role in the location and management of assets at ECWA for the past 25 years. Pictured here is a web mapping application for use in the office, with field laptops, and mobile devices, that assists with locating and identifying assets and related information.

Geospatial Flows for Energy Infrastructure Developers

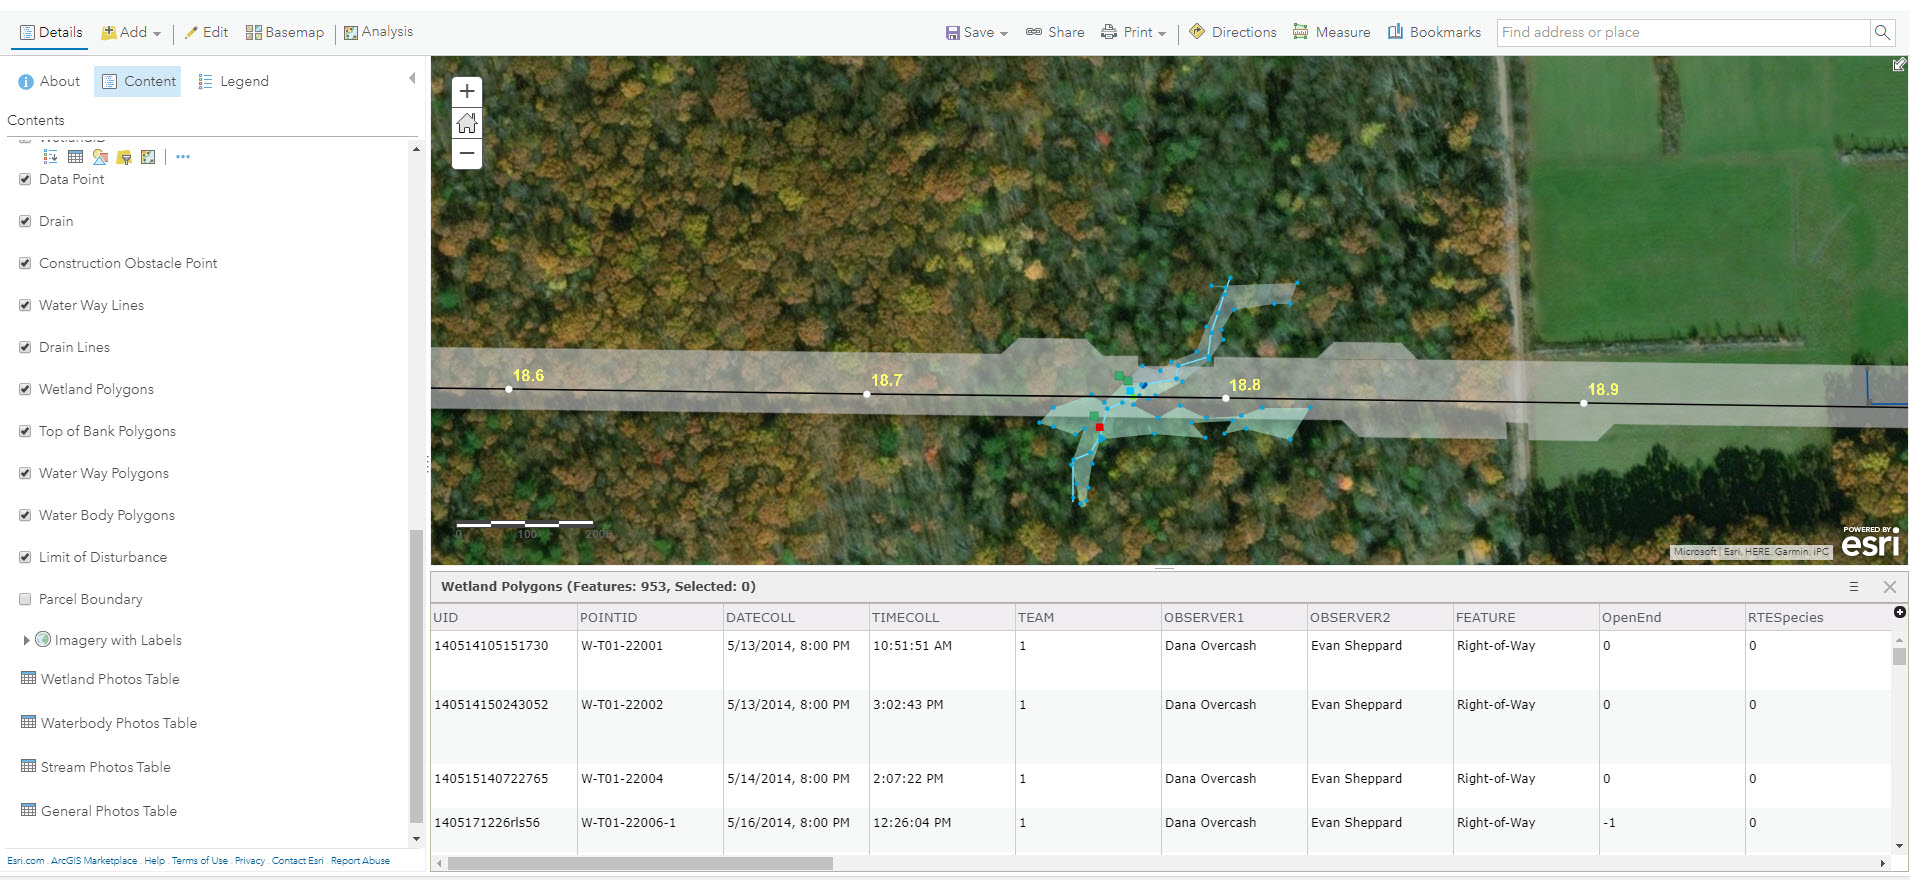
For the Williams Transco 197-mile Atlantic Sunrise project, E & E set up field data workflows for a large environmental survey. In communication with E & E biologists, developers, and the client, E & E developed a customized workflow to meet diverse needs. Solutions included development of a customized ArcPad (Trimble) and ESRI Collector Application, web integration, and desktop automation tools.

ESRI Collector and the ArcGIS Online platform played an important role in the Atlantic Sunrise field data collection process. Data was integrated in near real-time and was made immediately available to project managers, engineers, and decision makers.


Working Smarter with E-Datasheets

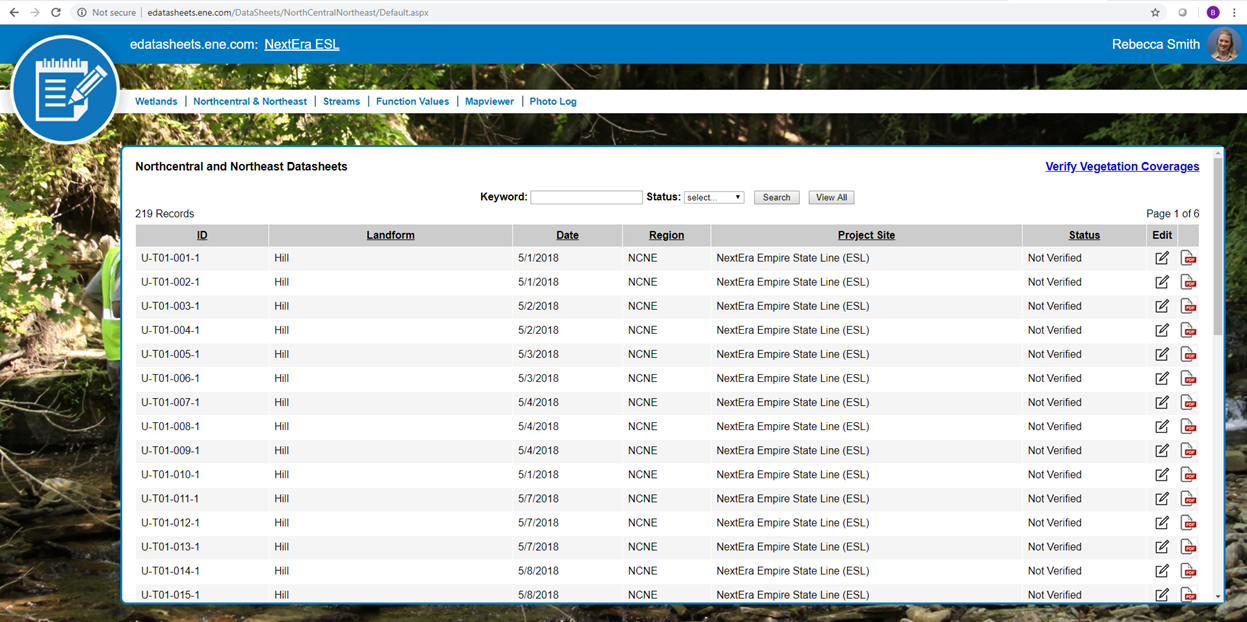
E & E has ditched paper datasheets and is going green! We developed custom “smart forms” that utilize drop-down menus, radio buttons, and behind-the-scenes calculations to speed up the data collection process. These electronic datasheets save time and improve data quality.  Data is stored in an enterprise database and can be queried and exported to PDF format for report submittal.  E-Datasheets have been used with a wide variety of clients.

E & E has developed electronic datasheets to save time, improve data quality, and reduce waste.

Contact:

Greg Coniglio, PMP, GISP
Ecology and Environment
368 Pleasant View Drive
Lancaster, New York 14086
gconiglio@ene.com