Online Application Provides Tools and Data for Communities at Risk Along the Hudson River
Background
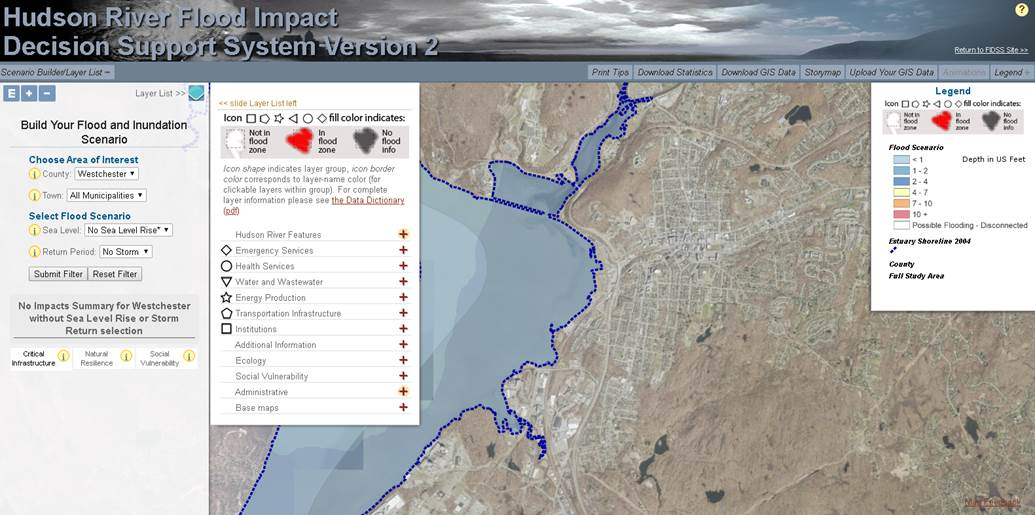
The Hudson River Flood Impact Decision Support System (HRFIDSS) is an online mapping application as well as a collection of geospatial products and data which illustrate the scale of potential flooding for tidally-affected shorelines of the Hudson River Valley and Westchester County coastal communities. In all, the viewer covers the shoreline communities in 11 counties in the region. Developed by researchers from Center for International Earth Science Information Network (CIESIN), Stevens Institute of Technology, and the Columbia Water Center, the application enables individual residents, community groups as well as municipal and regional planners to evaluate risk based on potential outcomes, and to determine the impact on and effect of social vulnerability, natural resilience, and critical infrastructure.
The tool also provides downloadable estimates of flooding impacts, including affected population and critical infrastructure, and cost estimates of building damage. It is further enhanced by including hydrological models which expands the flooding impacts to include storm tides/storm intensity and the contributions of river tributaries and streams.
The Hudson River Flood Impact Decision Support System helps address the growing interest across all levels of government in the New York region towards developing better forecasting capabilities and a better understanding of flood probabilities under a variety of sea level rise and storm frequency scenarios.
The application was developed using OpenLayers. Critical infrastructure data is housed in a relational PostGIS database which are served as a Web Feature Service (WFS) using Geoserver. Flood layers are raster data published from an ArcGIS Server at CIESIN while supporting imagery layers are consumed from New York State.
Impact Assessments
In addition to a variety of unique mapping tools, one of key features of the application is the generation of “Impact Assessments”. These are generated by application flood maps using a combination of historical and synthetic flood events which include water depth, surge, rainfall, and sea level rise scenarios of 0″, 6″, 12″, 18″, 24″, 30″, 36″, 48″, 60″, 72″ as well as 5-year through 1000-year flood zones. Flood scenarios presented in the mapping tool are accompanied by a set of impact estimates at the local level. These are divided into three themes: critical infrastructure, social vulnerability, and natural resilience features.
Continue reading