2015 NYS GIS Legislative & GAC Summertime Blues

While a good chunk of the GIS community was recently at the big group hug in San Diego at the annual ESRI UC (btw – kudos to both City of Rochester and NYC Department of Sanitation for Special Achievements in GIS (SAG) Awards),  the summer government-based geospatial landscape here in the Empire State couldn’t be any different.  Government GIS –  as in municipal, county, regional and state programs – continue to creep along.    Government GIS program administrators and project leaders, and speaking here about local government GIS projects, maintaining the same ol’ same ol’ waiting patiently for a game changing statewide GIS program/project which will magically institutionalize and expand their geospatial structure.  Though in reality, local government GIS leaders continuing to endure a statewide GIS enabling program that plods along at the pace similar to an endless loop of Brian Eno’s Music for Airports.   Sure, a conference here, a webinar there, a new skin on pieces of the ancient NYS GIS Clearinghouse – all for meaningful cause on some level –  but at the end of the day, or really the end of another legislative year, a statewide program that does not produce any specific legislation action which results in earmarked funding or enabling support o help build GIS capacity in local, county, and regional governments.   Yes, those legislative appropriations which are necessary to build and sustain geospatial at the local level.

The Governor’s January 21, 2015 State of the State talking points provided an element of short term optimism identifying several priority areas including infrastructure/transportation, economic development/tourism, Regional Economic Development Councils, and public safety, some of which are at the foundation of established geospatial applications.  Unfortunately, as has been the case in years pass, there has been limited discussion or action since the January presentation among the statewide GIS leadership on how to leverage the Governor’s priorities on behalf of the geospatial community.  The one exception of course being public safety which will continue to dictate the direction of much of the so-called statewide GIS “coordination” discussion as long as the GIS Program Office is buried deep inside of the ITS Public Safety Cluster.  Of course not to question the importance of public safety applications in the broader GIS context,  so noted and recognized, but until an independent GIS office is created – and its absolutely not going to happen in the current political climate – public safety related geospatial themes will continue to take center stage in the statewide GIS coordination discussion.

Therefore, as I have done in previous years, I took a few moments to scan the legislative search engines to see if any new legislation may have been introduced by members of the NYS Legislature during the 2015 session which would include either direct or indirect funding to support statewide GIS/geospatial program development.   For those who are interested, I came up with results almost identical to the search results twelve months ago.  One can find selected pieces of legislation containing a  “mapping” component  in the areas of Alzheimer’s research, autism, and breast cancer research.  With the 2015 Legislative session now behind us, here’s a comprehensive summary.

So what’s the point?  The point is that the NYS GIS Association has grown immensely over the past decade and is now involved in many areas of the profession across the state. As noted in previous posts, one area in which the Association is still in its infancy is in building and creating a presence in the New York State legislative arena and creating its own legislative agenda.  And the lack of any geospatial-related legislation introduced by the NYS statewide legislature over the past several years  speaks to the lack of the Association’s presence in this space.  And such “legislative” support does not necessarily have to be in just the development of earmarked funding.  For example, it could also include legislative assistance – and expanding the discussion – on helping leverage existing appropriations in agencies such as the NYS Environmental Facilities Corporation (NYSEFC) which administers both the Clean Water and Drinking Water State Evolving funds.  In early July of this year, NYSEFC issued an announcement of a $50 million dollar grant program making funding available for local drinking water and wastewater improvements.  Yes, there are many earmarks and stipulations in the NYSEFC grant, but illustratively, its potential as a funding source to expand and highlight geospatial technologies at the local level as part of rebuilding the decaying public infrastructure cannot be ignored.

The Association’s legislative presence needs to be autonomous and completely independent – particularly from the Geospatial Advisory Council (GAC) which earlier in the year, as outlined in its new, wildly fascinating organizational chart, attempted to neuter the Association to the role of providing “professional development” while meanwhile taking on the role itself as to  “advising decision makers”.   Somehow determining along the way that the expertise and composition of the GAC membership was more qualified and better positioned than the entire Association membership to interact with decision makers.  If decision makers means advising their immediate supervisors, then maybe so.  But certainly not elected officials and politicians – the place where the “advice” and well scripted dialog needs to be directed.   Money here says the day GAC members who are government employees, to say the least of a politically appointed state government GIO, start independently interacting with decision makers and politicians in any meaningful and outward/visible way will also be their last day of employment.  This is work for industry-focused professional nonprofit Associations administered by real Executive Directors.  Not government employees.

To be truly independent and representative of the statewide geospatial membership, and particularly to the local government constituency, the Association needs to come out from under the shadow and footprint of state government-heavy committees/programs and engage with legislative sponsors on its own terms. (btw – GAC perfectly illustrated the Association’s need to flee the so-called new coordination framework in the new organizational chart of GIS coordination in NY State – with the dominant shaded state government rectangular box at the top of the chart.)   My guess is that the GAC leadership didn’t use a Hillary Clinton-type advance focus group test to see if anyone in the statewide GIS community really understood the chart  or for that matter what GAC is really supposed to do. Though some blame should be placed the Association leadership for even letting GAC publish the new organizational chart showing it (the Association) in some subservient capacity to the self-declared state government triumvirate and GAC, if even only in context of an advisory role.

The Association should also stop serving as a mule in providing GAC with an annual candidate list of potential members whose mere presence at the table implies endorsement of GAC’s activities.  Remove itself, along with local government individuals, from the quarterly parade to Albany to listen to state government departmental GIS applications, work plans, and projects and priorities of state government programs. While the dialog at GAC may be useful and productive in context of state government program updates and activities, its mostly for the benefit of the choir of state employees at the meeting and those making the presentations themselves.    Take a look at the minutes from the June 2015 GAC meeting and digest all of the riveting conversation concerning the needs and future activities of non-state sectors of GAC i.e., utilities, academia, nonprofits, and of course local government, and decide for yourself.  But maybe it was because it was a “state” sector designated meeting?  And other sectors will get their chance at future GAC quarterly meetings to dominate the conversation?  Yeah, probably.  Exactly why I formed the Association over a decade ago – to help lead the discussion and focus of statewide GIS development in a different direction and away from established Albany-centric GIS programs and personalities.  And the business sector?  BUSINESS.  Fugetaboutit.  Probably the most important factor which is going to shape the NYS geospatial landscape in the next decade doesn’t even really participate in the discussion.  And yes, there is a reason why business doesn’t run in the GAC circle.   And ironically, the only place the geospatial business community is going to participate and contribute is within the Association structure.

It’s time for the Association’s leadership to recognize and embrace the potential, and for that matter, its obligation, towards building an independent legislative agenda and professional appearance on the New York State political stage.  Operating and orchestrating on its own.  Working with other appropriate industry groups and committees where input and collaboration is requested and warranted as needed, but beholden to none and/or other hidden agendas.  The Association must establish itself to set the agenda of  statewide geospatial priorities. Not GAC and most definitely not state government employees or agencies.

That time for action is now, or the hopes of a meaningful 2016 geospatial legislation report reflecting the growth and expansion of the GIS profession will be a carbon copy of 2015.  And the beat will go on and on and on.   Just like Music for Airports.

The Blue Highways of GIS: Brooklyn, New York

Among the brownstones and sycamore trees on Carroll Street in Brooklyn, New York is the office of HabitatMap.  Founded in 2007, HabitatMap is an established metro-New York City non-profit environmental health justice organization whose goal is to raise awareness about the impact the environment has on human health.

HabitatMap was created as a nonprofit by activists focusing on the impact of hazardous facilities and sites on the well-being of residents in areas adjacent Newtown Creek in Brooklyn.    Today, HabitatMap’s products and services, including online mapping and social networking platforms, provide a framework for hundreds of community groups across the country to maximize the impact of community voices on government and industry, as well as strengthening ties between organizations and activists. The Founder and Executive Director of HabitatMap is Michael Heimbinder.

Utilizing Habitat’s shared advocacy and mapping platform individual and organizations can:

  • Alert the public to environmental health hazards
  • Hold polluters accountable for their environmental impacts
  • Highlight urban infrastructures that promote healthy living
  • Identify future opportunities for sustainable urban development
  • Promote policies that enhance equitable access to urban resources

Just a small sample of community-based organizations in the metropolitan area which use HabitatMap includes the Upper West Side Streets Renaissance Organization of Waterfront Neighborhoods,  Sustainable South BronxNeighbors Allied for Good Growth,   Brooklyn Compost Collective, the Bronx River Alliance, and the United Puerto Rican Organization of Sunset Park.   The HabitatMap website is accessed and used worldwide.

Similar to other smaller organizations with limited infrastructure and technical staff, HabitatMap integrates Google Maps to support it’s map viewer as well as a customized toolkit to edit and add “markers”.  Google products are also used as a means to publish content from their AirCasting platform.

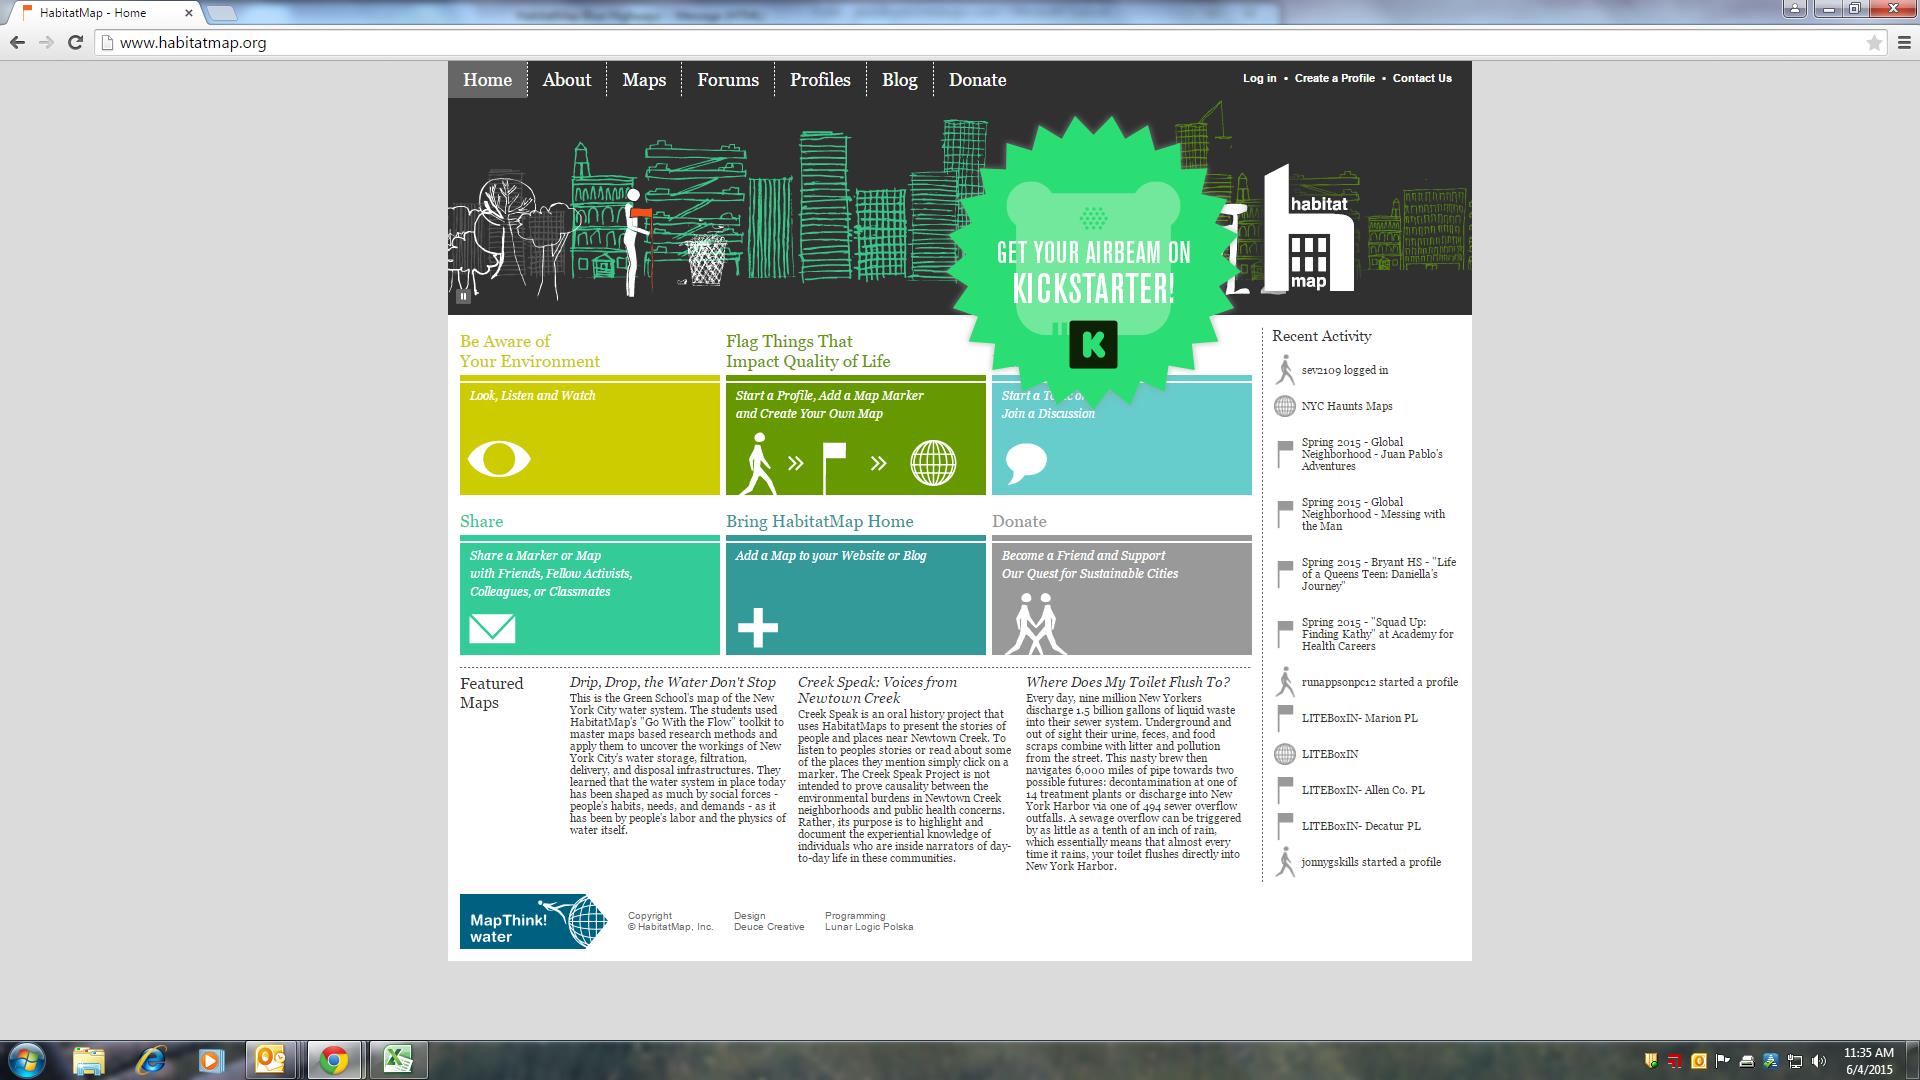
The HabitatMap homepage at http://www.habitatmap.org

The HabitatMap homepage at http://www.habitatmap.org

HabitatMap Interactive Website

Once a personal profile is created, participants can start making maps on HabitatMap.org, mapping (aka “Add a Marker“) items of interest either by geocoding or clicking on a specific location on the map viewer  – which is based on Google Maps.  For example, I quickly created an account and mapped the location of a community facility in my hometown which is in need of minor repairs and perhaps retrofitted to provide space for community groups in a section of our town with limited such facilities.  As tags are associated with each marker location,  users can search the HabitatMap database for specific projects or areas of interest by using keywords such as water quality, recycling, fracking, community gardens, or greenways.  Keyword matches are then rendered on the viewing screen.

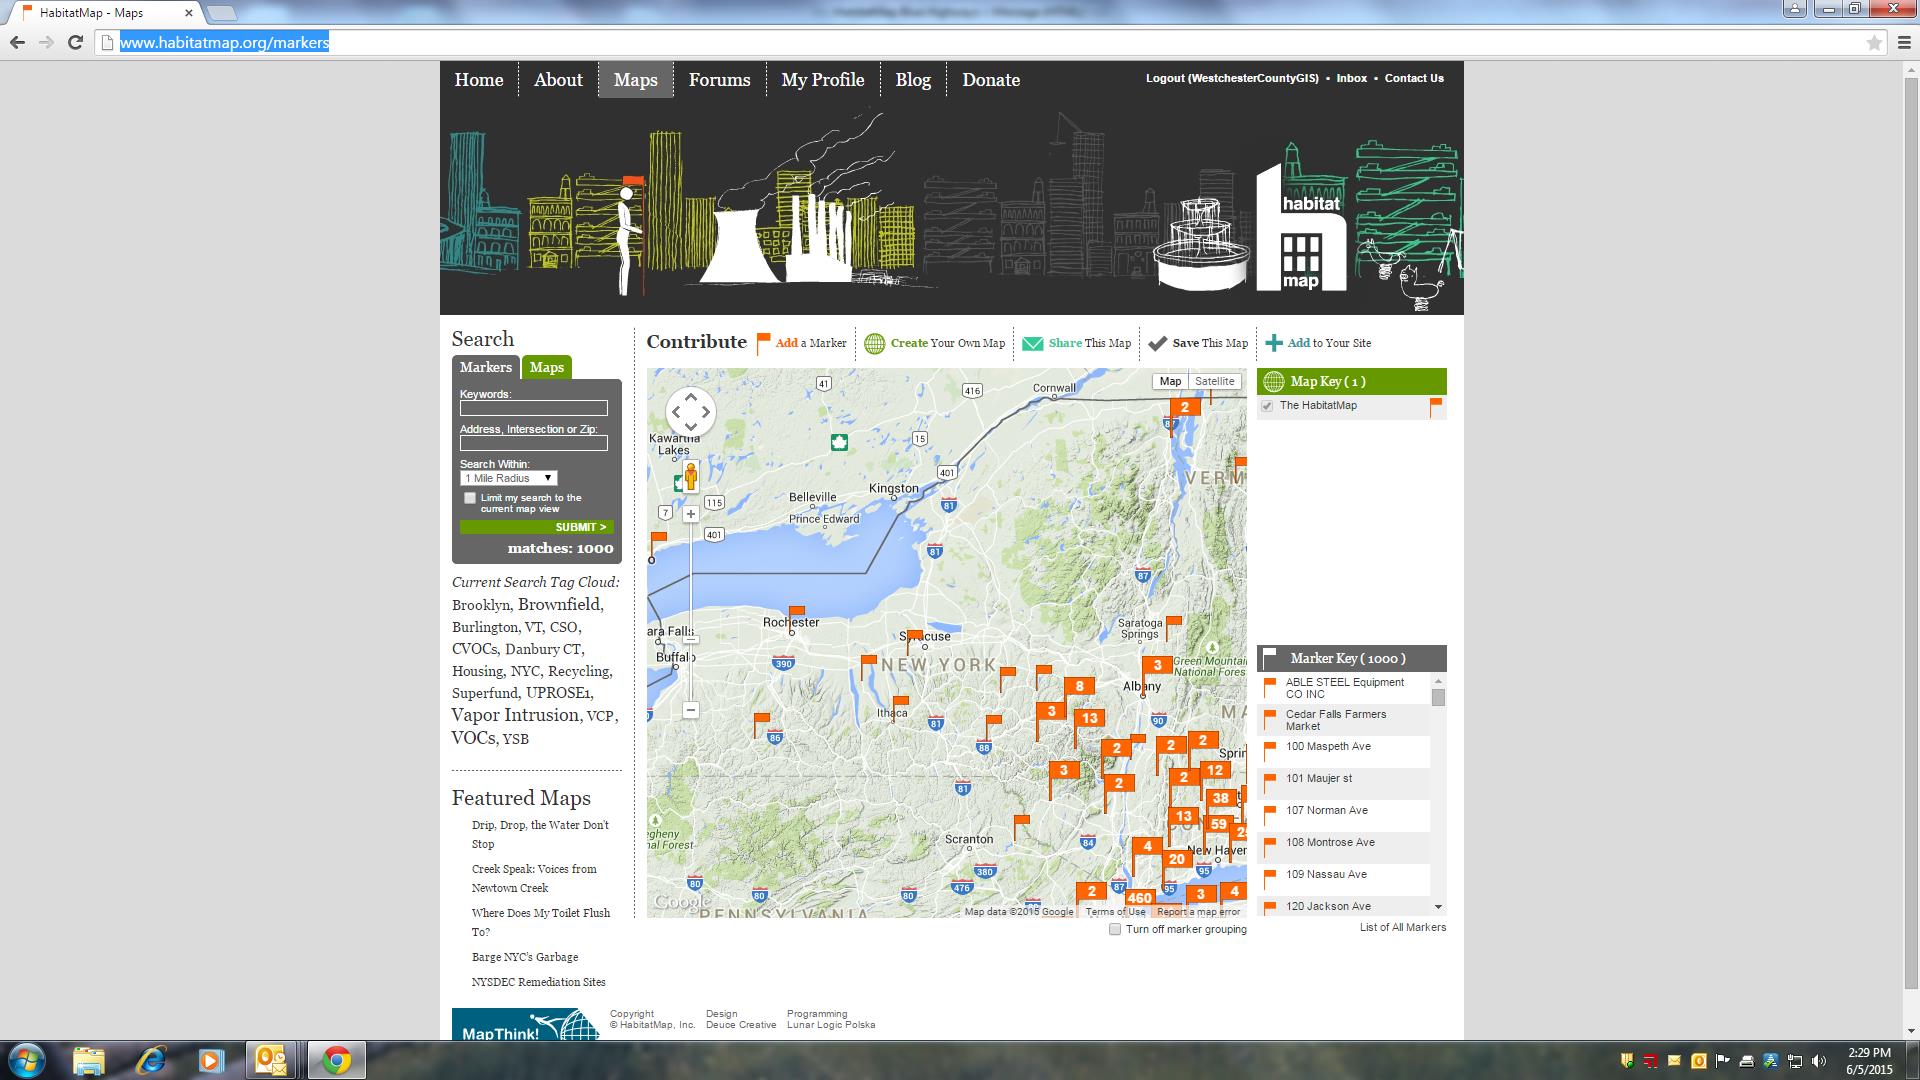
Community groups and individuals across New York State, particularl in the NYC metropolitan region, contribute to the HabitatMap by adding “markers” to identify a wide range of community-based issues and projects.

Community groups and individuals across New York State, particularly in the NYC metropolitan region, contribute to the HabitatMap by adding “markers” to identify a wide range of community-based issues and projects.

The Forums tab enables registered participants to start a discussion among other like-minded HabitatMap participants in categories such as Community Health, Water & Air Quality, Energy, Transportation, and Mapping.  Participants click on the forum category that best matches their intended topic of conversation and click “Post New Topic”.  The Blog tab is largely dedicated to the HabitatMap funded and developed Airbeam monitor which measures fine particulate matter (PM2.5), temperature, and relative humidity   Being used by community groups and activists across the country, the AirBeam connects to the AirCasting smartphone app via Bluetooth to map, graph, and crowdsource exposure to fine particulate matter in real time.

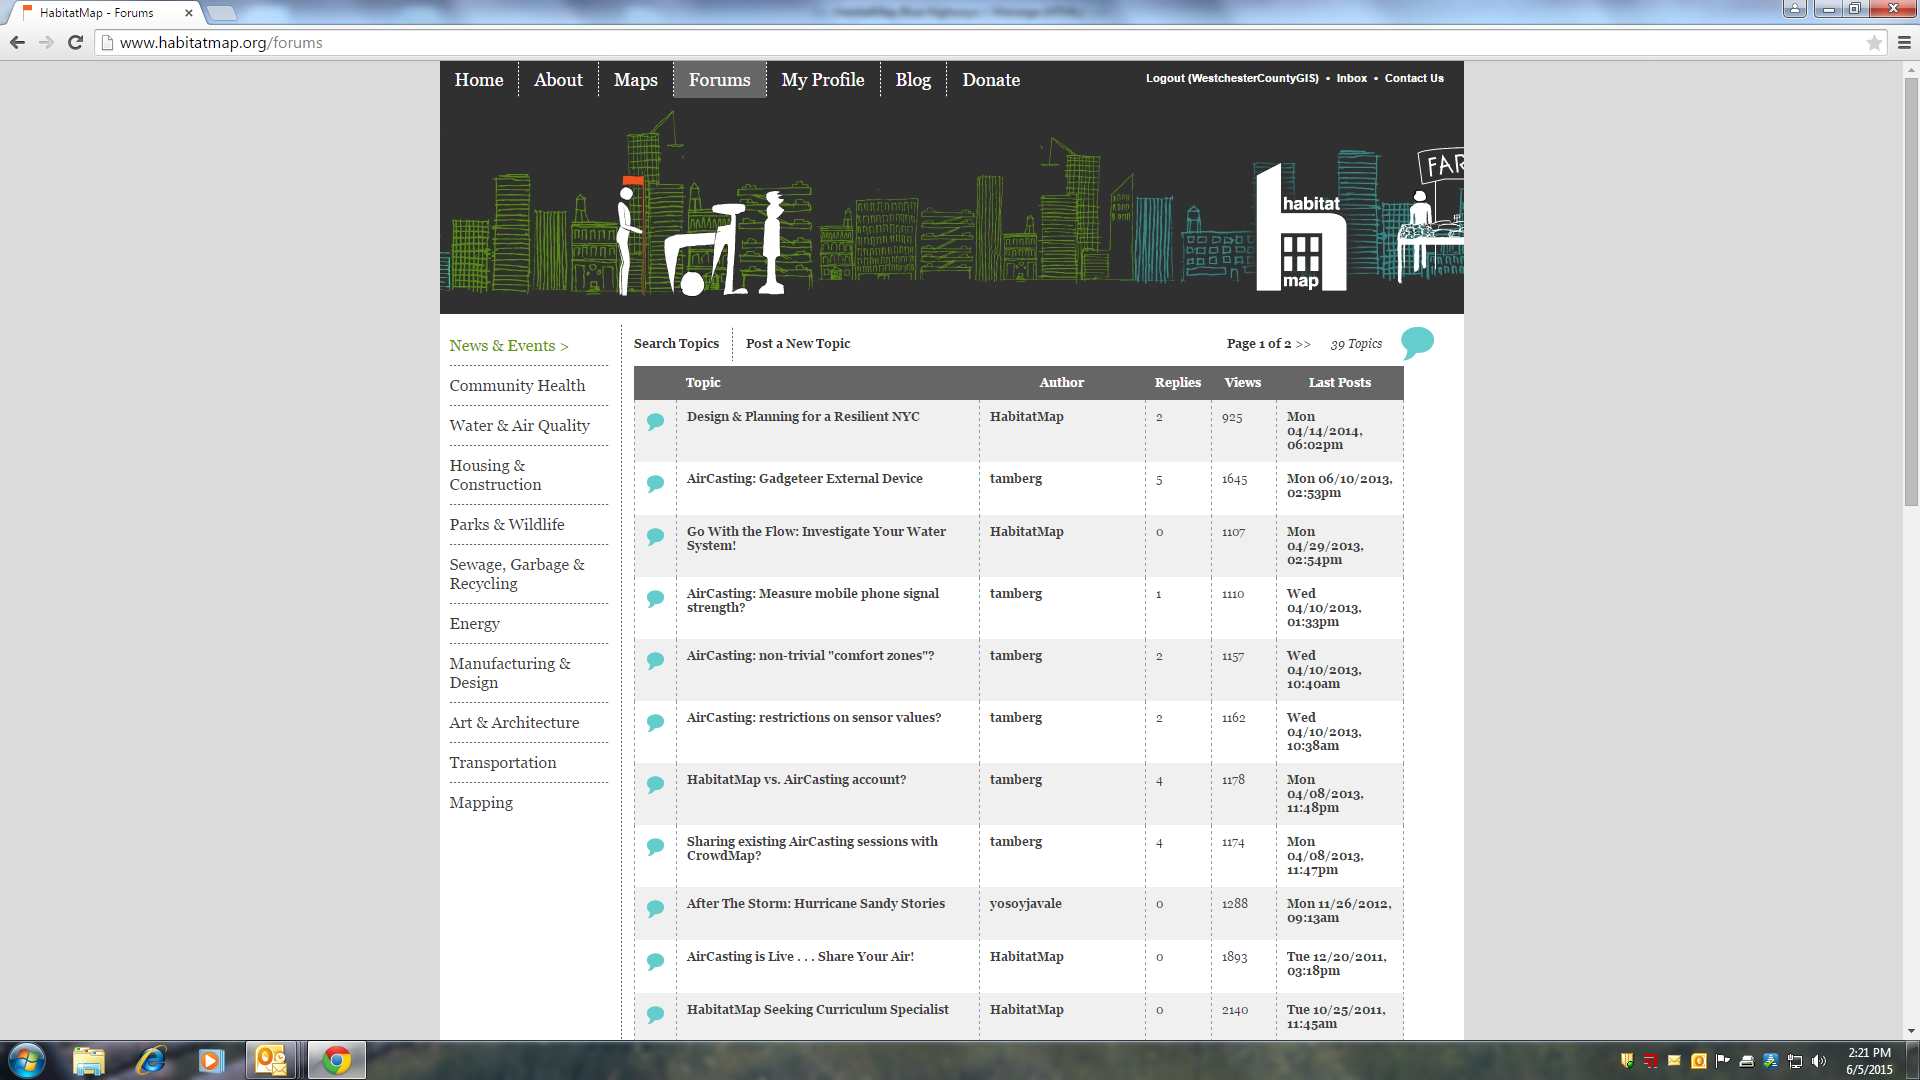
The Forums page enables participants to contribute and engage in dialog with others in topical areas such as Community Health, Mapping, Water and Air Quality, and much more.

The Forums page enables participants to contribute and engage in dialog with others in topical areas such as Community Health, Mapping, Water and Air Quality, and much more.

An excellent example of HabitatMap’s primary online mapping product can be seen as part of the Creek Speak map which provides access to stories of people and places near Newtown Creek. In addition to mapping the locations of local issues and events, the HabitatMap interactive map enables users to also include and associate URLs, graphics, and similar files with each mapped location.  Similar to other community organizations which partner with HabitatMap, the   Creek Speak Project map’s purpose is to highlight and document the knowledge of individuals who are “inside narrators” of day-to-day life in the Newtown Creek community.

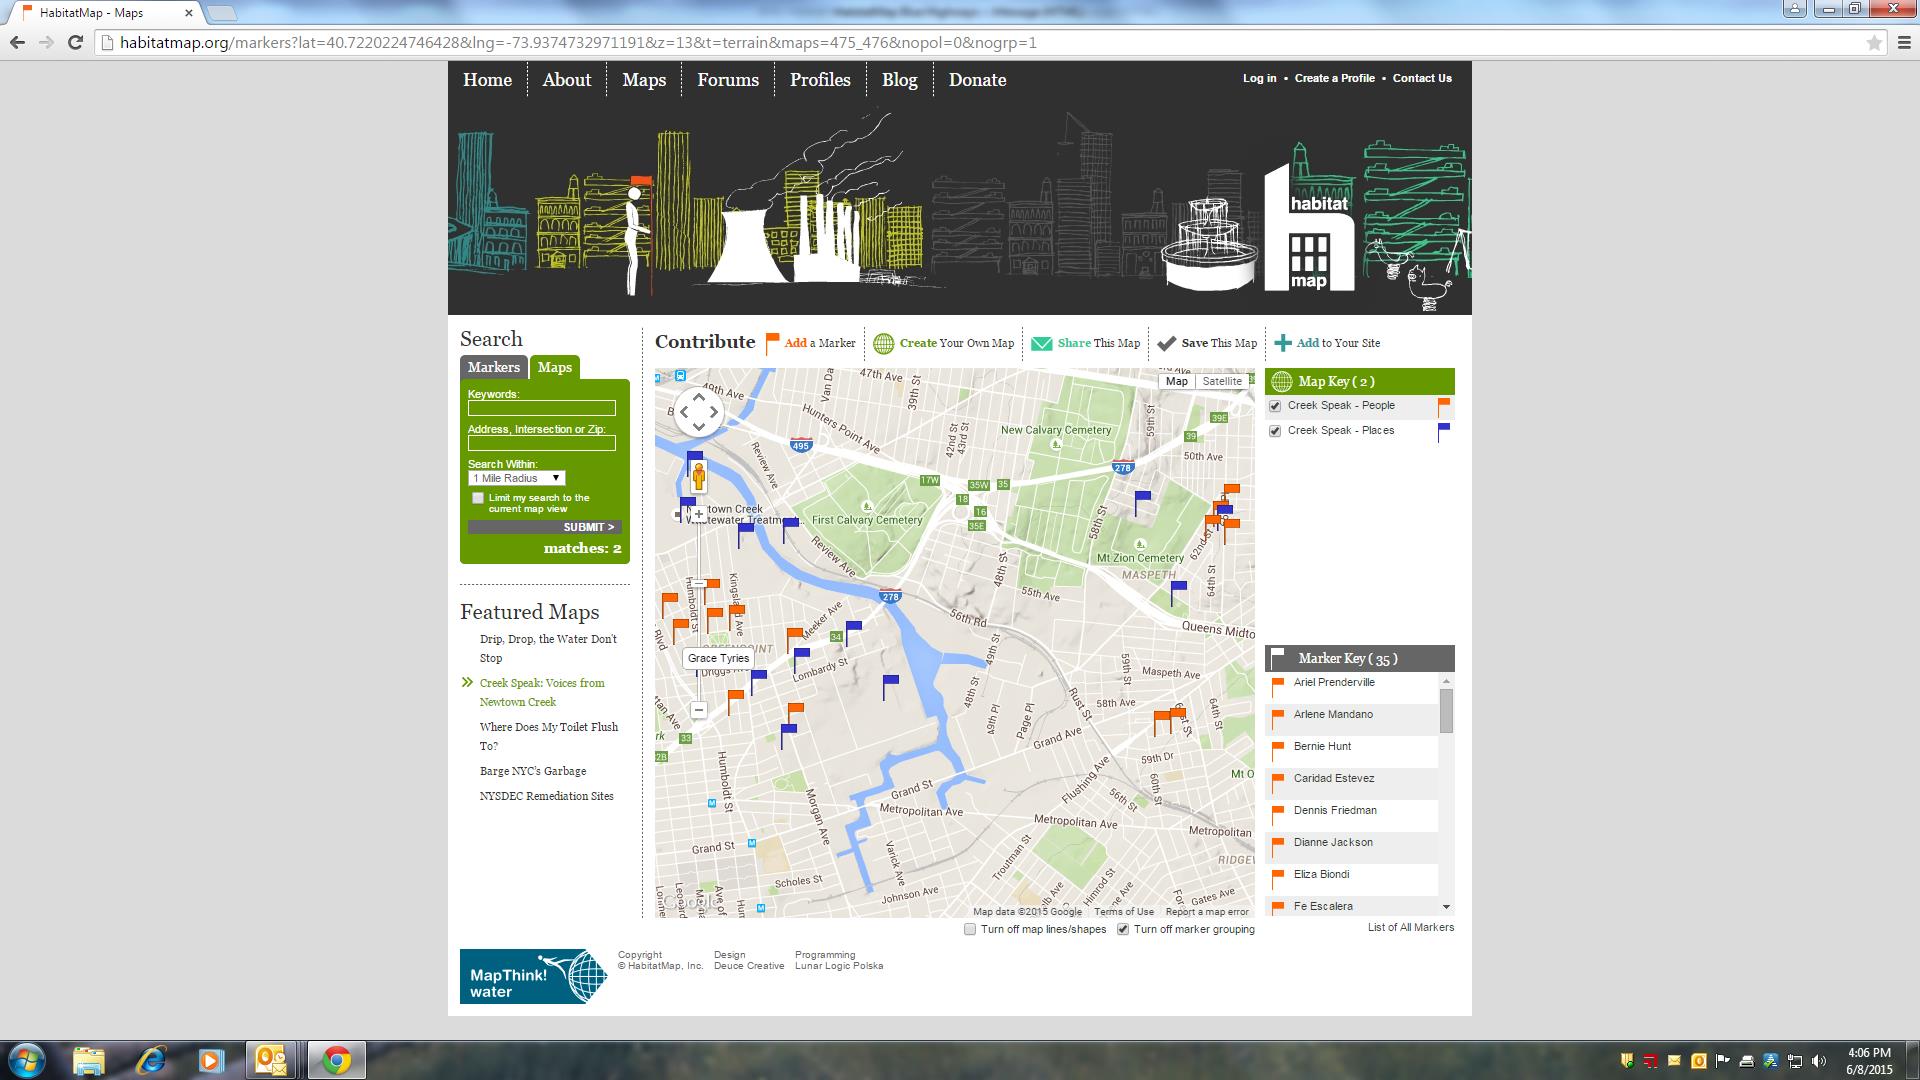
Founded in the Newtown Creek areas of Brooklyn, New York, there have been many contributions to the online HabitatMap from individuals and organizations located nearby.

Founded in the Newtown Creek areas of Brooklyn, New York, there have been many contributions to the online HabitatMap from individuals and organizations located nearby.

.Other groups use the HabitatMap interactive map to identify locations in their community that either enhances the quality of life such as parks, scenic vistas, farmers markets, civic programs, or public parks, or those might  cause for concern, such as a graffiti, unsafe properties, traffic/pedestrian issues, or illegal dumping or discharges.  Users can also create individual maps highlighting a specific area of interest, embed maps on a personal or agency website or blog, invite fellow activists to contribute to maps, and discuss issues and recruit collaborators in the online forums.

Mapping & Educational Programs

One area which best exemplifies HabitatMap’s use of mapping is through its educational outreach programs.  Central to this effort is  MapThink, an educational toolkit series developed by HabitatMap which introduces maps-based research methods to high school students and community based organizations so that they can become active participants in their community and advocate.  The MapThink Toolkit series focuses on creating planning and advocacy maps using their online tools: HabitatMap.org and AirCasting.org.

Illustrative projects in this regard include youth program workshops in Brooklyn and San Francisco during 2014.  In San Francisco, HabitatMap worked with 60 seniors from the Galileo Academy of Science & Technology, a public high school that provides students with career pathways in biotechnology, environmental science, health, hospitality and tourism, computer science, and creative media technology.  In Brooklyn, HabitatMap worked with UPROSE which is a grass roots, multi-ethnic, intergenerational community-based organization dedicated to environmental and social justice. UPROSE Youth Justice members were introduced to the AirCasting product which was used to map the air quality problems in their neighborhoods, which is host to multiple power plants and waste transfer stations, dozens of auto shops, and bisected by the Gowanus Expressway.

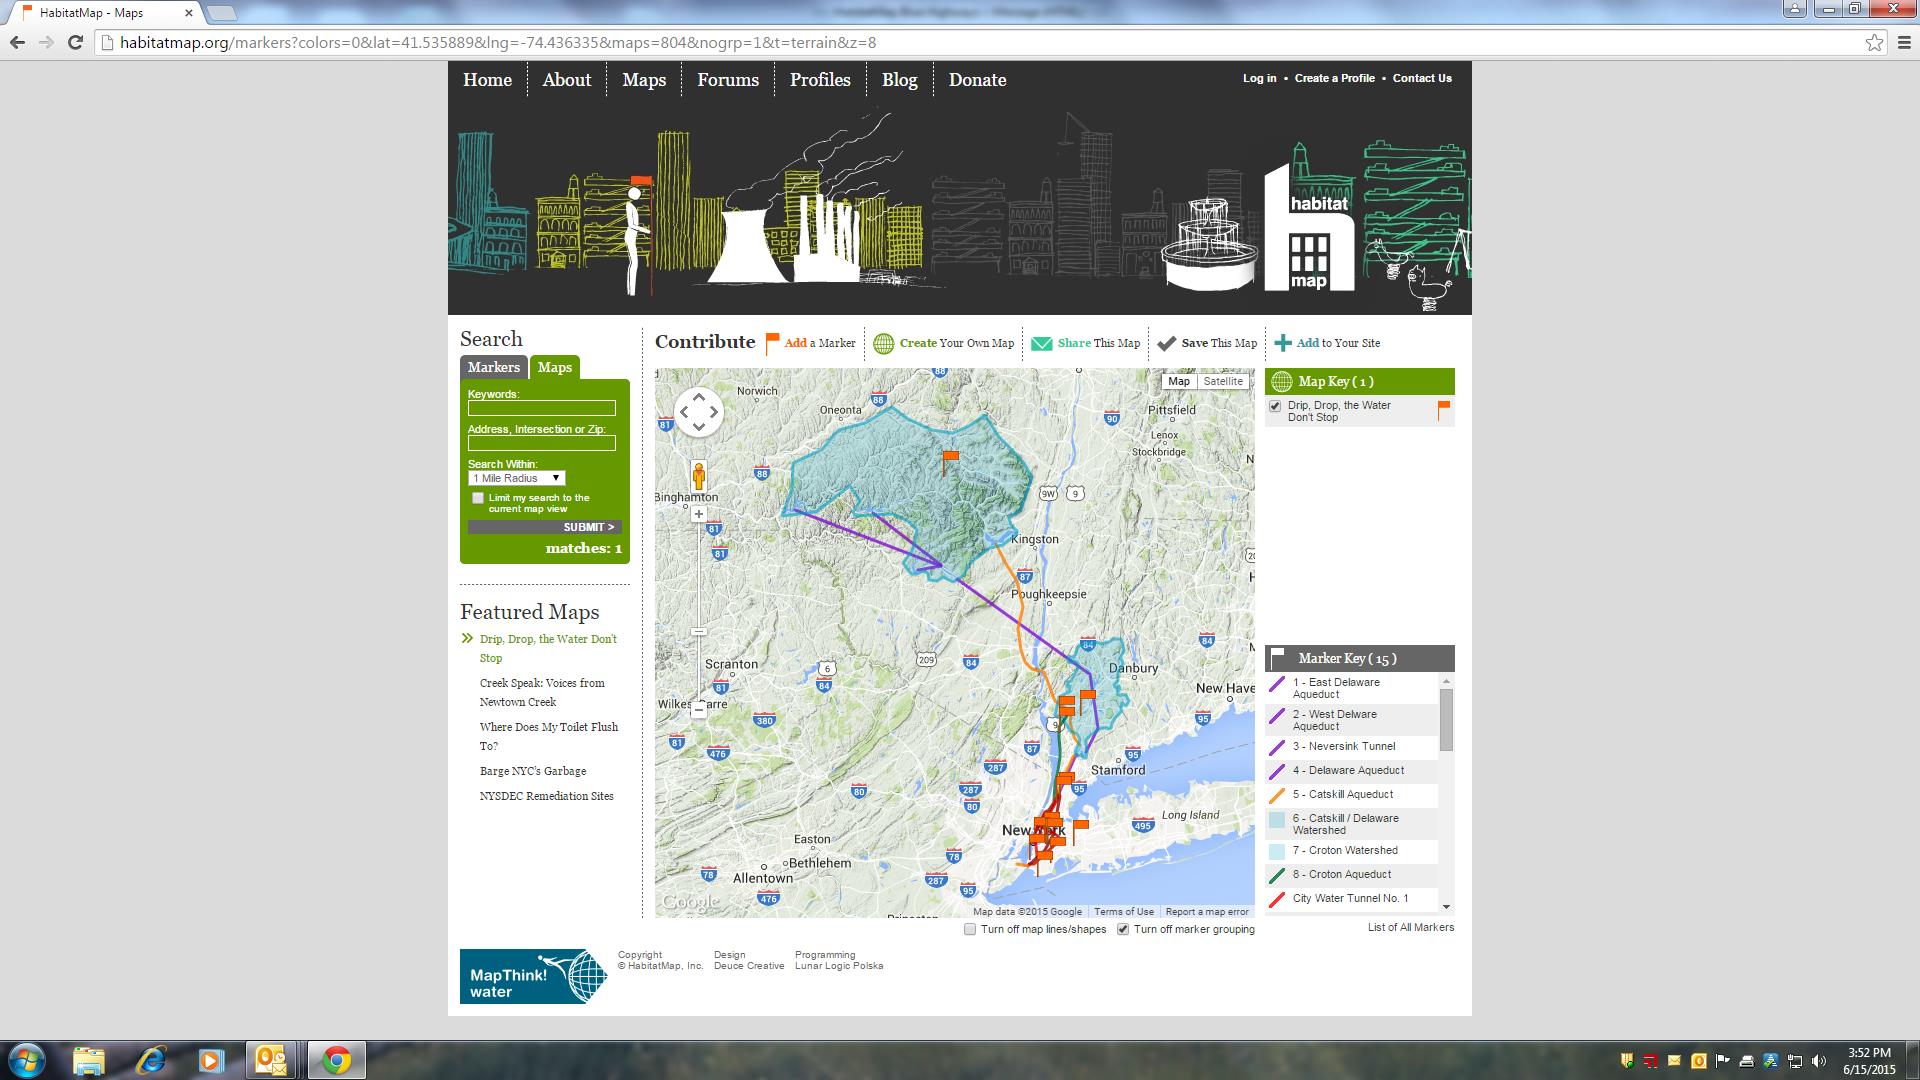
Another HabitatMap mapping effort was conducted by the students at the Green School in East Williamsburg Brooklyn.   Their project, entitled “Drip, Drop, the Water Don’t Stop”, focused on the New York City water distribution system.  Using Habitat’s online mapping and the “Go With the Flow” toolkit, students developed maps based on research of the NYC water storage, filtration, delivery, and disposal infrastructures.  You can learn more by clicking through the project map, looking at photos, and reading student learning reflections.

The Green School’s research project of the New York City drinking water system as rendered on the HabitatMap interactive map.

The Green School’s research project of the New York City drinking water system as rendered on the HabitatMap interactive map.

This summer, HabitatMap is working with the North Brooklyn Boat Club and the New England Interstate Water Pollution Control Commission mapping and collecting water samples in Newtown Creek with the new HabitatMap WaterSense monitor, which measures dissolved oxygen, conductivity, and temperature.  The instrument connects to the AirCasting app via Bluetooth to record, map, and graph the data in real time.  Made possible through funding from the Lily Auchincloss Foundation, the project was initiated to address water quality concerns in Newtown Creek, a Federal Superfund site that is inundated by over a billion gallons of raw sewage annually, the result of combined sewer overflows.

HabitatMap:  Looking Forward

While boasting a diverse collection of partners and collaborators including Google Earth Outreach, New York Community Trust, Mozilla Hive NYC, Environmental Protection Agency (EPA), Carnegie Mellon CREATE lab, and the New York State Pollution Prevention Institute, among others, the likes of NYS Dept. of Environmental Conservation, Michael Heimbinde remains the only full-time staff at HabitatMap and envision’s a bright future for the nonprofit.  He notes:

“We’re excited to continue growing the AirCasting community. Our ambitions for AirCasting, and it’s true potential, lie in 1) creating ultra-dense networks of AirCasters that network together multiple schools and community based organizations in a single neighborhood and 2) scaling nationally and internationally. HabitatMap, in partnership with Sonoma Technology, NYU School of Medicine, NYU Wagner, and the Newtown Creek Alliance have crafted a proposal for a community based participatory research project that would enable us to create an ultra-dense network of AirCasters in Greenpoint, Brooklyn, bring together the technical experts needed to address improving air quality in a neighborhood overburdened with pollution sources, and establish a model for expanding nationally and internationally.”

Tim Dye, Senior VP at Sonoma Technology, adds, “Our collaboration with Michael Heimbinder and HabitatMap on the development of the AirBeam sensor has been very rewarding. Together, we launched the Kids Making Sense program, which combines education and technology to empower students to drive positive change in their communities, in the U.S. and abroad.”

One community group and one map at a time.  Communicating community geospatial data that matters from Brooklyn, New York.  HabitatMap.

Along the Blue Highways of GIS.

Thanks for reading and see you down the road.


Geospatial Business Spotlight: Mapzen

Company Name:                Mapzen

Website:                              https://mapzen.com/

Established:                        2013

The Company

Mapzen is currently under the leadership of longtime colleagues Randy Meech and Brett Camper.

Together they come with years of experience in mapping and product development. Previously, Meech was Chief Technology Officer of Mapquest and Camper was Director of Product and Engineering at Kickstarter.  Mapzen consists of a professional staff that includes software engineers, product managers and mobile application engineers located at the offices in New York , San Francisco, Berlin, and several remote sites.

Mapzen was created on a shared vision to establish an open, accessible, and resilient mapping ecosystem.  Today this vision is being implemented and facilitated through the Samsung Accelerator  which provides the financial framework and stability.   Mapzen supports the geospatial community through building tools and promoting open source map technologies which follow a long tradition of community-powered cartography.

Geospatial Products and Services

Mapzen products and services are focused in four core areas:

  • Search (geocoding)
  • Graphics
  • Navigation
  • Open Data

Mapzen staff and developers leverage GitHub extensively as an environment to communicate technical issues with colleagues on projects.  It provides access control and several collaboration features, such as a wikis, email threads, and basic task management tools for every project.

Illustrative examples of Mapzen projects include:

Tangram

Tangram is a map renderer designed to grant significant levels of control over map design. By drawing vector tiles live in a web browser, it allows real-time map design, display, and interactivity.  Using WebGL, Tangram leverages the graphics card to a new level of cartographic exploration. Animated shaders, 3D buildings, and dynamic filtering can be combined to produce effects normally seen only in science fiction.

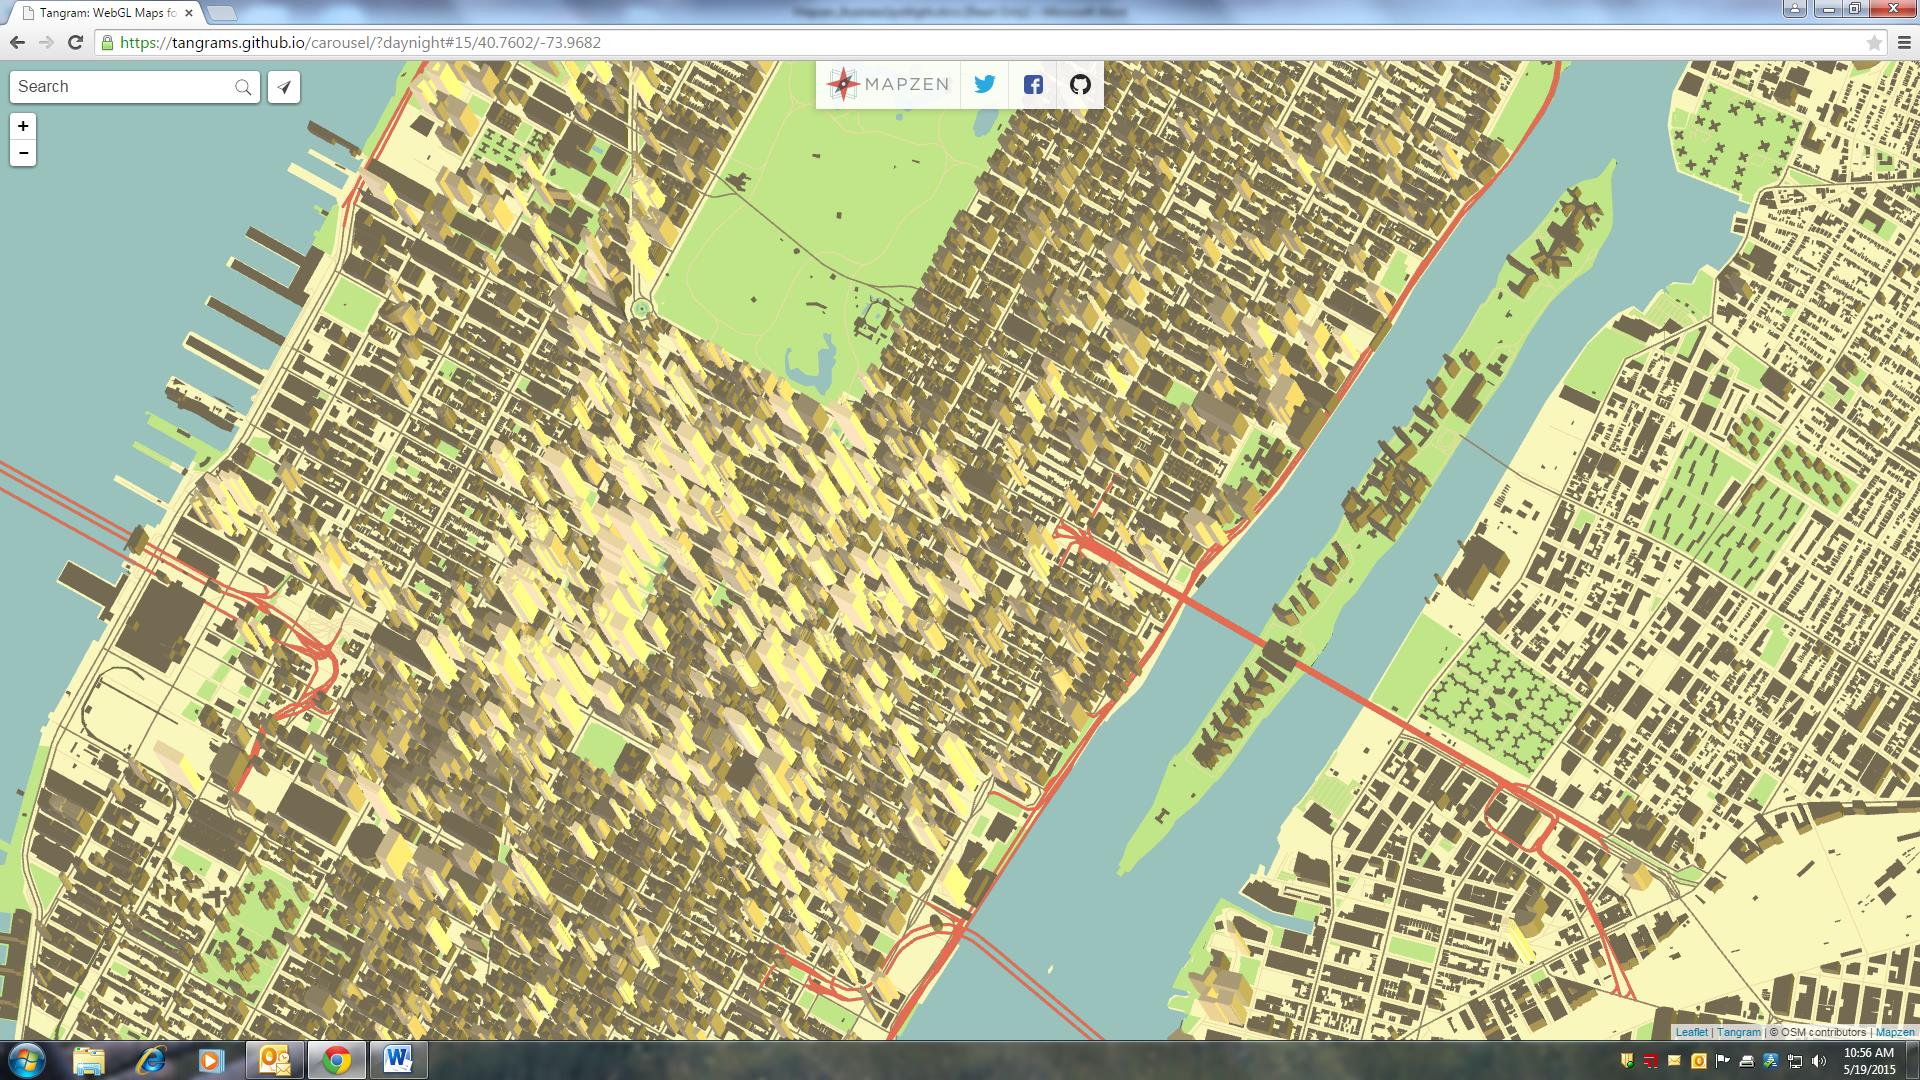
Day/Night

Tangram draws maps live in a browser enabling developers to update styling properties in real-time, instantly. But changing the color is just the beginning – as every Tangram map is a 3D scene, you also have control over lights and cameras.

In this view just south of Central Park in Manhattan,  an isometric camera’s perspective is varied along with the color and direction of a light (morning), resulting in a time-lapse drone’s-eye view.

In this view just south of Central Park in Manhattan, an isometric camera’s perspective is varied along with the color and direction of a light (morning), resulting in a time-lapse drone’s-eye view.

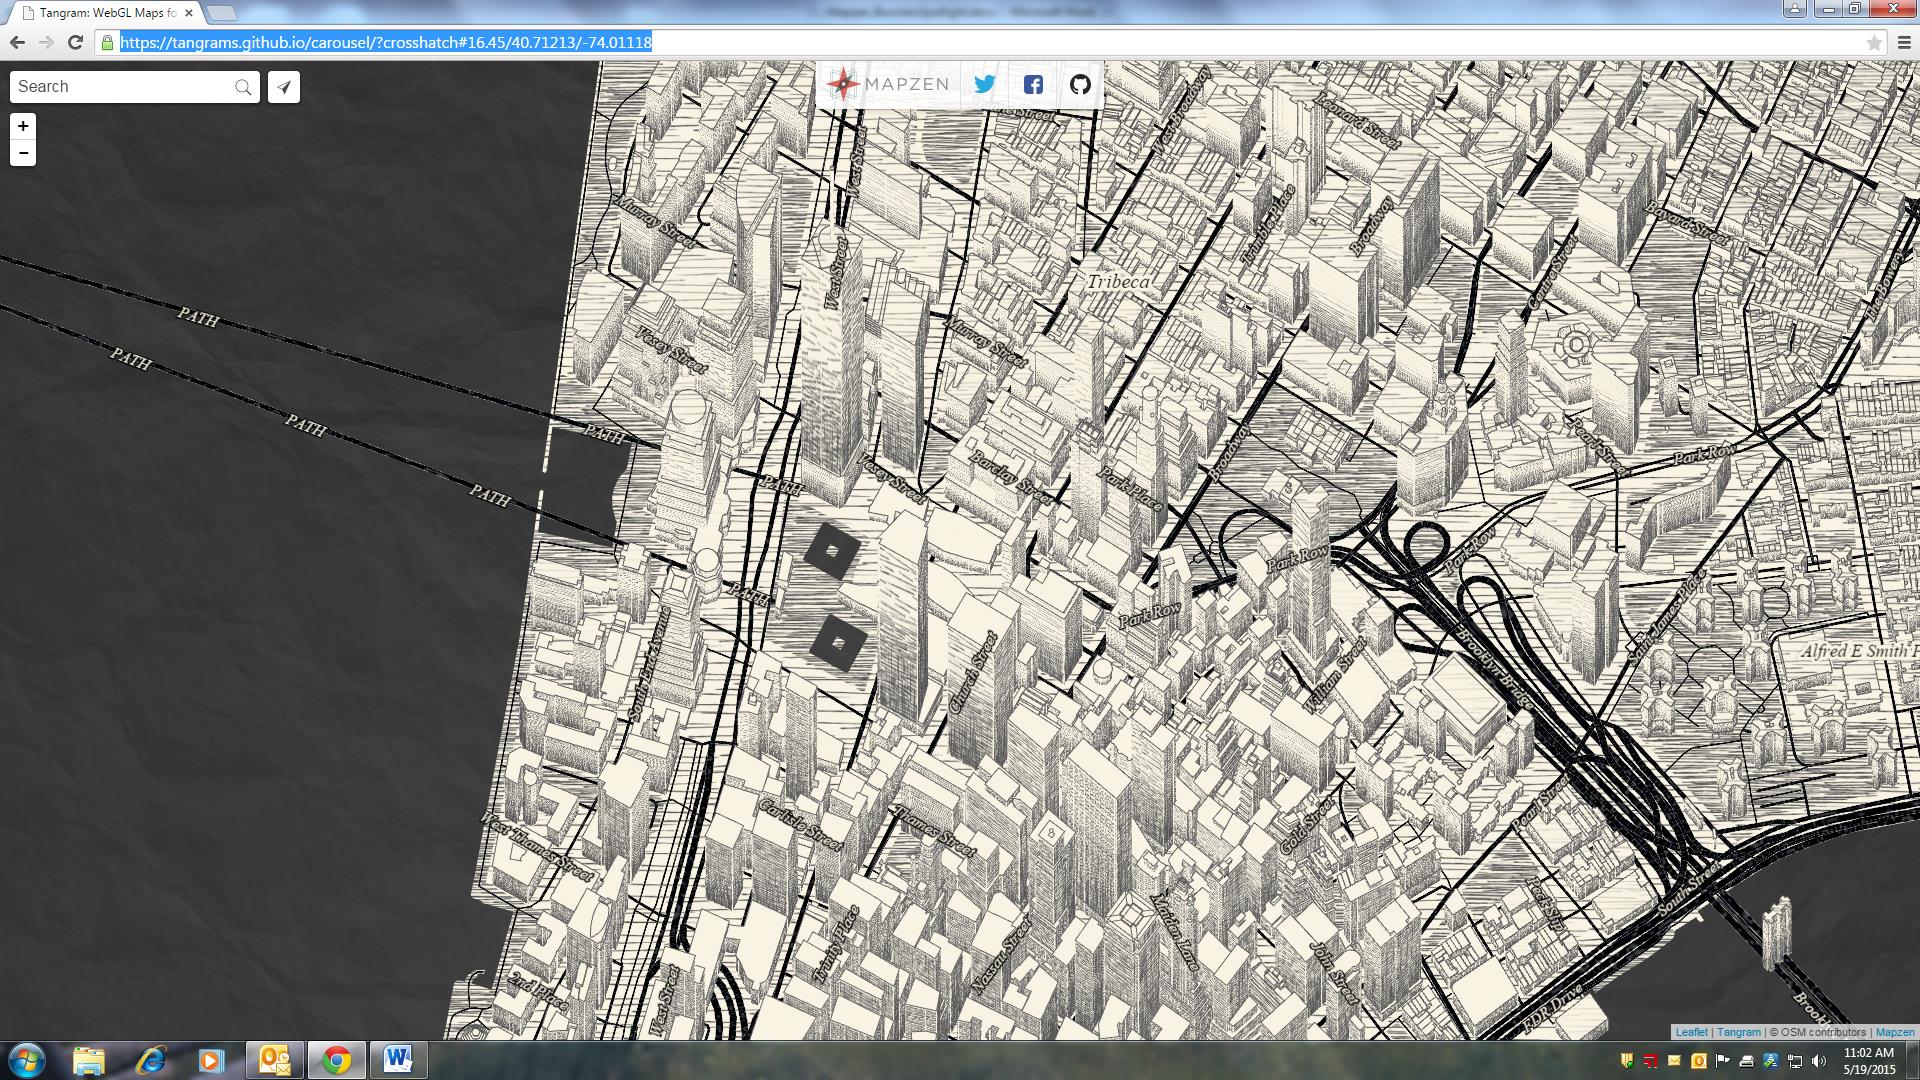
Crosshatch

Using Tangram’s plain-text markup language, developers can write graphics card programs (called “shaders”) and even JavaScript to add interactivity, mix data sources, and control the design of maps.

This example of lower Manhattan uses a shader to color geometry with hand-drawn textures, blending between them based on the color, angle, and amount of light on each face.

This example of lower Manhattan uses a shader to color geometry with hand-drawn textures, blending between them based on the color, angle, and amount of light on each face.

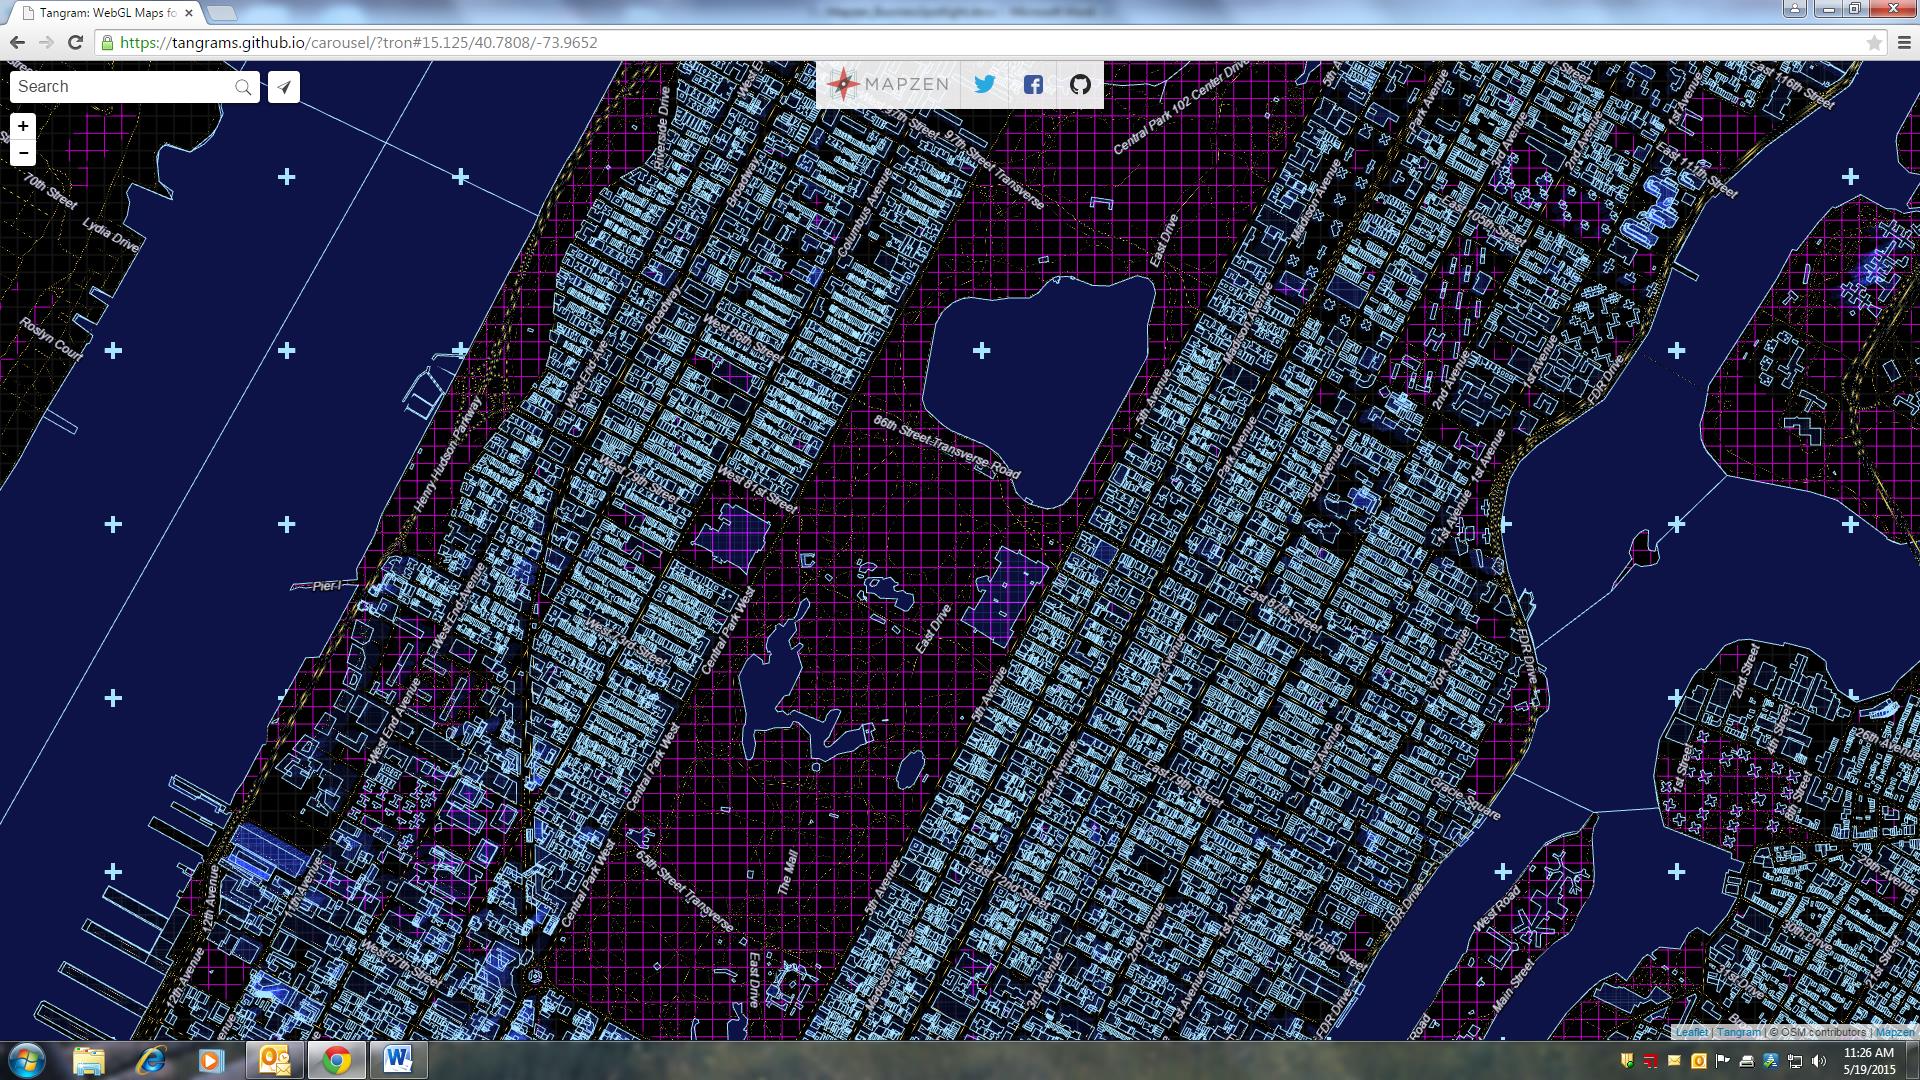
Tron

Tron uses procedural shaders to create a view of the future.  The shaders, defined by mathematical functions, are applied to various data layers with UV maps, just like texturing an object in a 3D application like Blender.

TangramTron

Other current Mapzen projects include:

  • Vector Tile Service: a free vector and super fast OSM base layer
  • Pelias: a modular open-source geocoder
  • Open by Mapzen: a proof of totally open source and open data app
  • Valhalla: a unique routing engine based entirely on open data
  • transitland: a community edited aggregation of transit feeds

Find out more about Mapzen’s data products, employee blog postings, and additional information for developers on their website.

Contact

Alyssa Wright, VP, Partnerships and Business Development, President of OpenSteetMap US, and co-organizer of the GeoNYC Meetup group.

The Federal Geospatial Data Act of 2015: A NYS Local Perspective

There has been a limited amount of fanfare and support – or even discussion for that matter – here in the Empire State on the proposed Geospatial Data Act of 2015.    Beyond one or two acknowledgements on  the state listservs, the announcement really didn’t generate any buzz or visible discussion throughout the GIS community.   Though it comes as no real surprise as few in New York statewide GIS community have had any meaningful exposure or introduction to past legislation/bills regarding federal agencies referenced in the proposed 2015 act introduced by Senator Orrin Hatch of Utah.  In absence of any real meaningful dialog here in the New York  between the GIS professional community and elected officials on federal legislation (or any geospatial legislation for that matter except perhaps the never-ending “Surveyor” Legislation), one wonders if New York’s federal delegation is even aware of the proposed act.  Or its stated benefits.

At the core of the proposed 2015 Act is a combination federal legislation and policies including (in no particular order of importance) OMB Circular A-16, the National Spatial Data Infrastructure (NSDI), and the Federal Geographic Data Committee (FGDC).   Very government-like and uber confusing, a little background includes: In 1994, Executive Order 12906 was issued by President Clinton to direct the development of the NSDI.  Unfortunately, twenty-one years later,  many of the requirements of EO 12906 have never been acted on.  Circular A-16 was originally issued in 1953, revised in 1967, revised in 1990 (establishing the FGDC), and revised again in 2002 outlining specific federal agency obligations.  A-16 Supplemental Guidance was also issued in 2010. Similar to EO 12906, federal agencies have struggled to implement many of the provisions of OMB A-16 over the same period of time.

The August 2002 revision to Circular No. A-16 was particularly significant in context of naming the stewardship of over 30 data themes to federal agencies in support of both the NSDI and FGDC programs.  Specific datasets included:

 Biological Resources, Cadastral, Cadastral Offshore, Climate, Cultural and Demographic Statistics, Cultural Resources, Orthophotography, Earth Cover, Elevation Bathymetric, Elevation Terrestrial, Buildings and Facilities, Federal Lands, Flood Hazards, Geodetic Control, Geographic Names, Governmental Units, Geologic, Housing, Hydrology, International Boundaries, Law Enforcements Statistics, Marine Boundaries, Offshore Materials, Outer Continental Shelf Submerged Lands, Public Health, Public Land Conveyance, Shoreline, Soils, Transportation, Vegetation, Watershed boundaries and Wetlands.

While all data themes are clearly important in supporting the broad national NSDI efforts, most New York State local governments  have a limited number of day-to-day business work functions directly related to NSDI spatial data themes itemized in the 2002.  (In fact many of the 2002 NSDI spatial data themes are only developed and maintained by federal resources.)  Adding to the disconnect is that many 2015 local government GIS programs, especially in urban areas, have business needs which are not supported by either the content or spatial accuracy of core 2002 NSDI spatial data themes.  For example, local government geospatial programs in the areas of  infrastructure management (drinking water, sanitary sewer, and storm water systems), utilities, vehicle routing and tracking, permitting and inspection systems, service delivery programs in the health and human services, local planning, zoning, and economic development activities are not closely aligned with many of the 2002 NSDI spatial data themes.    While many federal mapping programs and geospatial datasets continue to be consistent at 1:24,000 (2000 scale), most local urban government GIS programs are built on top of large scale (i.e., 1”=100’ or even 1”=50’) photogrammetric base maps.

Not all is lost, however, as some local data products such as parcel boundaries and planimetrics (building footprints, hydrology, transportation) actually are consistent selected 2002 NSDI spatial data themes (Cadastral, Governmental Units, Hydrology, Geodetic Control, Transportation) albeit at a higher degree of accuracy.  Unfortunately, limited capacity or systems have been established to leverage or normalize such datasets into the NSDI.

Unfortunately, even though the federal government continues to identify and list local governments as key stakeholders in most legislative proposals, it’s common belief among federal agencies that resources are not available to monitor or engage local GIS programs (i.e., 3000 counties vs. 50 states).  And there continues to be the (wild) belief state level GIS programs can serve as the ‘middle man’ or conduit between local and federal geospatial programs.  Somehow magically rolling up local government data for use by federal agencies and integrated into the NSDI.  Not really.  At least here in New York State.   And no, old school NSDI Clearinghouses nor the current rage of soon-to-be-yesterday-news “Open Data” portals being equivalent mechanisms in supporting and maintaining 2002 A-16 data themes.

Perhaps sponsors of the Geospatial Act of 2015 could model collection of local government geospatial data assets after the ongoing efforts associated with the HIFLD (Homeland Infrastructure Foundation Data) program.   Though obviously a very different end product from the NSDI, federal agencies producing the HSIP (Homeland Security Infrastructure Protection) Gold and HSIP Freedom datasets have enjoyed relatively decent success in collecting large volumes of local government data – much of which has been paid for at the local level.  And many of the same federal agencies associated with the HIFLD program including National Geospatial-Intelligence Agency (NGA), Department of Homeland Security (DHS), Department of Defense (DOD), and the U.S. Geological Survey (USGS) have stewardship responsibilities of NSDI spatial data themes.  Different.  But similar.   And adding more bewilderment to the discussion is that it is easier to contribute crowed sourced data (structures) to the USGS than it is for local governments to push large scale photogrammetric data of the same features (structures) to federal agencies and incorporated into the NSDI.

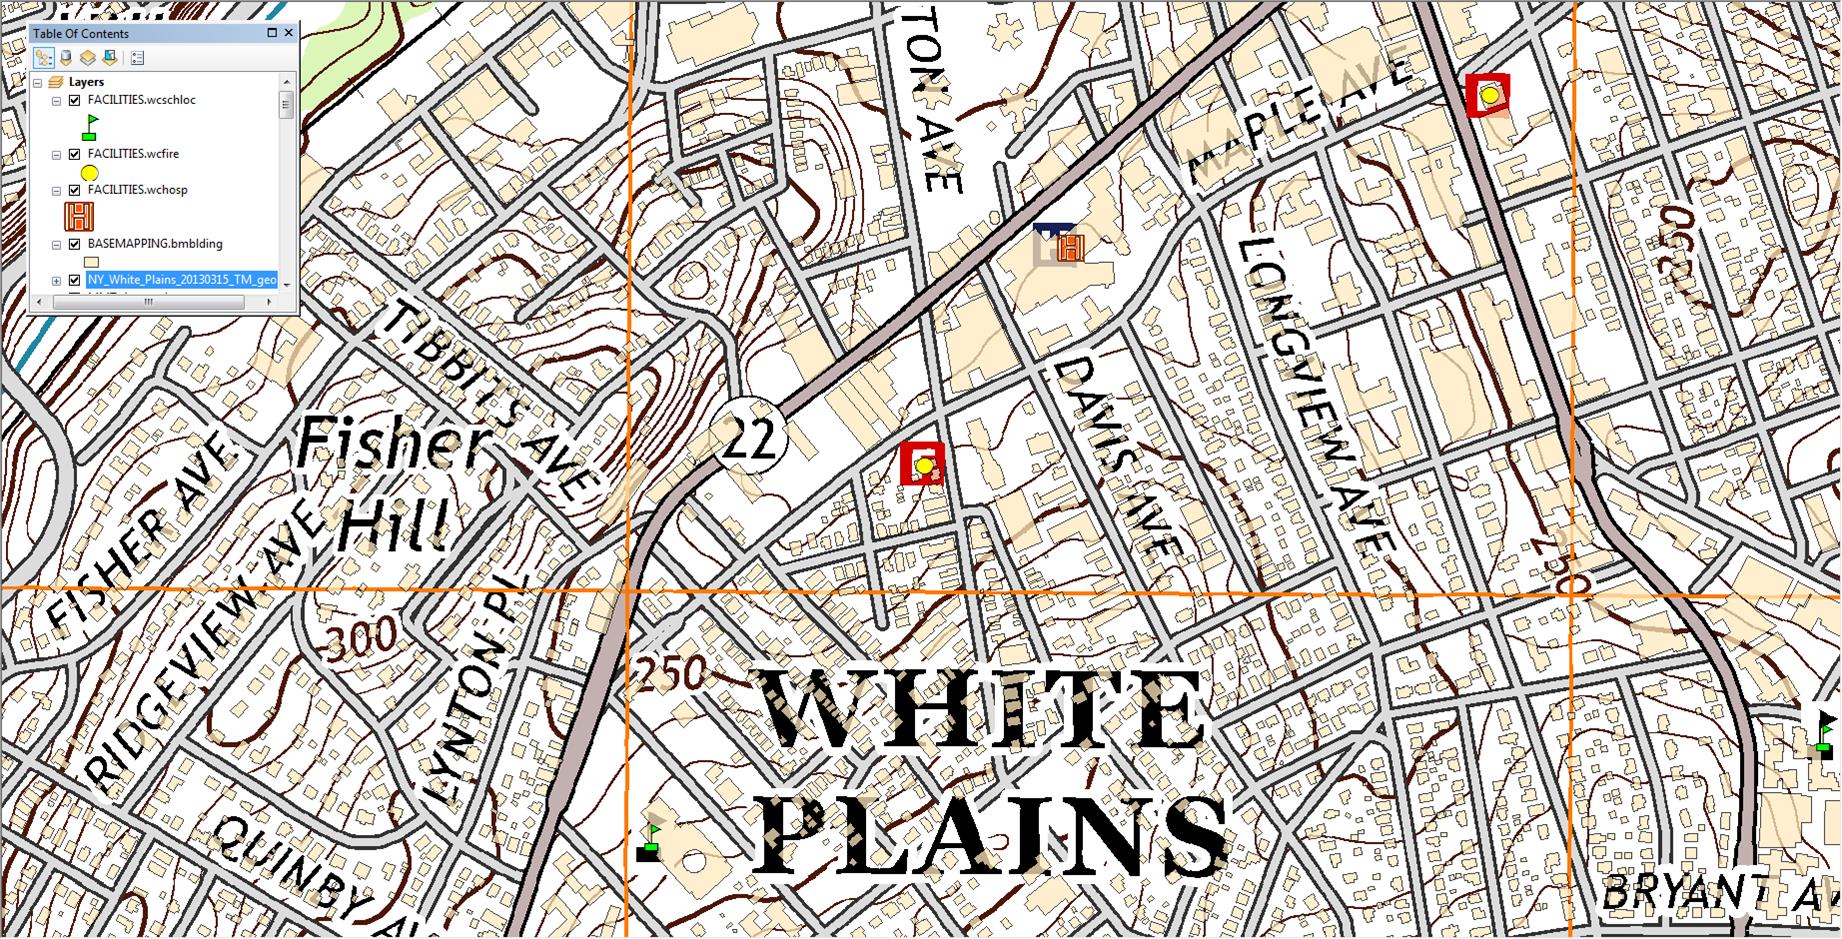
Georeferenced 2013 US Topo White Plains quadrangle.  While selected structures such as schools, fire houses and hospitals are identified on  default US Topo product, this image shows all Westchester County building footprints

Georeferenced 2013 US Topo White Plains quadrangle. While selected structures such as schools, fire houses and hospitals are identified on the default US Topo product, this image shows also shows how local content such as Westchester County building footprints can be made available to the NSDI structures data theme.

Unless a methodical and accepted process – adopted by pertinent local/state/federal stakeholders – is institutionalized  by the FGDC, the Geospatial Data Act of 2015 will continue to be more about federal and state geospatial programs and less about truly integrating and taking advantage of the vast amount of local government data.   The Act needs to specify and fund building work flows which communicate directly with the source of the data as well as working towards reducing the reliance on state “middle men” GIS programs as means to acquire local geospatial data. (Local governments were not even mentioned in a February 2015 General Accounting Office report entitled “GEOSPATIAL DATA: Progress Needed on Identifying Expenditures, Building and Utilizing a Data Infrastructure, and Reducing Duplicative Effort”.  A report which appears to be eerily similar and a rebaked version of the  (ill-fated) 2013 “Map It Once, Use It Many Times”   federal geospatial legislation attempting to reposition the federal effort to coordinate National geospatial data development.

Ironically, just one month prior to the Geospatial Data Act of 2015 being introduced, a scathing report was released by the Consortium of Geospatial Organizations (COGO) entitled “Report Card on the U.S. National Spatial Data Infrastructure”.  In short an overall “C-“ to NSDI effort over the past two decades.  The report falls short in not holding state GIS programs more accountable and responsible as well as most have  jockeyed over the past two decades to be seen as enablers and partners of the NSDI  effort in context of framework layer stewards, recipients of FGDC grants, and establishing/maintaining NSDI Clearinghouse nodes.  States supposedly as “middle men” and conduits to valuable local government geospatial data assets.   Perhaps COGO report cards on individual State government GIS programs are forthcoming.

At the end of the day, NSDI supporters actually do have access to a wide range of local government geospatial assets as files, consumable web services, or perhaps through some other middleware provided by a software vendor.   Or a combination of all the above.  The data and the technology are here.  To the end of furthering the intent of the NSDI, legislation like the Geospatial Act of 2015 will fall on deaf ears and not advance as it should unless the federal government establishes the means to directly engage and connect to local governments.


2015 NYS Spring GIS Conference Specials

Spring continues to be one of my favorite times of the year for a bunch of reasons including March Madness, MLB spring training, and the opening of our local golf courses. And this year, in particular, the end of the long and brutal 2015 winter the Empire State has endured.

Spring also brings my annual summary of favorite one-day regional GIS conferences – most of which are held in locations accessible via a maximum 2-4 hour drive from all parts of the state. These one-day conferences are user-friendly, light on registration fees, provide excellent networking opportunities among colleagues and industry representatives, often provide GISP credit,  provide good presentation content, and minimize overall travel expenses. Sound too good to be true? You decide.

GIS-SIG 24rd Annual Conference, April 14th, Rochester, NY. GIS-SIG is the long standing western New York geospatial educational user group whose primary mission is to “foster the understanding of Geographical Information Systems (GIS) technology.” GIS/SIG provides a professional forum in the Rochester – Genesee Finger Lakes region for GIS education, data sharing, communication and networking with other local, state and national users, dissemination of information about trends and policies related to GIS, and technology advancement. With a loyal membership and Board of Directors, the size and content of the GIS/SIG conference is broad enough to often substitute as an annual state conference for many GIS practitioners in the western half of the state. The conference boasts a wide range of vendors and presentations involving government, industry and business, nonprofits, and contributions from the many academic institutions in the Rochester-Buffalo corridor. Corporate sponsorship keeps the price tag of an individual registration at under a $100 for the day which also includes lunch. Online registration is available and while you are at the GIS/SIG website you can also see the many resources and links GIS/SIG provides to its user community.  To the extent possible, I always try to attend and present at this event.

Northeast Arc User Group (NEARC) Meeting, May 11th, University of Massachusetts, Amherst, MA. Though not in New York State, the Spring NEARC meeting is conveniently located in Amherst, MA which is easily accessible to the Albany Capital District and GIS professionals in eastern New York State. Once considered the smaller venue of the NEARC suite of annual conferences, Spring NEARC grew too large at its original site at Smith College in Northampton, MA and moved to a larger venue at the University of Massachusetts. Unlike the GIS/SIG conference which is software vendor independent, this show is very much ESRI centric though is packed with high quality user presentations, well attended by ESRI business partners, and has grown to be so popular that the show now competes with the larger annual three-day NEARC Conference held in the fall and other similar New England GIS shows. This is a great one-day conference, well attended, great user content, easy access, lots of opportunities to meet industry representatives and ESRI regional staff, professional networking, and includes lunch – all normally in the $50-$75 price range. If you can afford an overnight, activities the evening before downtown Amherst and a hotel room at the UMass conference center (where NEARC is held) make it even more worth your while. If your organization is an ESRI shop – this is a Spring show not to miss.

Westchester GIS User Group Meeting, May 14th, Purchase College, Purchase New York. As one of the largest geospatial meetings in New York State, the Westchester GIS User Group Meeting is a free one-day conference held at Purchase College. Made possible by financial support from exhibiting vendors and conference facilities provided by the college, the 2015 event includes a wide range of user presentations, student poster contest, and an on-campus geocaching and orienteering (aka Map Adventures) contest. The Purchase College location provides easy one-day access across the metropolitan NYC area, as well as the broader lower Hudson River Valley and southeastern Connecticut. Agenda and other meeting specifics – including registration – is available from the Westchester County GIS website.

So, if overnight travel and expenses are simply not available or significantly limited, fret not – there are regional geospatial meetings and conferences which are accessible from most areas of the state AND provide many of the same benefits of larger shows. And at the same time easy on the wallet. At the end of the day, it will be worth your while and you’ll be supporting both your colleagues and industry representatives which support our Empire State GIS programs.

Happy travels!

The Blue Highways of GIS: Seneca Nation of Indians

Location

The Seneca Nation of Indians (SNI) is a federally recognized tribe located in what is now Western New York State.  It consists of five territories.  These territories are adjacent to the counties of Allegany, Cattaraugus, Chautauqua, Erie and Niagara in an area of the state where communities are primarily rural in geographic location. The territories are not contiguous and each is unique in its economic, social, and environmental profile.  With 53,947 acres, the Seneca Nation controls and holds a significant land base in Western New York. The Seneca Nation of Indians traditionally lived in New York between the Genesee River and Canandaigua Lake and as far south as northwestern Pennsylvania and Eastern Ohio; however, currently the Nation is located strictly in the Western New York area.

In two different offices (Irving and Salamanca) nearly forty miles apart, Nation GIS staff communicate daily on a wide range of tribal GIS projects.   The GIS Division is a part of the Community Planning and Development Department.  The SNI-GIS Team consists of Ms. Gerri Jayne Jimerson GISP (tribal member) who has served the Nation for nearly 14 years, Todd LaQuay GISP, who covers the Cattaraugus Territory and has been with SNI for 11 years, as well as Trever Annis who handles GIS duties on the Allegany Territory. Continue reading

Focus on New York State Geospatial Businesses

Along with general observations and comments on the state of geospatial technologies in the Empire State, including occasional posts associated with the Blue Highways of GIS series, eSpatiallyNewYork introduces a new column:  Geospatial Business Spotlight.

Posts in the column will not only focus on long-time Empire State GIS service providers and consultants but will also include the new generation of geospatial businesses and start-ups in the  mobile, Cloud, research and development (R&D), and   Open Source  spaces.   While the growth of business GIS applications is apparent in many existing private sector markets (e.g., real estate, banking, retail, insurance, telecommunications, market research) – whose growth continues to be augmented by expanding mobile technology and location analytics –  many of the same business GIS solutions will be adopted by government programs as public funding for geospatial programs continues to be limited.  Regardless of either old or new – all companies highlighted will be ones making significant contributions to the growth and development of geospatial technologies across the Empire State. Continue reading

Building a New York State Community Mapping Framework

Concurrent with the growth  of user-friendly and often free online mapping programs, so have the “community” based mapping and planning projects.  While  earlier generations of geospatial programs focused, and continue to do so on many levels,  on mapping the physical world, a new generation of GIS programs and initiatives increasingly focus on the mapping and inventorying of health and human services programs which support a wide range of societal issues and needs.   Community mapping programs run the spectrum from being volunteer crowded-sourced  to those with full-time, permanent staff with many being aligned with  nonprofits, schools, youth and religious groups, and  university-based efforts.  Seen in a larger context, community mapping projects are often critical components of important global environmental and humanitarian initiatives (Haiti earthquake,  Ebola epidemic, CrisisCommons, others).

The Google Maps (New York Community Mapping Projects) Gallery provides numerous examples of statewide community mapping projects.   More specific examples include SolidaryNYC which is a program highlighting community supported agriculture (CSA) locations,  health care systems, and advocacy organizations while GrowNYC  provides community resources mapping in the areas of recycling, education, green markets, and noise pollution, and HabitatMap, a non-profit environmental health justice organization raising awareness about the impact the environment has on human health.   And of course there is the uber, long standing OasisNYC initiative which includes online access to data on community-wide food systems, environmental stewardship groups, community gardens, and subsidized housing locations.  Here in Westchester County, County GIS staff has worked closely with the Food Bank of Westchester  mapping the locations of food pantries across the County.  In nearby New Jersey, the Center for Community Mapping supports community mapping efforts for children (GIS4Kids), healthy lifestyles, and plant/wildlife habitat inventories. Continue reading

The Blue Highways of GIS: Watertown, New York

On the second floor of the main visitors building within the New York Zoo at Thompson Park in Watertown, New York are the offices of the Tug Hill Tomorrow Land Trust (THTLT).  The Trust is a regional, private, nonprofit organization founded in 1990 by a group of Tug Hill residents, and incorporated as an independent, nonprofit organization.   Since 1991, the Trust has permanently conserved more than 15,000 acres, and worked with over 86 landowners in Jefferson, Lewis, Oneida, Herkimer, St. Lawrence  and Oswego Counties.   The conserved land includes working farms, productive forestland, recreation and wild lands – all conserved through voluntary, private land protection.   The Trust works collaboratively with many local and statewide conservation organizations – including Ducks Unlimited, Nature Conservancy, Wildlife Conservation Society, among others – to make conservation projects happen.  THTLT is one of dozens of other statewide Land Trusts associated with the Land Trust Alliance and is an accredited land trust through the National Land Trust Accreditation Commission. Continue reading

The GIS Fork in the Road

New York City GISMO (Geospatial Information Systems and Mapping Organization) hosted the GIS Startup and Open Data Forum meeting at the New York Public Library on November 18th.   The agenda included a series of five-minute lightning talks featuring nine existing and emerging startups including LavaMap, Local Data, Placemeter, Sourcemap, CartoDB, Boundless, Ontodia, Interface Foundry, and Liquid Galaxy.  The second half of the meeting consisted of similar five-minute presentations by (largely) government data providers including Westchester County GIS, Colin Reilly, NYC Dept. of Information Technology and Telecommunications,  Matt Knutzen, New York Public Library Map Division, Chris Barnett, OpenGeoPortal, and Andrew Nicklin, Director,  Open New York. Continue reading