March 2023: Tax Parcel Data Sharing in New York State

Half of New York’s Counties now make parcel data available for free through Open Data efforts though barriers in specific governments still need to be overcome before statewide data is available

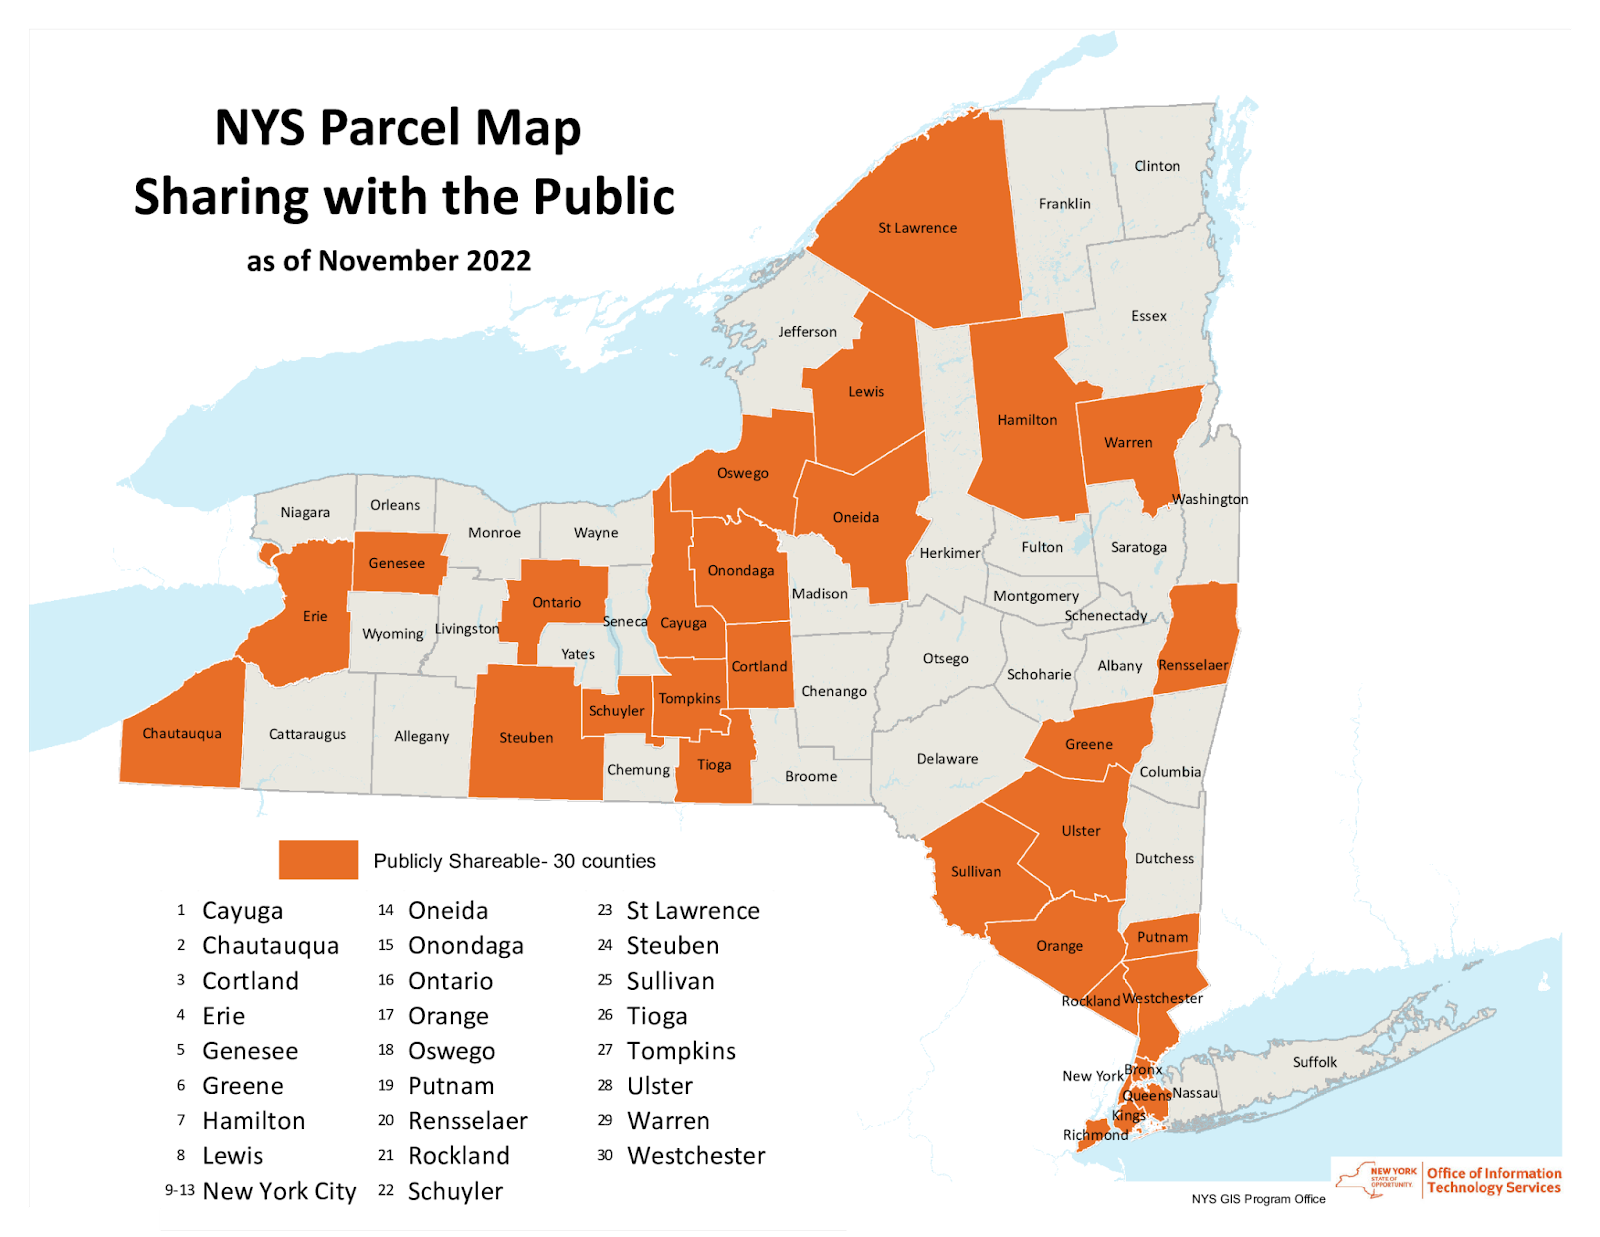
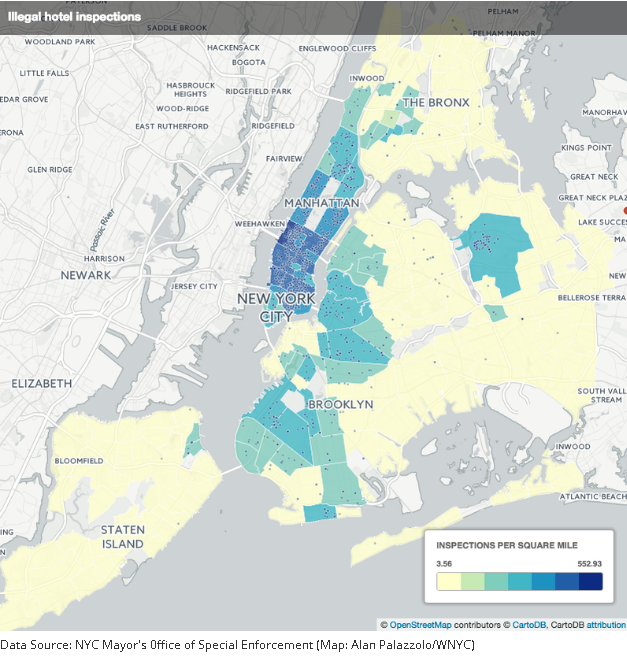
Not too long ago, I was communicating with a colleague about how some governments still, in 2023, continue to charge or license tax parcel data.  At first, somewhat amazing considering how far the Open Data movement has come over the past 10-15 years across the Empire State.  As recently as late 2022, information from the NYS GIS Program Office, which monitors the availability and sharing of tax parcel data statewide, shows that nearly 50 percent of NYS counties are making tax parcel data available for free through various means.  Great strides being made perhaps suggesting that one day the barriers prohibiting the sharing of parcel data across the entire will finally be nonexistent?   And that the gripes and complaints I was sharing in conversation with my colleague would go away.

Or maybe not.

Since November 2022, this map has been updated and NYS GPO now notes that half of the statewide counties currently share tax parcel data

Issue Was Discussed Early On – What Happened?

In the early days of statewide GIS development (circa 1990s) the GIS community was fortunate to have Bob Freeman, former Executive Director of the New York State Commitee on Open Government (COOG) participating in the growth of the GIS movement.    Bob seemingly recognizing and witnessing the formation of a technology which would have a tremendous impact on government records and data.  Almost knowing that as part of the new technology, digital versions of data would become just as important or even more valuable than hardcopy format.  He was involved in statewide GIS conferences and contributed in many ways.    All said and done, he was a staunch advocate of making GIS data available – largely long before the “Open Data” concept was framed.

I was only able to find a few of his opinions searching the COOG archives and ultimately reached out to the current COOG Executive Director Shoshana Bewlay to both bring to her attention of governments still charging for tax parcel data as well as to see if she, or her staff, might be interested in revisiting the issue.  I heard back promptly from  Kristin O’Neill, Assistant Director who was kind enough to send me a link to all of the COOG opinions (7) which included “GIS”.  The links to all of the GIS-related opinions are below which can either be read through in its entirety or skimmed-over.   There is a lot here some of which is better interpreted by an attorney.  7507, 11230, 13575, 14366, 15058, 15695, 19246.  Looking back, I’m not sure why I thought the issue had gone further along in the legal system and had been resolved to a more definitive degree. But these few opinions suggest otherwise.  

More than once, COOG responded to the question/issue of an individual or organization questioning the basis of a government organization either selling or licensing tax parcel data.  And in general, each time, the COOG response – or opinion – was the same noting that electronic records (digital) records are no different than hardcopy records and should be made available at the cost of duplication.  (Keeping in mind original Freedom of Information Law (FOIL) costs of duplication were originally based on hardcopy records (i.e., for example 25-cents per page) and did not/does not have specific rates for digital data duplication.  Today, staff time, tapes, etc., can be included in the charge. However, since COOG opinions are advisory in nature only in context of FOIL, the early inquiries did not result in any formal legal challenge being launched on any level against any entity with regard to the selling of tax parcel data.   Suffolk County early on became involved in litigation on licensing/copyright issues (referenced in one of the opinions) which is still in place today.  But by the late 1990s, the selling of tax parcel data was in place and had become business as usual.  It seems the geospatial community is no further along in “the challenge” to the selling or licensing of tax parcel data than we were some thirty years ago.

Continue reading

Streamlining the New York City Environmental Quality (CEQR) Review Application with Geospatial Tools

Open source content and tools at the core of automating complex process

City Environmental Quality Review, or CEQR, is the process by which New York City agencies determine what effect, if any, a discretionary action they approve may have upon the environment. CEQR is a disclosure process and not an approval process in and of itself. Completion of an environmental review supports other decisions made by agencies such as approvals of rezoning or variance applications, funding, or issuance of discretionary permits. Ministerial actions, such as the issuance of a building permit, are not subject to environmental review.

Historically, CEQR, along with other government environmental review programs such as the New York State Environmental Quality Review Act (SEQRA) and the National Environmental Protection Act (NEPA) have been the subject of much debate – right or wrong – with regard to being overwhelming, complicated, and costly to those individuals and/or organizations involved in projects or “actions” which trigger the application process.

CEQR is precursor to ULURP (Uniform Land Use Review Procedure), which, in part, is the approval process that decides the fate of the action.  ULURP cannot start until the environmental review process is complete.

Introducing AutoCEQR

In the New York CEQR space, leave it to a couple seasoned GIS folks to step in and combine  professional experience with geospatial tools and programming skills to offer a cost effective and streamlined process to work through the CEQR application.

AutoCEQR cofounder Matt Sloane has worked in the planning field since 2007, working extensively with SEQRA and CEQR.  Over that time Matt developed specialties in both GIS and Data Science.  As Matt learned to program the tools that power ESRI ArcDesktop software, he realized that many of the processes required by CEQR, which are explicitly prescribed by the CEQR Technical Manual, could be automated based on existing data (e.g., MapPLUTO) and several project-specific inputs. He approached Danny Sheehan, a close friend and former classmate at SUNY Geneseo’s planning and geography courses, about the project. Both agreed it would be a great opportunity to put their combined skills to work and build a platform to augment the CEQR application process.  Danny was able to bring geospatial development expertise and software production knowledge he learned at UBS, Carto, and Columbia University to start and evolve the project into a production application.

AutoCEQR leverages a mixture of City, State, and Federal data resources, though primarily relies on NYC Open Data.  Other data sources include:

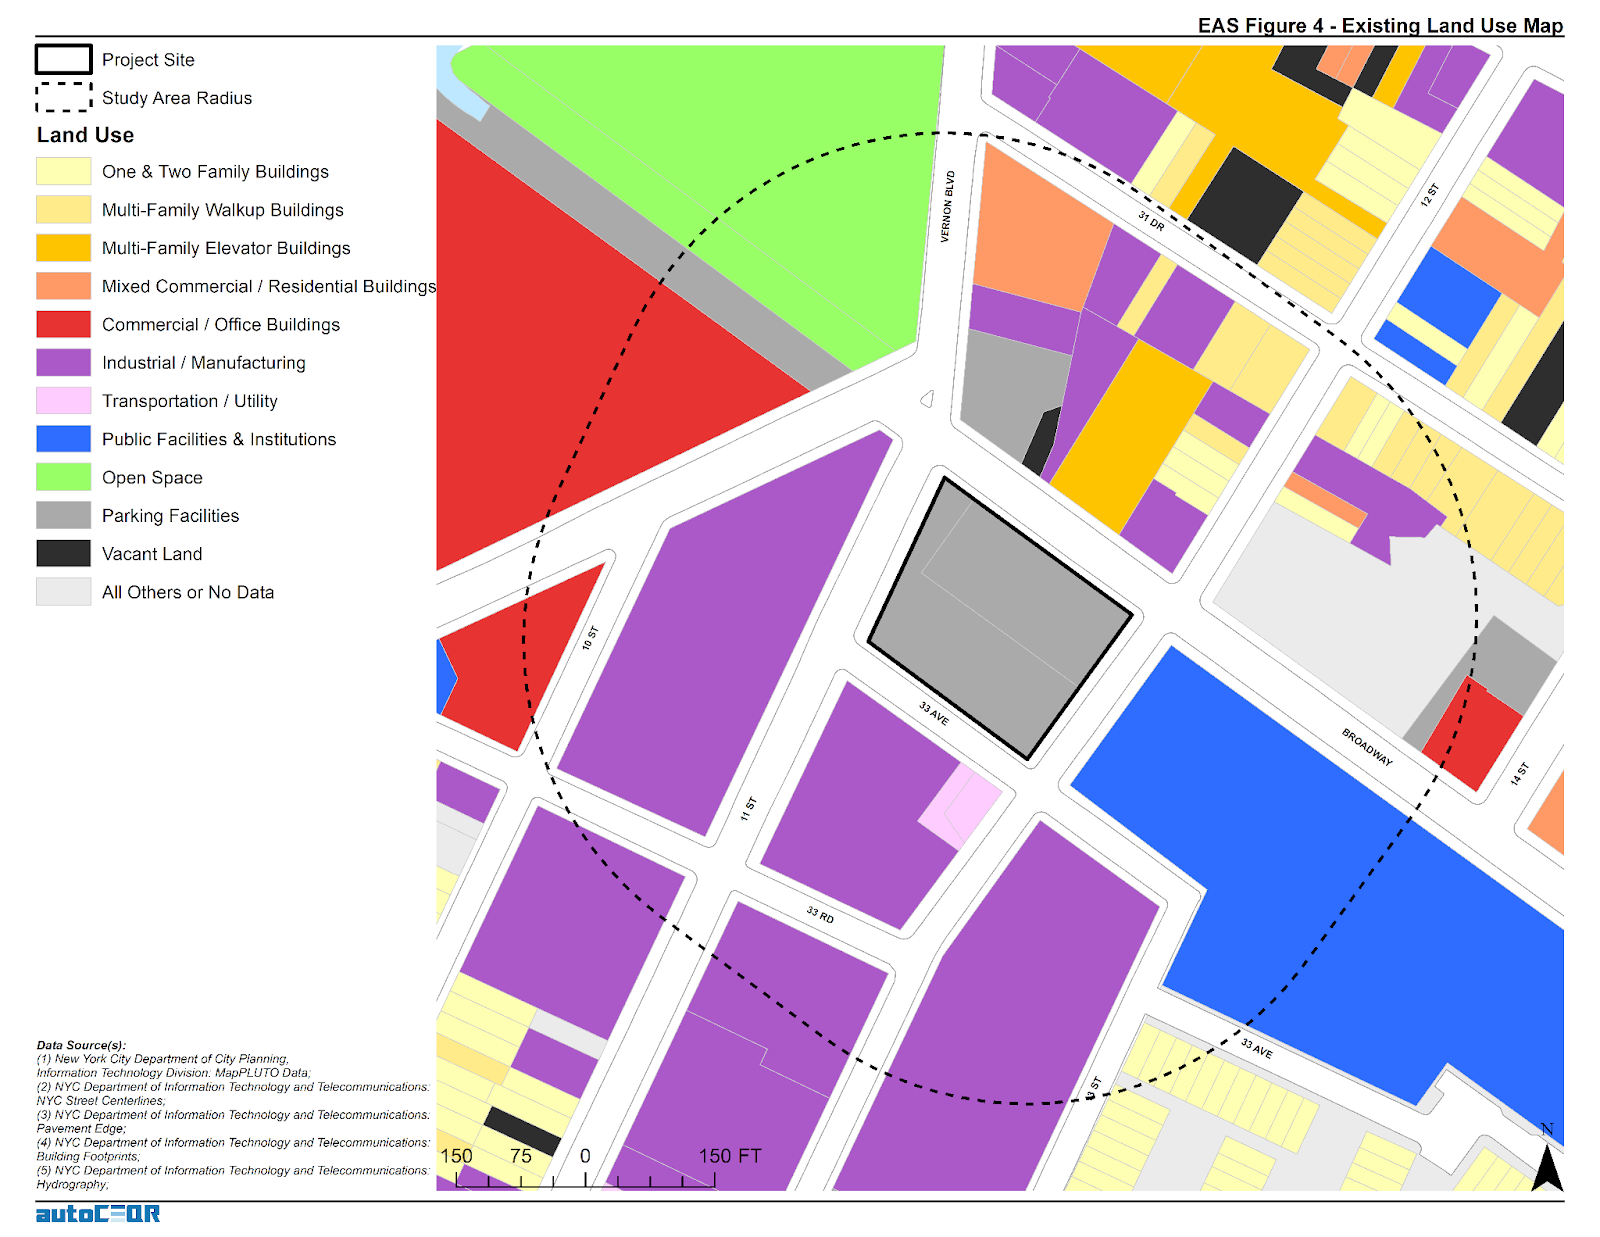
This 400’ radius buffer around a subject property which requires CEQR shows adjacent parcel land use classifications that are included in the NYC MapPluto file on a regular basis

A. Coding and Software Environments

Python is at the core of the AutoCEQR technology.  For working with data, the AutoCEQR team uses  Pandas, GeoPandas, Shapely, Fiona and ArcPy for generating Map Document files (.mxd’s), and creating custom Python classes for the workloads.  Sheehan notes “With GeoPandas and Shapely it’s phenomenal how close to parity they now are for matching ArcPy functionality.”  In the development environment, PyCharm Community Edition and GitHub are used for code development & versioning.   

AutoCEQR prototyping started with ArcPy for all tasks but it was decided to abstract the high-level functions so the geoprocessing engine could be changed to GeoPandas, the geoprocessing library of choice.  For interacting and communicating with Amazon Web Services (AWS) – the current AutoCEQR Cloud Computing Platform – developers leveraged Boto3 (AWS SDK for Python).  EC2 and S3 is leveraged in the AWS environment for computing, data storage, and distribution which has enabled to keep the application computing bill fairly low per month. In the future, it is anticipated to modify the architecture by leveraging more serverless technology and more scalable architecture for added compute cost savings.   AWS generously provided AutoCEQR with free computing credits for one year through AWS Activate – which was brought to their attention as part of their involvement and experience at the Columbia Startup Lab (CSL).  QGIS is also used to verify results and quick GIS work. 

Interacting with Census data and a whole host of services is made possible by leveraging the many great open-source libraries available on PyPl and GitHub. The storefront is the Squarespace AP which is used to process and deliver orders.

AutoCEQR still uses ArcPy mapping for generating maps, .mxd’s, and map packages but given the high cost of licensing and the technical slowdown it adds to both the production application and ongoing development speed, and it’s unclear if .mxd’s will exist in future iterations. (Both Sheehan and Sloane would like to have more feedback from users if the .mxd deliverable is necessary or if the application should generate static maps with Matplotlib and GeoPandas or if interactive web maps would be more helpful.)

The data engineering ETL process mostly consists of pulling down data with requests, unzipping files, some transformations and projecting data, and API libraries and a scheduler. We download the latest data every night – whether the source is updated daily or not. Data ETL would be a big focus to redesign to improve the platform and save on cloud storage and computing costs.

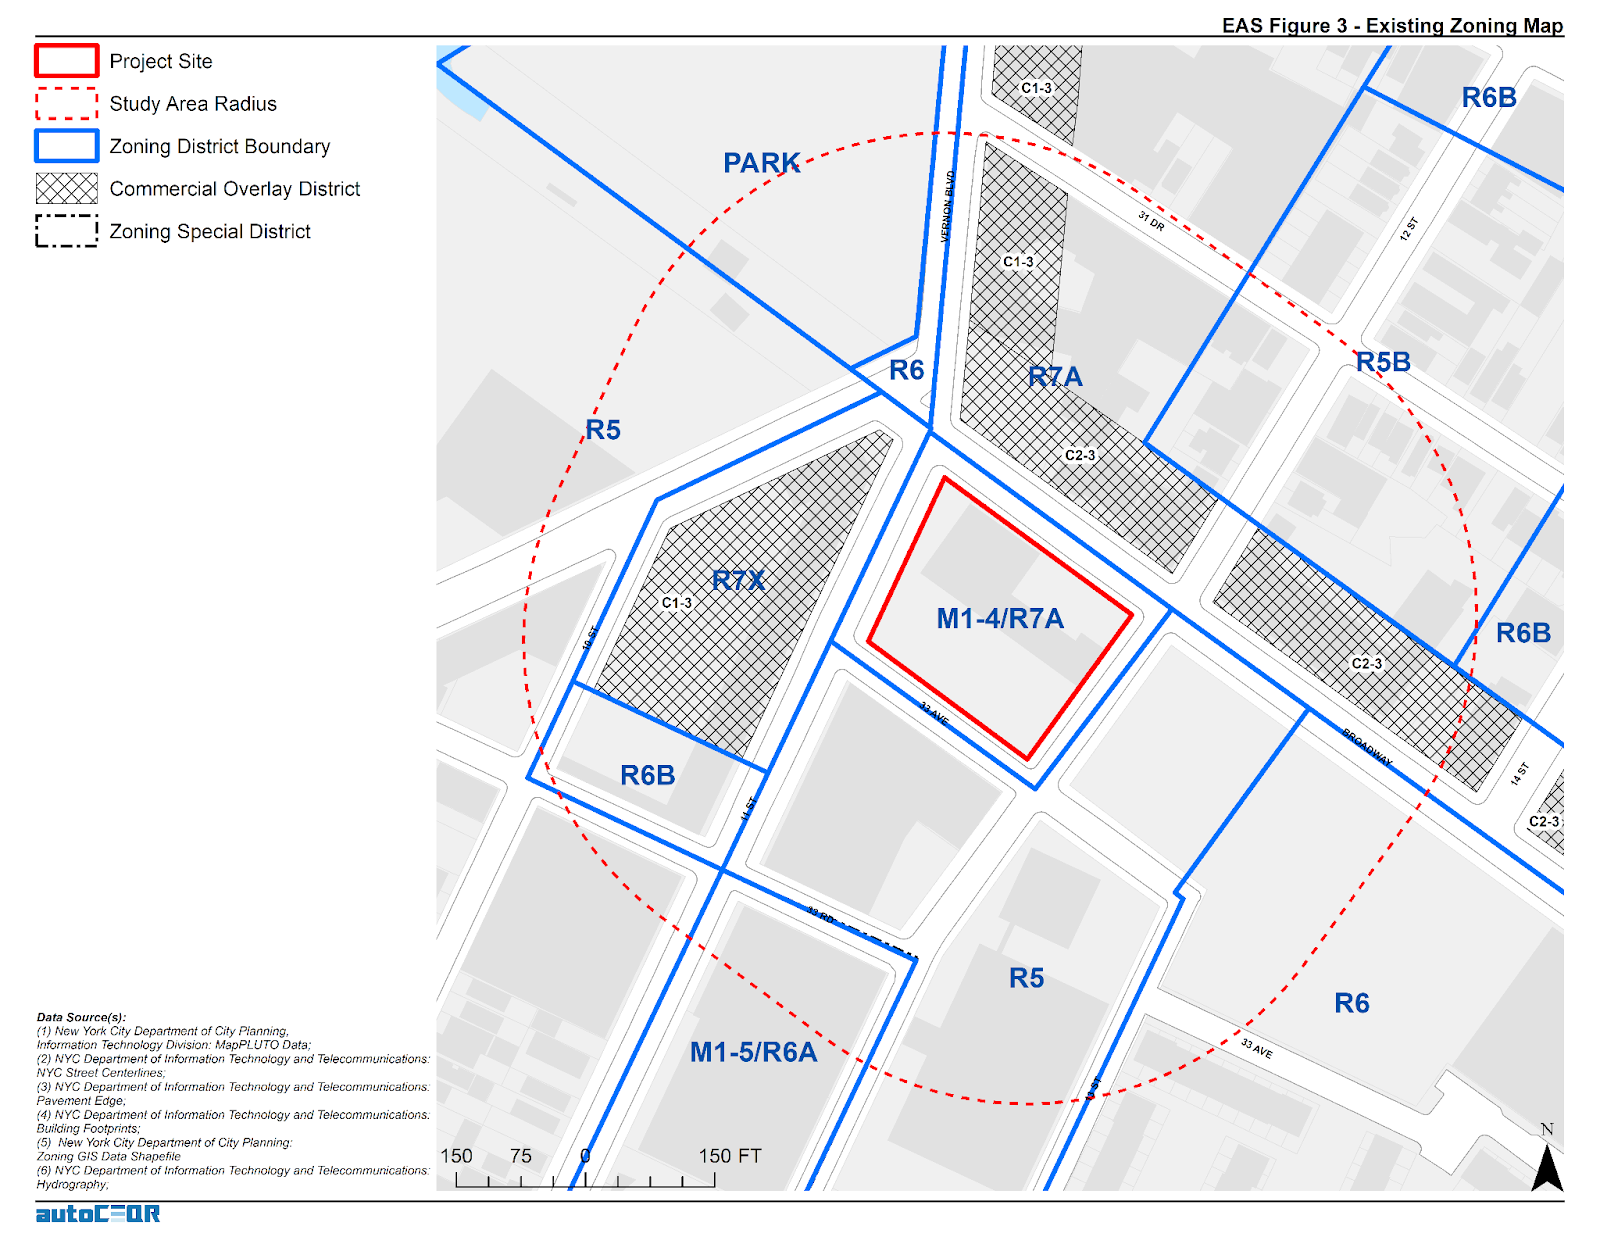
In addition to being consistent with existing property zoning classifications, projects are also reviewed in context of proximity to a myriad of other special districts and overlay zones.

B.  Application Process

Users input relevant project-specific information (e.g., dwelling units, building height, square footage, etc.) via the AutoCEQR website.  From there the application software ingests  the data and checks it against public data sources – usually with some intermediate geoprocessing steps required – and then references the analysis thresholds stated in the Environmental Assessment Form (EAS) to determine which analysis the proposed project is required to undertake as part of the CEQR environmental review. For certain quantitative calculations,  AutoCEQR has translated all of that logic into functions or classes in the codebase. Users also receive the data and maps for either a CEQR Pre-Screen or a select set of CEQR Full Analysis items. This VIMEO video provides an introduction to accessing the application and illustrates the products generated.

C.  Usage

To date, AutoCEQR has had several dozen environmental professionals targeted from a few key firms to evaluate application and then go on to use AutoCEQR in production. Currently Sheeran and Sloane are allowing users to leverage AutoCEQR freely in order to get helpful product feedback and gain traction.  With the aim of soliciting feedback for refinement, feature expansion, and product evolution,  AutoCEQR has been well received by former director of the NYCDCP Environmental Assessment Review Division, Ms. Olga Abinader.  She comments:

“AutoCEQR is an excellent application – as its title indicates, it automates tedious, time-consuming CEQR documentation that has historically taken consultants dozens of person-hours to complete.  As a longtime NYC environmental review expert and former public service leader, I appreciate that it gathers data points from the City’s publicly available databases and agency websites (MapPLUTO, NYC Parks, NYC LPC, GIS sources), and combines this information with user inputs (i.e., analysis framework details) to generate useful EAS Maps, visuals, and content/data for the EAS Forms in a short turnaround. Given the time savings it offers, I am very enthusiastic about AutoCEQR as a tool and recommend it highly to consultants, public service professionals, the general public, decision-makers and others interested in preparing or reviewing CEQR materials.” 

As the product is currently operating under a freemium model, users don’t need to currently apply the discount.  However, it is important for AutoCEQR to continue this offering to support affordable housing in NYC in the event AutoCEQR ever moves to any kind of fee-based model. 

All AutoCEQR maps included in the project delivery file as both ArcGIS Map Document files (.mxd) and Map Package files (.mpk).

D.  Affordable Housing Development Services Discount

Those working on the development of Affordable Housing or Inclusionary Housing are encouraged to contact the AutoCEQR team.  It is their aim is to provide the AutoCEQR platform and reporting deeply discounted for individuals or companies involved in these types of housing projects.  If the entire development provides 100% Affordable units, the AutoCEQR team intends to provide free reporting and analysis.*

As the product is currently operating under a freemium model, users don’t need to currently apply the discount.  However, it is important for AutoCEQR to continue this offering to support affordable housing in NYC in the event AutoCEQR ever moves to any kind of fee-based model. 

* Free reporting with minimal overhead for costs associated with report processing. 

Summary 

Development and marketing efforts on the AutoCEQR project has slowed down since both Sheehan and Sloane have started new full-time positions.  Nonetheless, both continue to explore interesting options for its future development and continued success.  Individuals and companies interested in the application and/or communicating with Sheehan and Sloane are encouraged to do so via the contact information below.

Contact:

Daniel M. Sheehan
danny@autoceqr.com

Matt Sloane
matt@autoceqr.com

LAMP: The Authoritative Liquor License Mapping Application for New York State

Its not too often one bumps into New York State Liquor Authority (SLA) GIS staff along the geospatial trail across the Empire State, but over there on the sidelines, agency staff continue to maintain an admirable web mapping application entitled  New York State Liquor Authority Mapping Project (LAMP).  I was able to catch up with William Cowley, Public Information Officer for the State Liquor Authority (SLA), to find out more about the 2021 release of LAMP.

Current LAMP Application

With the current version of the application finalized in March of this year, LAMP features an impressive tool kit to explore the vast statewide SLA database containing locational data on active, pending, and inactive permit data for beer, wine, and liquor establishments.  The data can be filtered even more specifically to show those locations which are categorized by:

  • On Premise Liquor
  • On Premise Wine
  • On Premise Beer
  • Off Premise Liquor
  • Off Premise Wine
  • Off Premise Beer
  • There are also permits for manufacturing and wholesale

In addition to serving as a great public information outreach tool, the application also serves as a useful utility and reference tool for applicants seeking a liquor license anywhere in the state.  The user online HELP documentation is excellent and available for download as well.

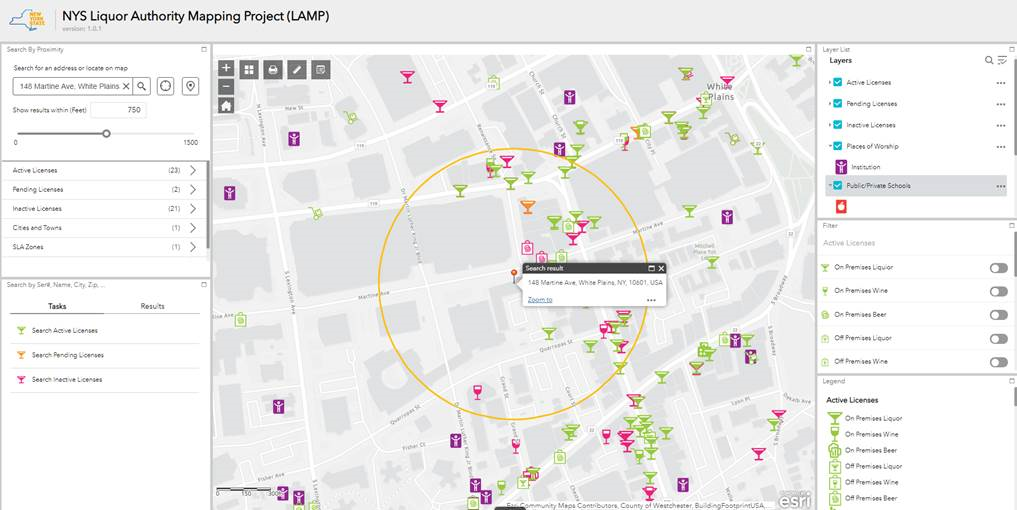
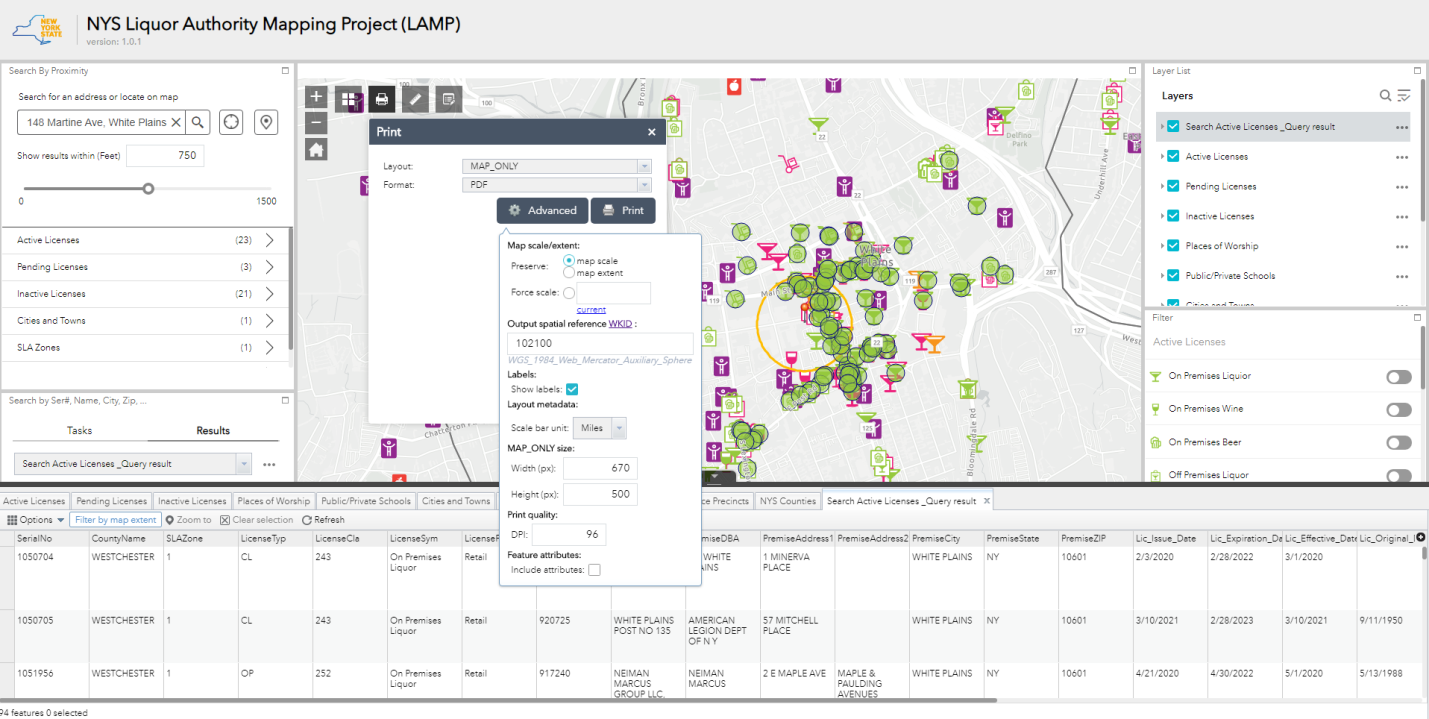
A 750-foot default search around 148 Martine Ave. in White Plains identifies 23 locations with active NYS liquor licenses, two pending, and 21 former or inactive licenses. Icons are colored coded to match active, pending, or inactive licenses keyed to the Legend box in the lower right-hand corner of the viewing screen (which can be expanded on the live online version).

Nearing almost ten years old, LAMP was originally launched in February 2012.  SLA staff assisted in the original development and launch of LAMP with consultant support from Fountains Spatial.  The 2021 LAMP update was completed with the assistance from Troy-based Cogent Technologies.  The viewing application is built on top of a customized version of ArcGIS Online (AGOL) and utilizes a SQL database to store SLA master data.  Updated daily, the application contains approximately 54,000 active and pending licenses.  The database is built on top of the application process which starts here.  The site makes use of the New York State Geocoding Service with the Google geocoding service as a backup.  LAMP is hosted by New York State Office for Information Technology Services.

Mapping Tools

The viewer includes an impressive user toolbox with several functions being AGOL defaults (i.e. scale dependency of map features, identify tools, .  Others have been customized to provide increased functionality and use of the data.  While changing base maps, scale dependency rendering of data, searching by address or user placed pin, or exporting search results to a CVS file are standard AGOL fare, LAMP offers some cool extended functions including, but not limited to:

    • Query results displayed as a new layer in map legend
    • Customized symbology for all feature types
    • A “measuring” tool which creates both a list of the closet (8) licensed facilities as well as within the 200’ and 500’ regulatory buffer areas (see below). A sample of a proximity report can be downloaded here.
    • An uber robust printing tool with advanced functions to create hardcopy maps
    • Easily include and attribute table view – below the main map window – of a particular layer

There are many other functions well documented and available in the application as well.

Image above highlights customized features in the LAMP application including expanded printing functions and creating new layers which are shown in the layer legend.

While the permitting process does not require the use of LAMP,  most applicants find it useful to identify prior licenses at their chosen location.  The locations of Public/Private Schools and Places of Worship are also included in the application because under the Alcoholic Beverage Control Law, SLA may not issue full liquor licenses (for bars/restaurants or for liquor stores) if the location is within 200-feet of a school or place of worship.  There is also a “500-foot law” which the agency must consider if there are already three or more active liquor licenses within 500 feet of the proposed location.

Integration with SLAM

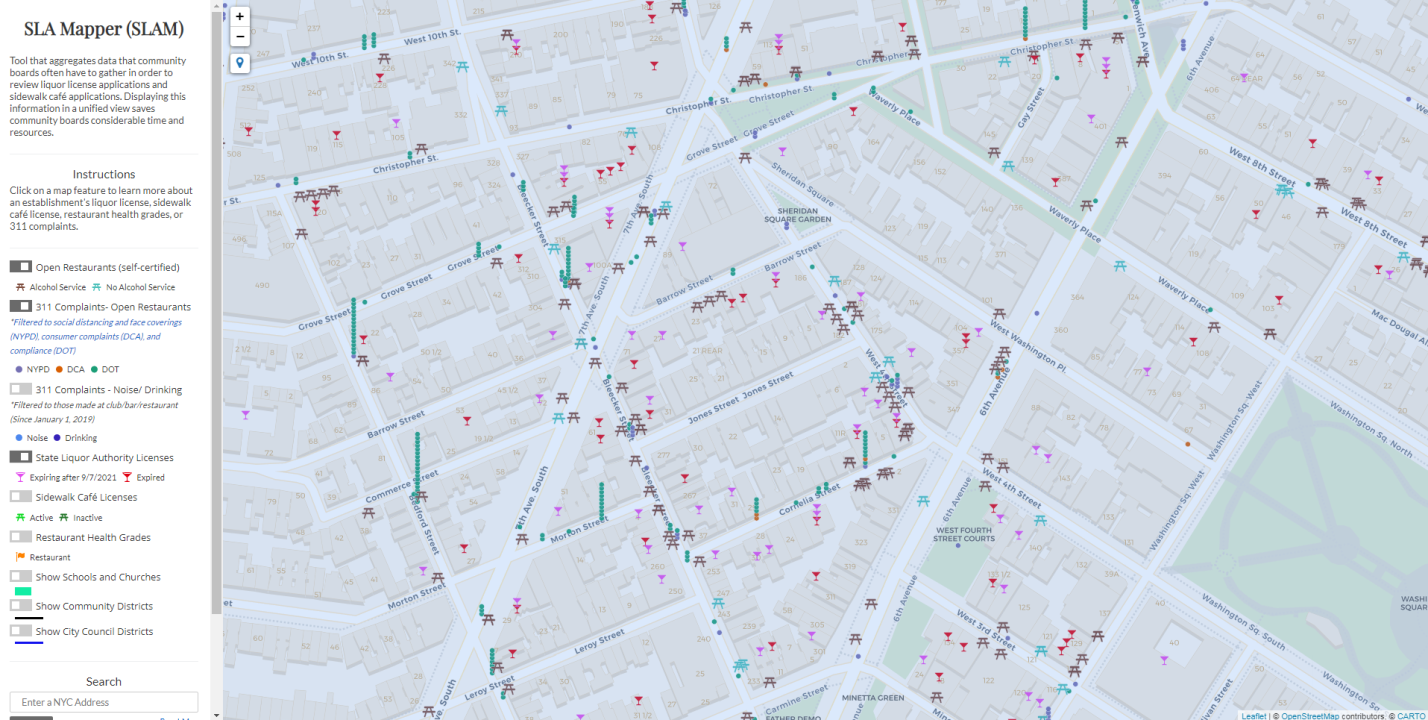
In an interesting use and application of the SLA database, reference is made to BetaNYC’s SLAM viewer.  Used by community boards when reviewing liquor license applications and sidewalk cafe applications, the public facing tool aggregates information about active liquor licenses, sidewalk cafe licenses, 311 complaints about bars/restaurants/clubs, and restaurant health inspections in NYC onto a single map.   Statewide liquor licensing data can be downloaded from Open Data NY here.

SLAM effectively integrates numerous open data datasets including those from New York City and SLA. Users can zoom to particular addresses and click on relevant features to collect information that may be needed to review a license application. The tool is rendered through Carto – a Web mapping service

Contact:

William Crowley
Public Information Officer
New York State Liquor Authority
William.Crowley@sla.ny.gov

SPEED 2.0: Authoritative Environmental Remediation Mapping in New York City

Application Includes the use of both Open Source Software and Open Data Content

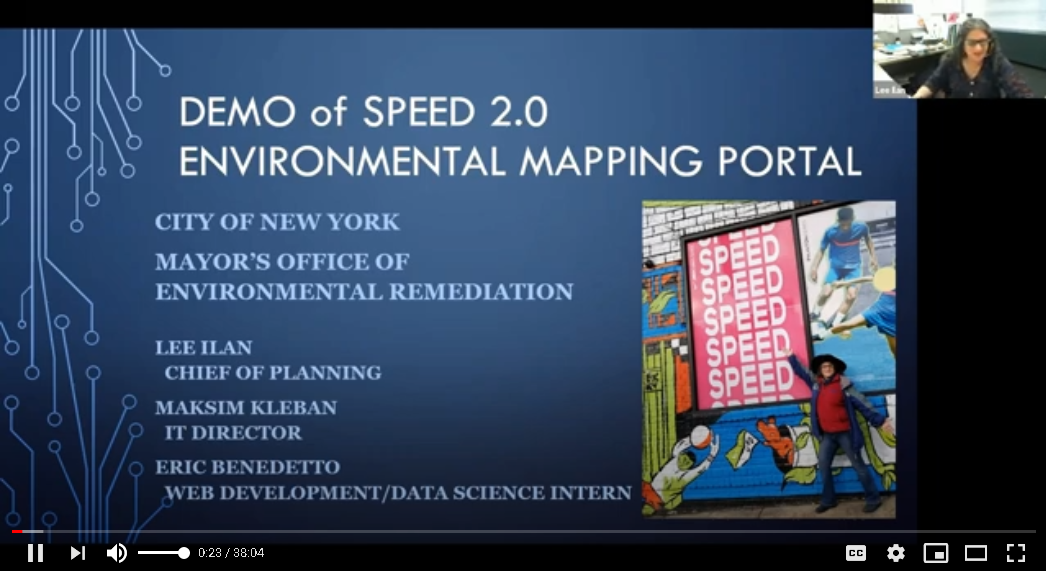
A lot of great geospatial projects and content are coming out of the NYC OpenData ecosystem.  In the same space  throughout the city is the deployment of applications and viewers using open source software.  One such app is the Searchable Property Environmental E-Database SPEED 2.0, built on top of CARTO and published by the Mayor’s Office of Environmental Remediation (OER).  I was introduced to the application via an online presentation organized by GISMO in March of this year.

SPEED 2.0 is an impressive collection of local/city, state, and federal geospatial datasets wrapped into one application for the purpose of helping individuals identify environmental issues – both current and past – on and/or adjacent to specific properties in New York City.  It is a sister application to the NYC Office of Environmental Remediation’s Environmental Project Information Center (EPIC) that provides information about the cleanup of brownfield sites across the city.

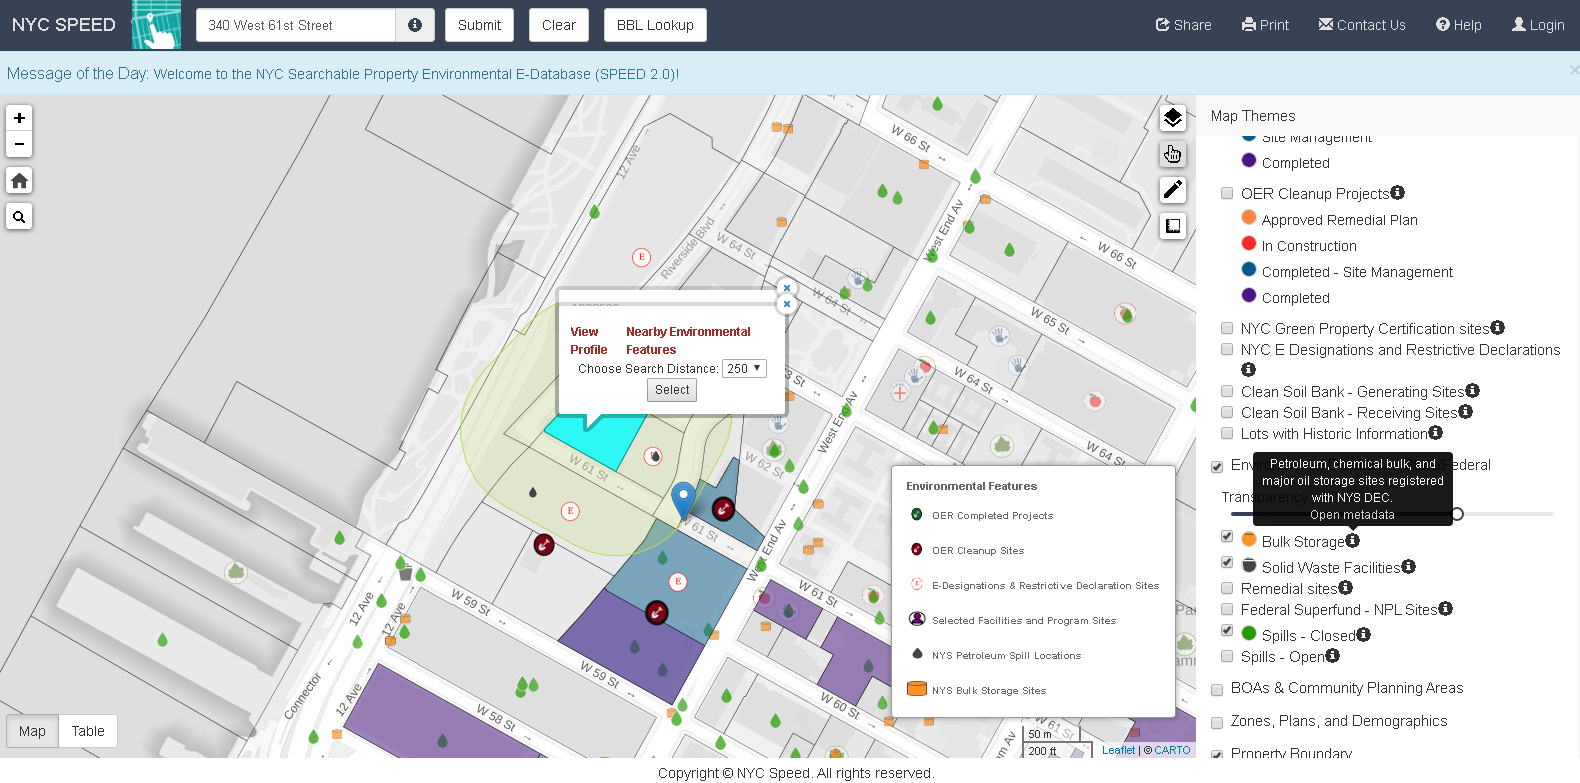
Individual parcels can be buffered by either 250’ or 500’ to show the proximity of adjacent parcels with current or past environmental issues, permitting, or contamination issues. Access to pertinent metadata is readily available.

Background

According to Lee Ilan, Chief of Planning in the Mayor’s Office of Environmental Remediation, the first version of SPEED was launched in 2009 as a web map with limited functionality and developed with PostGIS.  It was launched in support of the newly created office’s focus on the cleanup of brownfields across the city.  However, support for the initial application waned over the next several years with minimal new content added.  Post – SuperStorm Sandy provided new funding through the U.S. Housing and Urban Development (HUD) Community Development Block Grant Disaster Recovery Program which OER secured and offered the opportunity for a major rewrite and update of the original application. SPEED 2.0 was designed by their vendor Applied Geographics (AppGeo) to be a cloud-based application.  Originally the application was managed by the vendor but since December 2020, OER has assumed managing the app in the Google Cloud on their own.

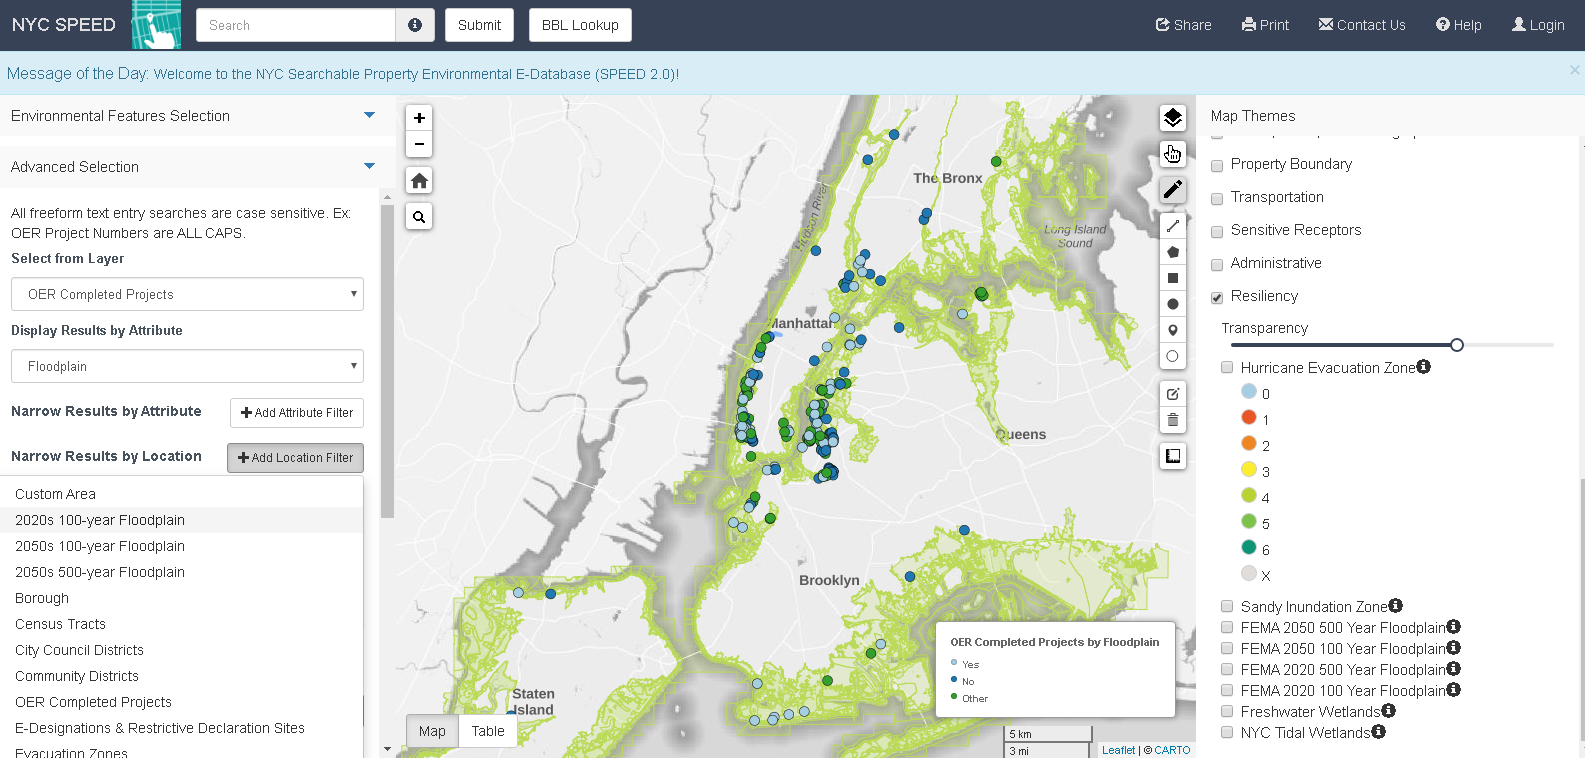
The application also includes advanced search functions. For example, in the left-hand column using the filter options, I was able to identify only those OER projects in FEMA 100-year floodplains. Query is rendered in the map viewer.

Carto software is helpful by providing a very modern user interface that generates layers which are compatible with Leaflet”, notes OER’s IT Director Maksim Kleban.  “It makes the transition from uploading our layers, and turning them into fully functional, interactive maps seamless.”  AppGeo proposed the use of CARTO to OER which has since found the software to be user friendly and simple to use with standalone online applications. Carto is licensed annually for the amount of space and resources needed for the SPEED application and works very similar to any other cloud solution, like Amazon Web Services, Microsoft Azure (AWS), or Google Cloud.

Currently there are about 50-55 datasets included in the SPEED viewer right now. The large majority are OER datasets which are updated automatically by syncing with data from external agencies’ datasets on Open Data, or from OER’s internal data sources.  Generally, they each have an independent update schedule which is also automated.   The data is managed mostly by automatic updates on OER’s server which communicates directly to Carto through an API. For layers which are not on an automatic update schedule, OER uses either a custom-designed interface or manually uploads data into Carto’s online platform.

User can search the SPEED database using a standardized address, common place names such as Bryant Park or Madison Square Garden (btw – even “MSG”!) or borough, block and lot (BBL) numbers.  The application also includes mark-up, feature transparency, and sharing tools,  great HELP documentation and easy access to metadata (as illustrated in the first image above) which is very helpful given the bevy of similar datasets from local, state and federal datasets accessible in the app.  Historical aerial photography from 1996, 1951, and 1924 enables users to identify previous land cover which can be an indicator of the presence of historic fill.  A “Sensitive Receptors layer includes the locations of facilities (schools, parks, libraries, health care, etc) where occupants are more susceptible to the effects of environmental contamination.

It continues to be a work in progress” says Ilan, “in the future we would like to also have functionalities for registered users. We also would like to add more analysis capabilities where new layers can be easily integrated with advanced search features”. 

SPEED 2.0 Featured on NYC Open Data Week

For the first time ever, OER participated in NYC Open Data Week in early March.  For those looking for a deeper dive into SPEED 2.0, use the link below to listen to Lee’s presentation.

Contact:

Ms. Lee Ilan
Chief of Planning
NYC Mayor’s Office of Environmental Remediation
lilan@cityhall.nyc.gov

Mobility for All Abilities Hackathon

While I personally did not attend the September 21st Mobility for All Abilities Hackathon at the  Brooklyn Army Terminal, I had originally intended to put together a short summary article to post on the day’s events and activities after gathering information from BetaNYC staff.  But instead, check out BetaNYC’s own detailed summary here – its quite good.

The event coincided with the 2019 National Day of Civic Hacking and was co-hosted by by BetaNYC and MakerSpace NYC which partnered with  NYC Department of Transportation, NYC Mayor’s Office of People with Disabilities, NYC Mayor’s Office of Data Analytics, and other organizations to setup eight challenges for a day-long map-a-thon and civic hacking to improve mobility equity in New York City.  Incredible results!

New York City Council Member Brad Lander provided opening remarks at the Mobility for All Abilities Hackathon. Photograph by Charlie Hartwell / CC BY

I’ve written about BetaNYC before and they have presented at the Westchester GIS User Group meeting in the past. They fill a much needed and recognized space in metro NYC towards facilitating these types of technology/geospatial events which can serve as a model for similar civic focused programs across the state.

For more information on their programs and activities, visit the BetaNYC website.


BetaNYC:  Championing the Open Data Cause

Background

In 2008, friends, hackers, open data/open government enthusiasts, and other professional acquaintances began to gather and discuss the state of open governance in New York City and created the NYC Open Government Meetup by Hailey Austin Cooperrider.   In 2009, this group was relaunched as the Open NY Forum under the leadership of Philip Ashlock, Cooperrider, and Noel Hidalgo.  Over the next 3-4 years, the group met periodically to discuss and push for an Open Data agenda in the city.

The movement and discussion on open data in the metropolitan region was augmented by ongoing work of Council Member Gale A. Brewer who at the time was Chair of NYC Council Committee on Technology in Government and was campaigning for an Open Data  statue for the City of New York. In June 2009 she hosted a public hearing on open data standards legislation.   Another public hearing was held in June 2010. The law has finally passed, and was signed into law by Mayor Bloomberg on March 7 2012. In 2013 and after New York State Governor Cuomo launched Open NY, the state’s Open Government initiative, the group renamed to BetaNYC.

In 2013 the BetaNYC community embarked on a five borough tour and authored The People Roadmap to a Digital New York City – and agenda setting publication identifying community values and 34 ideas for successive administrations and Council to work on. Since this this time, BetaNYC and the civic tech community have seen several policy and legislative victories — better Freedom of Information tools, NY City Record Law, expanded Mayor’s Office of Data Analytics (MODA), and the expansion of civic innovation challenges.

During the same time period, the City of New York partnered with Code for America to enlist a team of fellows to build technology to address criminal justice issues as well as initiating a search to hire a local community organizer.  Noel Hidalgo was hired to fill this position and bringing a broad understanding and connections with the open data/open government community across New York City as part of his involvement with betaNYC. It was at this time BetaNYC became Code for America’s official NYC brigade.

In 2015, BetaNYC became a “Partner Project” of the Fund for the City of New York (FCNY) continuing its mission to “improving lives in New York through civic design, technology, and data.”  A purpose which clearly augments the New York City Open Data program, though with a uniquely different and more clearly refined focus on community groups and city residents.  As FCNY had been one of the organizations supporting the City’s first data datalog,  being a Partner Project had enabled the city’s efforts towards open government and open data to come full circle.

With FCNY as fiscal sponsor and Noel being selected as a fellow at Data & Society, BetaNYC began work with the Civic Innovation Fellowship program out of the Manhattan Borough President’s Office. BetaNYC and the FCNY have continued the partner project relationship. As of April 2017, the Alfred P. Sloan Foundation has provided the funding for the Civic Innovation Fellowship program, and the FCNY continues to manage those funds.

BetaNYC Today

BetaNYC supports a broad range of programs focusing on geospatial-focused efforts in the city’s civic technology arena, open data, and community neighborhoods.  Of particular focus in their outreach and mission are the city’s community boards which are the appointed advisory groups of the community districts of the five boroughs. There are currently 59 community districts: twelve in Manhattan, twelve in the Bronx, eighteen in Brooklyn, fourteen in Queens, and threehttps://communityprofiles.planning.nyc.gov/ in Staten Island.
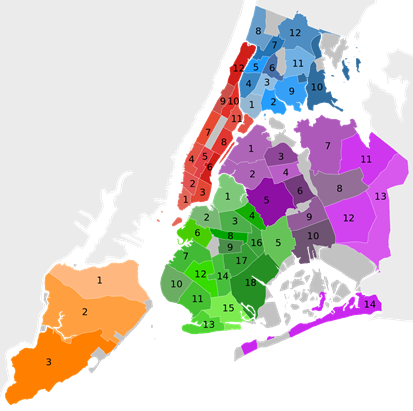
Manhattan’s 59 Community Districts covering the five boroughs

Data

At the core of BetaNYC’s offerings is its data portal which currently includes 130 datasets (BetaNYC sponsors 27) from 22 different organizations.  The interactive portal offers developers and individual users access to a wide range of data formats.  Illustrative of their work in advocating open data and access, BetaNYC sponsored its third NYC School of Data conference on March 3, 2018.  This community-driven conference included conversations, panels and workshops intended to empower community members to improve neighborhoods across the city.  The conference is framed to celebrate NYC’s transformative open data law and International Open Data Day, while kicking off NYC’s second annual open data week. Conference attendees are encourged to participate in #hackhall — a daylong open space for open source civic & government technology projects. In the #hackhall, attendees collaborate, connect to new libraries/projects, and improve open source projects.

BetaNYC’s data catalog is leveraged to support the development of apps, websites and visualizations.  Selected datasets are featured in media articles, news reports and blog posts across the region and are highlighted in the Showcases collection on their website.

Programs and Activities

Community Boards

As the result of a three year partnership with the Manhattan Borough President’s Office, BetaNYC designed tools and customized trainings specifically intended to help Community Boards access, analyze, map and use data to inform decision-making. The workshop introduces the easy-to-use BoardStat tool to query NYC 311 – service requests and explore trends in health, safety and quality of life concerns.  BoardStat is designed for community. Not only does BoardStat empower a community board staff and its members to gain timely insights, it is furthering the Manhattan Borough President’s long-standing goal of making government transparent and responsive, reactive, and moving beyond open data access to meaningful use.  BetaNYC’s most recent event in this space was March 5th.  Examples of documents and materials used as part of this BetaNYC training session are available in this Google Drive shared folder.
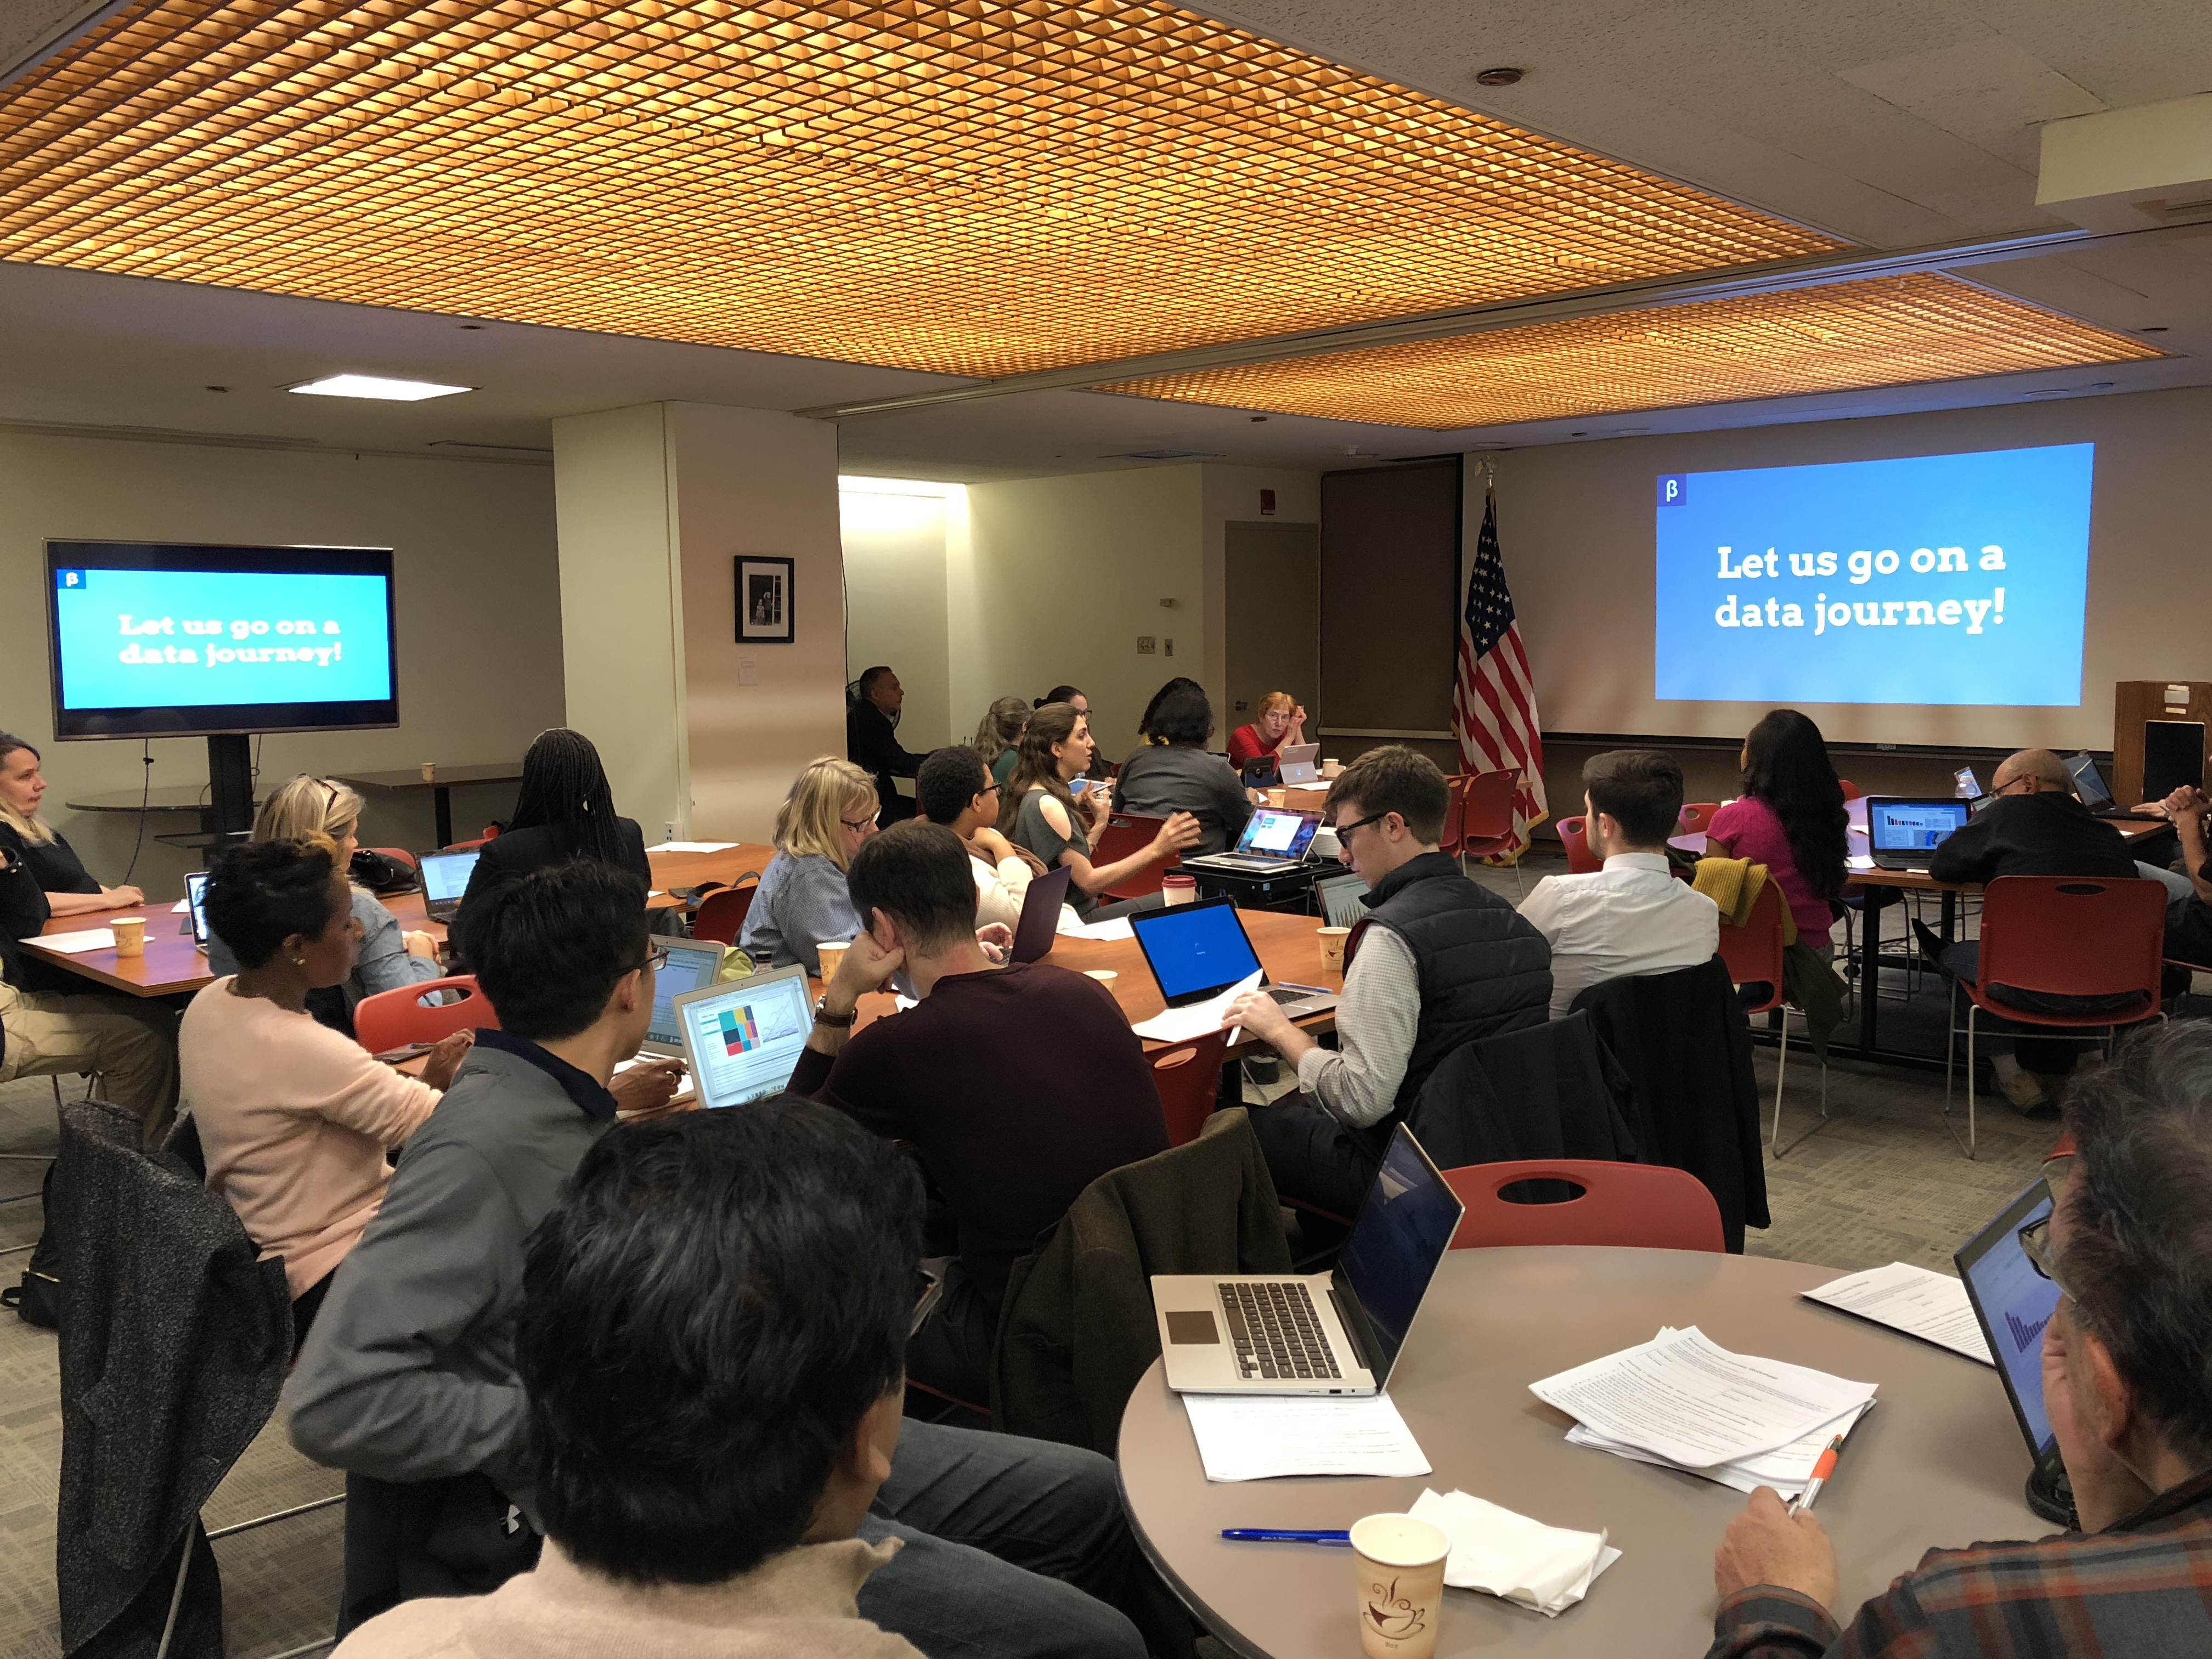
Attendees at BetaNYC’s School of Data March 5th focusing on NYC Community Boards

#BetaTALK – Affordable Housing: Data, Policy, People

In July 2016 BetaNYC hosted a lunchtime discussion at Civic Hall centering on the topic of affordable housing in New York City.  The event was to share knowledge about this extremely important and complex topic focusing on a wide range of housing-related topics (and data) including, but not limited to, rent-stabilization, New York City Housing Authority and Section 8 voucher statistics, proposed building plans and Landmark Laws, and NYC government datasets such as Pluto, ACRIS, Department of Buildings, and the Dept. of Housing Preservation and Development as well as the American Community Survey among others.   Other BetaTalks are available for viewing on YouTube.

BetaNYC is committed to continue the conversation and help the Civic tech community grow ideas, analyses, and projects on this topic by building more accountability, clearer, and up-to-date information on rents across the City at a highly localized level, since differences can be stark between blocks, buildings, professional even within buildings.

Testimony & Advocacy

On behalf of BetaNYC, Executive Director Noel Hidalgo frequently provides expert testimony to the New York City administration and legislature on a wide range of open data/open source, new technologies, and government transparency issues.  BetaNYC has been instrumental in Over the past 18 months, illustrative efforts in this context include presentations on the Automated Decision Systems Local Law 49, testimony on both the Open Data Examination and Verification Report, and Intro 1696-2017 (Open Algorithms Bill).  

Data Jams

Data Jams are occasional BetaNYC “hands-on” events focusing accessing and interpreting  specific NYC government program datasets. Recent Data Jams have centered on program data from NYC311, NYC Dept. of Planning, and NYC Parks.  

NYC School of Data

Held in conjunction with NYC Open Data Week (March 3-10, 2018), BetaNYC’s School of Data is a community conference showcasing NYC’s civic design, civic/government technology, and open data ecosystem. It seeks to build a framework of relationships that can demystify data and technology, foster democracy, build cross-borough relationships, and mentor a new generation of civic leaders. 2018 topics focused on four key areas: digital literacy & privacy, smart & wise cities, effective & open government, and lastly, civic

Summary

BetaNYC continues to champion the open data and government transparency intersection in New York City.  Best illustrating how grassroots efforts can have significant and game changing impacts on public policy in the new technologies realm.  For the taxpayers and by the taxpayers.

Their broad catalog of programs and activities offers many opportunities for involvement much of which is centered around their long-standing and highly visible BetaNYC Meetup platform. And by extension, collaboration with several other Meetups (GeoNYC, New York Tech, Civic Hall) Code for America, Coalition for Queens, Dev Bootcamp, OpenPlans, Silicon Harlem, NYC Digital, NYC Mayor’s Office of Data Analytics, NYC Mayor’s Office of Technology and Innovation, NYC’s Department of Information Technology and Telecommunications, and NYC 311 has broadened its footprint as well.  While this critical mass of geospatial infrastructure, to say the least of visible and strategic political support, has contributed to the development of BetaNYC’s success and unique position on the Manhattan geospatial landscape, it can serve as a model to other metropolitan areas across the Empire State in establishing frameworks for similar open data and civic technology causes.

We are pleased to have BetaNYC on our agenda for this year’s Westchester GIS User Group Meeting May 17th at Purchase College.  We anticipate considerable discussion and attendee involvement focusing on open data and government transparency as part of our  “GIS for “Resiliency and Sustainability” theme.  The BetaNYC community is encouraged to attend.

For more information, BetaNYC contact Noel Hidalgo and Emily Goldman or visit the betaNYC website.