While in and out of Albany for nearly 34 years as part of public service, I’ve been on and around the Empire State Plaza probably close to 100 times, if not more. At the western end of the plaza is the Cultural Education Center (CEC) which operates under the auspices of the State Education Department. The CEC houses the State Museum, State Library, and the State Archives. Back in the day, when the State Archives was known as the State Archives and Records Adminstration (SARA), the statewide GIS community had a much closer association with the CEC when SARA was an early source of funding for GIS implementation and hardcopy conversion grants. Over the years, these GIS centric funding sources, which are still administered through the LOCAL GOVERNMENT RECORDS MANAGEMENT IMPROVEMENT FUND (LGRMIF) have become much more limited as program criteria and focus has changed significantly. More recently, it was a discussion with Susan Winchell-Sweeney in the Anthropology Department at the State Museum which became the genesis of this article learning more about the expanding use of geospatial technologies in different program areas within the Museum. (Note: As part of this article, certain maps, due primarily to size, are available via Google Drive. These documents are referenced in the appropriate location in the article and can be accessed via a hyperlink.)
New York State Geological Survey (NYSGS)
From its beginning in 1836, the New York State Museum has been home to some of the nation’s leading scientists, including pioneers in archaeology, paleontology, ethnology, and botany. Its collections now rank among the finest in many fields and total more than sixteen million specimens, objects, and artifacts. A long time contributor to statewide mapping, the State Museum is home to the New York Geological Survey (NYSGS) which produces GIS datasets and map & charts products. The Survey has a broad mission of geologic research, investigation, and mapping across the Empire State and is committed to making the resulting geologic knowledge of their work readily and publically available.
First introduced in 1960, the Maps & Charts series combines large format graphics with associated text with emphasis on the graphic in lieu of descriptive text. The primary purpose of the series is to document surface and subsurface geologic data that are difficult to present in other formats. Many geologic maps are published in this series. Since 2006 geologic mapping at the New York State Museum has benefitted from cooperative federal partnerships mainly through the U.S Geological Survey. Traditional geologic mapping has been enhanced by technological developments such high resolution LIDAR terrain models. Many products contain both a surface map of geologic formations and materials as well as subsurface geologic cross sections. NYSGS also maintains a limited number of GIS datasets (shapefiles) which can be found on their website including Bedrock and Surficial geology, statewide Physiographic Provinces map, and Brittle Structures of New York.
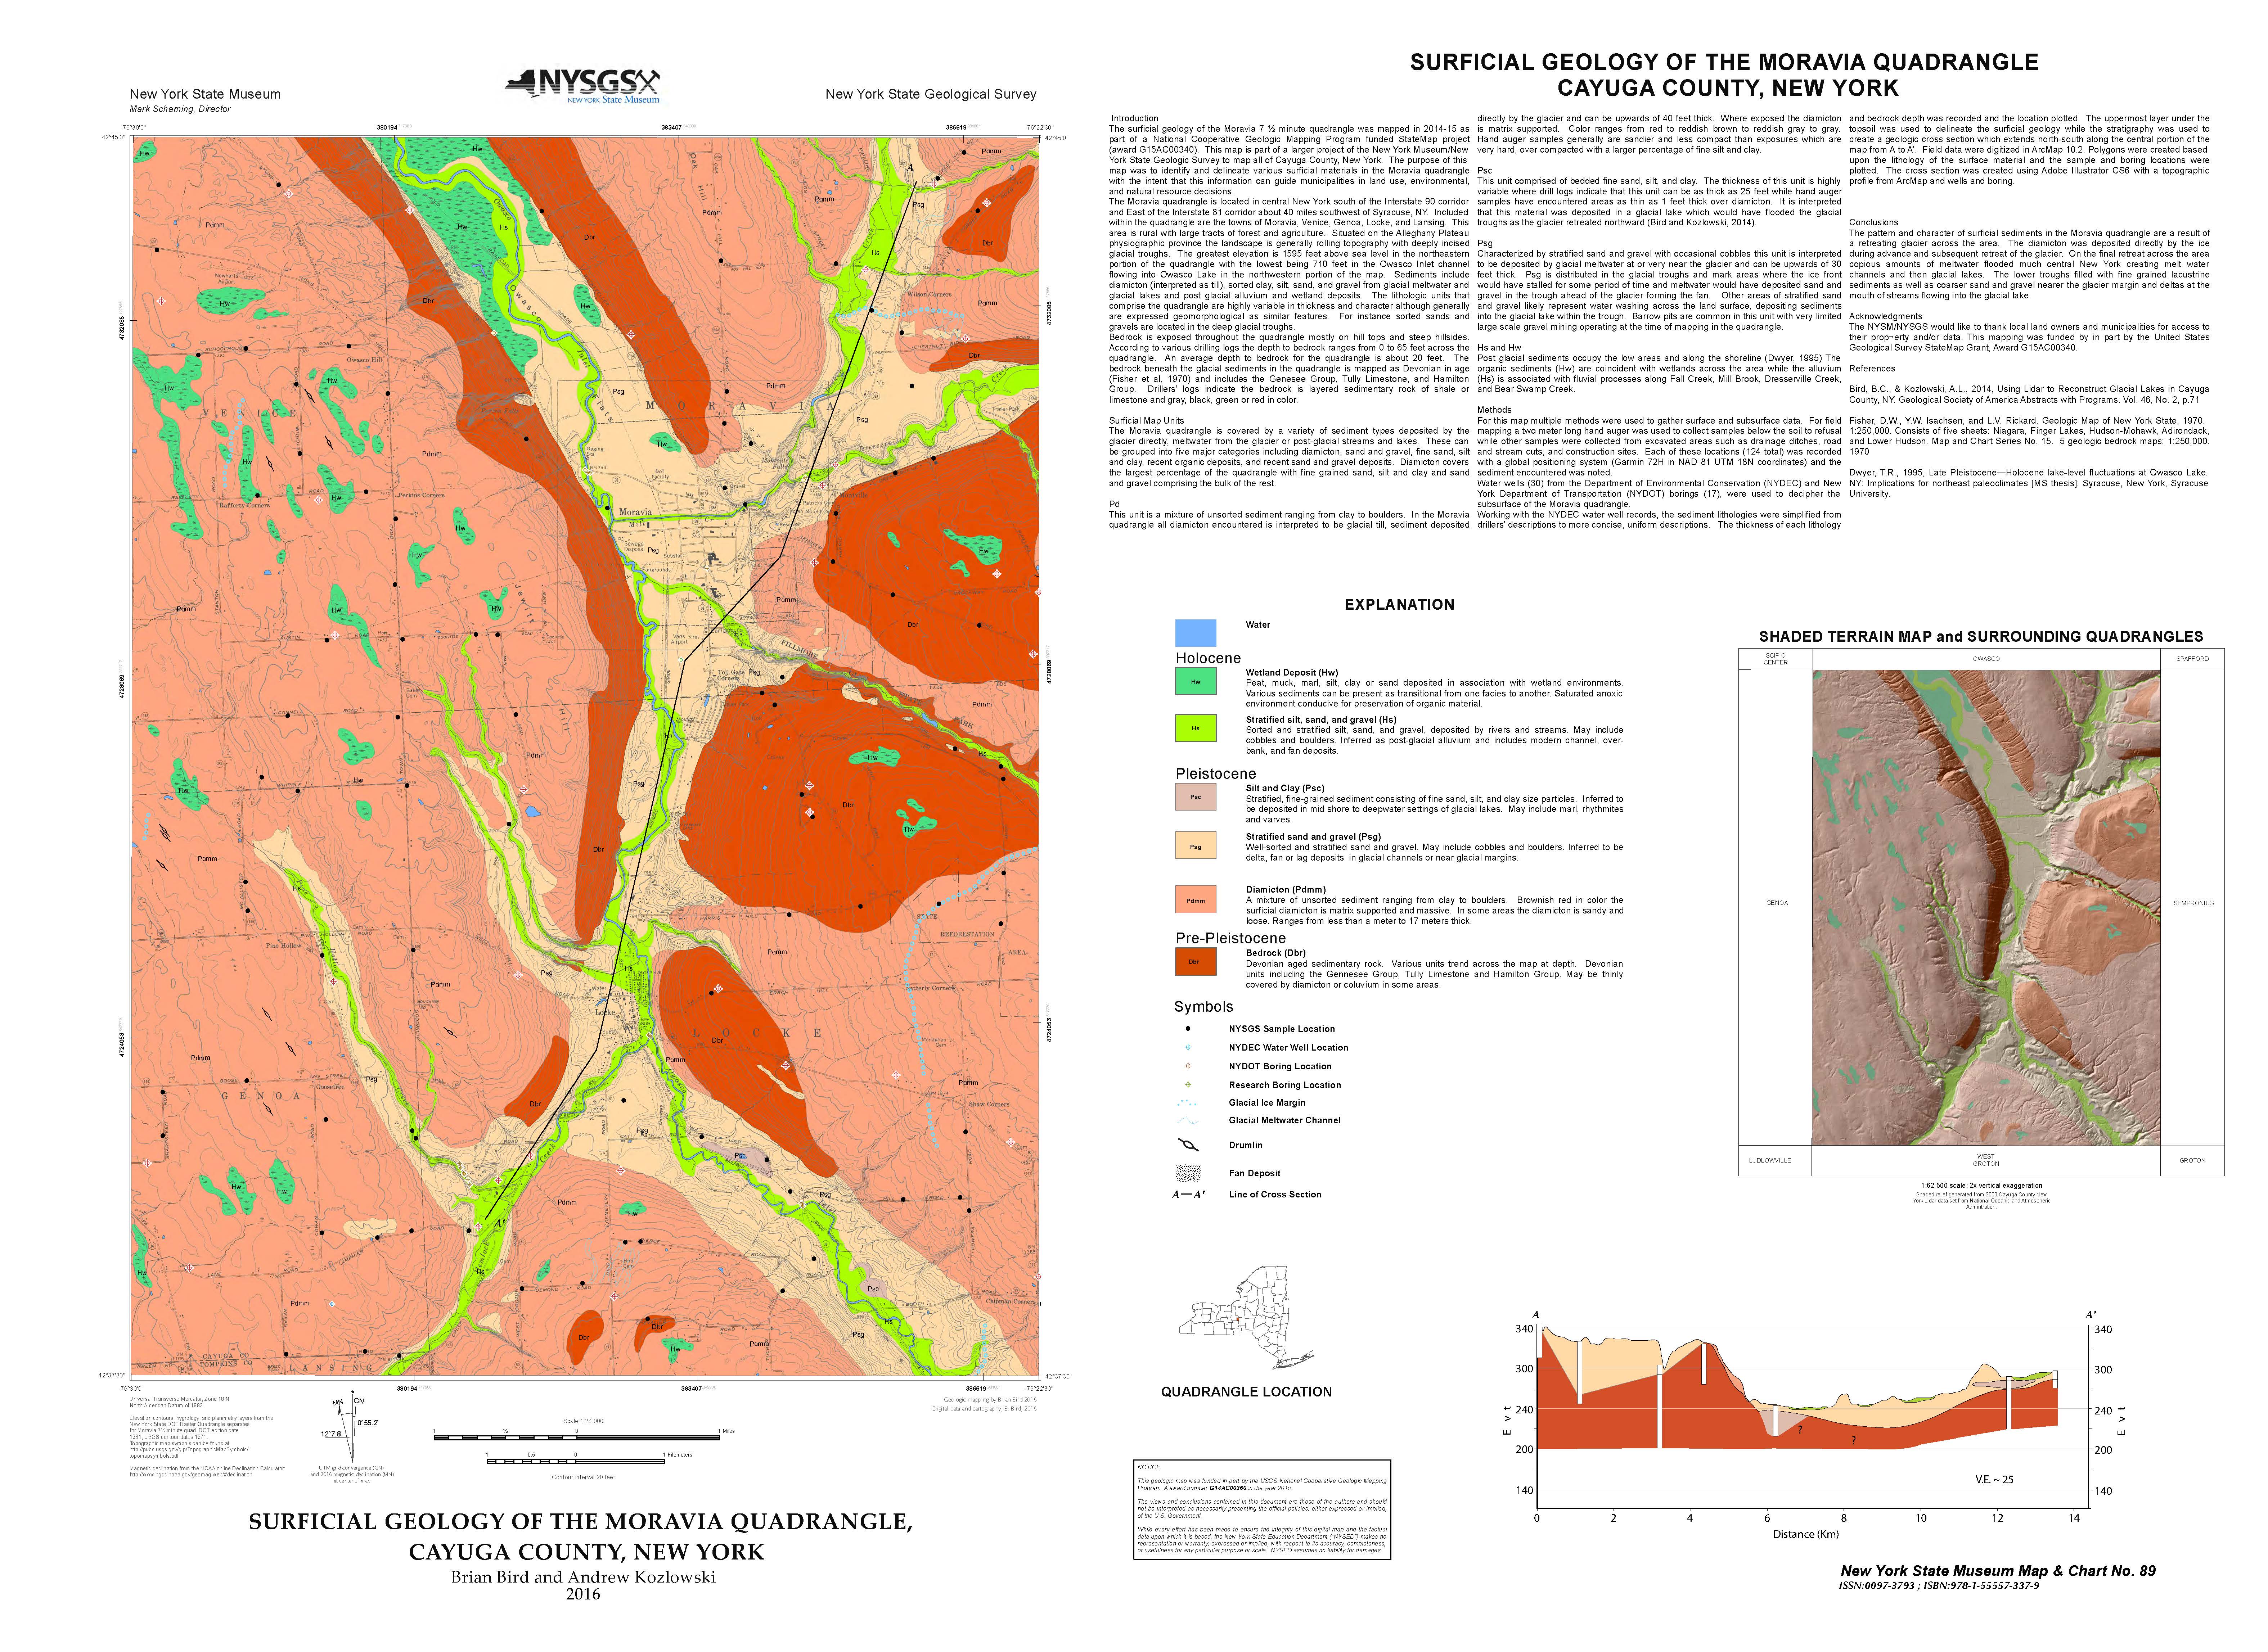
Illustrative of the many outstanding hard copy map products available from NYSGS, this Moravia Quadrangle surficial geology update documents existing environmental and landscape conditions, as well as field data collection efforts in producing the map. Great content for an online StoryMap! (Google Drive: #1MoraviaQuad)
Using AutoCAD
One of the more interesting elements of my interviews and discussion with Museum staff as part of this article was learning how CADD (yes, as in Computer Aided Design and Drafting) is used among professional staff. While the GIS community routinely recognizes and acknowledges the contribution of CAD community in the broad geospatial effort, its use on a day-to-day use is often innocuous. All the more interesting a find on the desktop in the State Museum.
In this user space at the Museum is Heather Clark, who is a drafter and Principal Investigator with the Cultural Resource Survey Progarm (CRSP). She works extensively with AutoCAD as part of aiding interpretations at archeological sites. And it should come as no surprise that much of her work – and the CRSP program as a whole – comes from conducting archeological and historical district studies as part of New York State Dept. of Transportation projects. Though she also works on projects with Dept. of Conservation, Office of General Services, Dept. of Corrections, and Canal Corps.
Heather focuses on making project maps for archaeological crews to take out in the field prior to digging a project. Sometimes the maps include DOT provided georeferenced base maps or AutoCAD generated files. She’ll also often make maps from scratch from “heads-up” digitizing from orthophotos. Project principal investigators provide pertinent information regarding testing locations and site information (both historic and prehistoric archaeological sites) from the field work which she adds to the maps for their final reports. She also makes thematic maps (soil maps, density maps, contour maps) depending on the principal investigator’s needs, as well as maps for architectural historians identifying historical districts and National Register Eligible structures. Recently CRSP staff have been doing a more thorough geophysical survey using both Ground Penetrating Radar (GPR) and Magnetic Susceptibility Meter instruments. (As part of this article I was able to share with CRPS staff how the AutoCAD client is capable of consuming map services. Many of the planimetric features Heather uses in creating map products for field crews – at least within the Westchester County footprint – are made available in map services published by Westchester County GIS.)
Heather started working at the Museum in 2005. She received her Bachelors and Masters Degrees in Anthropology at the University at Albany and recently completed a graduate certificate in Geospatial Intelligence at Penn State. CRSP staff often have the opportunity to engage in independent research. In this regard, Heather notes “My work here at the Museum has developed from my love of New York State history, particularly domestic sites and activity from colonization to the early historic period. Additionally, I am interested in the faunal analysis of archaeological sites as a tool to learn about food consumption practices and site use.” Heather can be reached at heather.clark@nysed.gov.
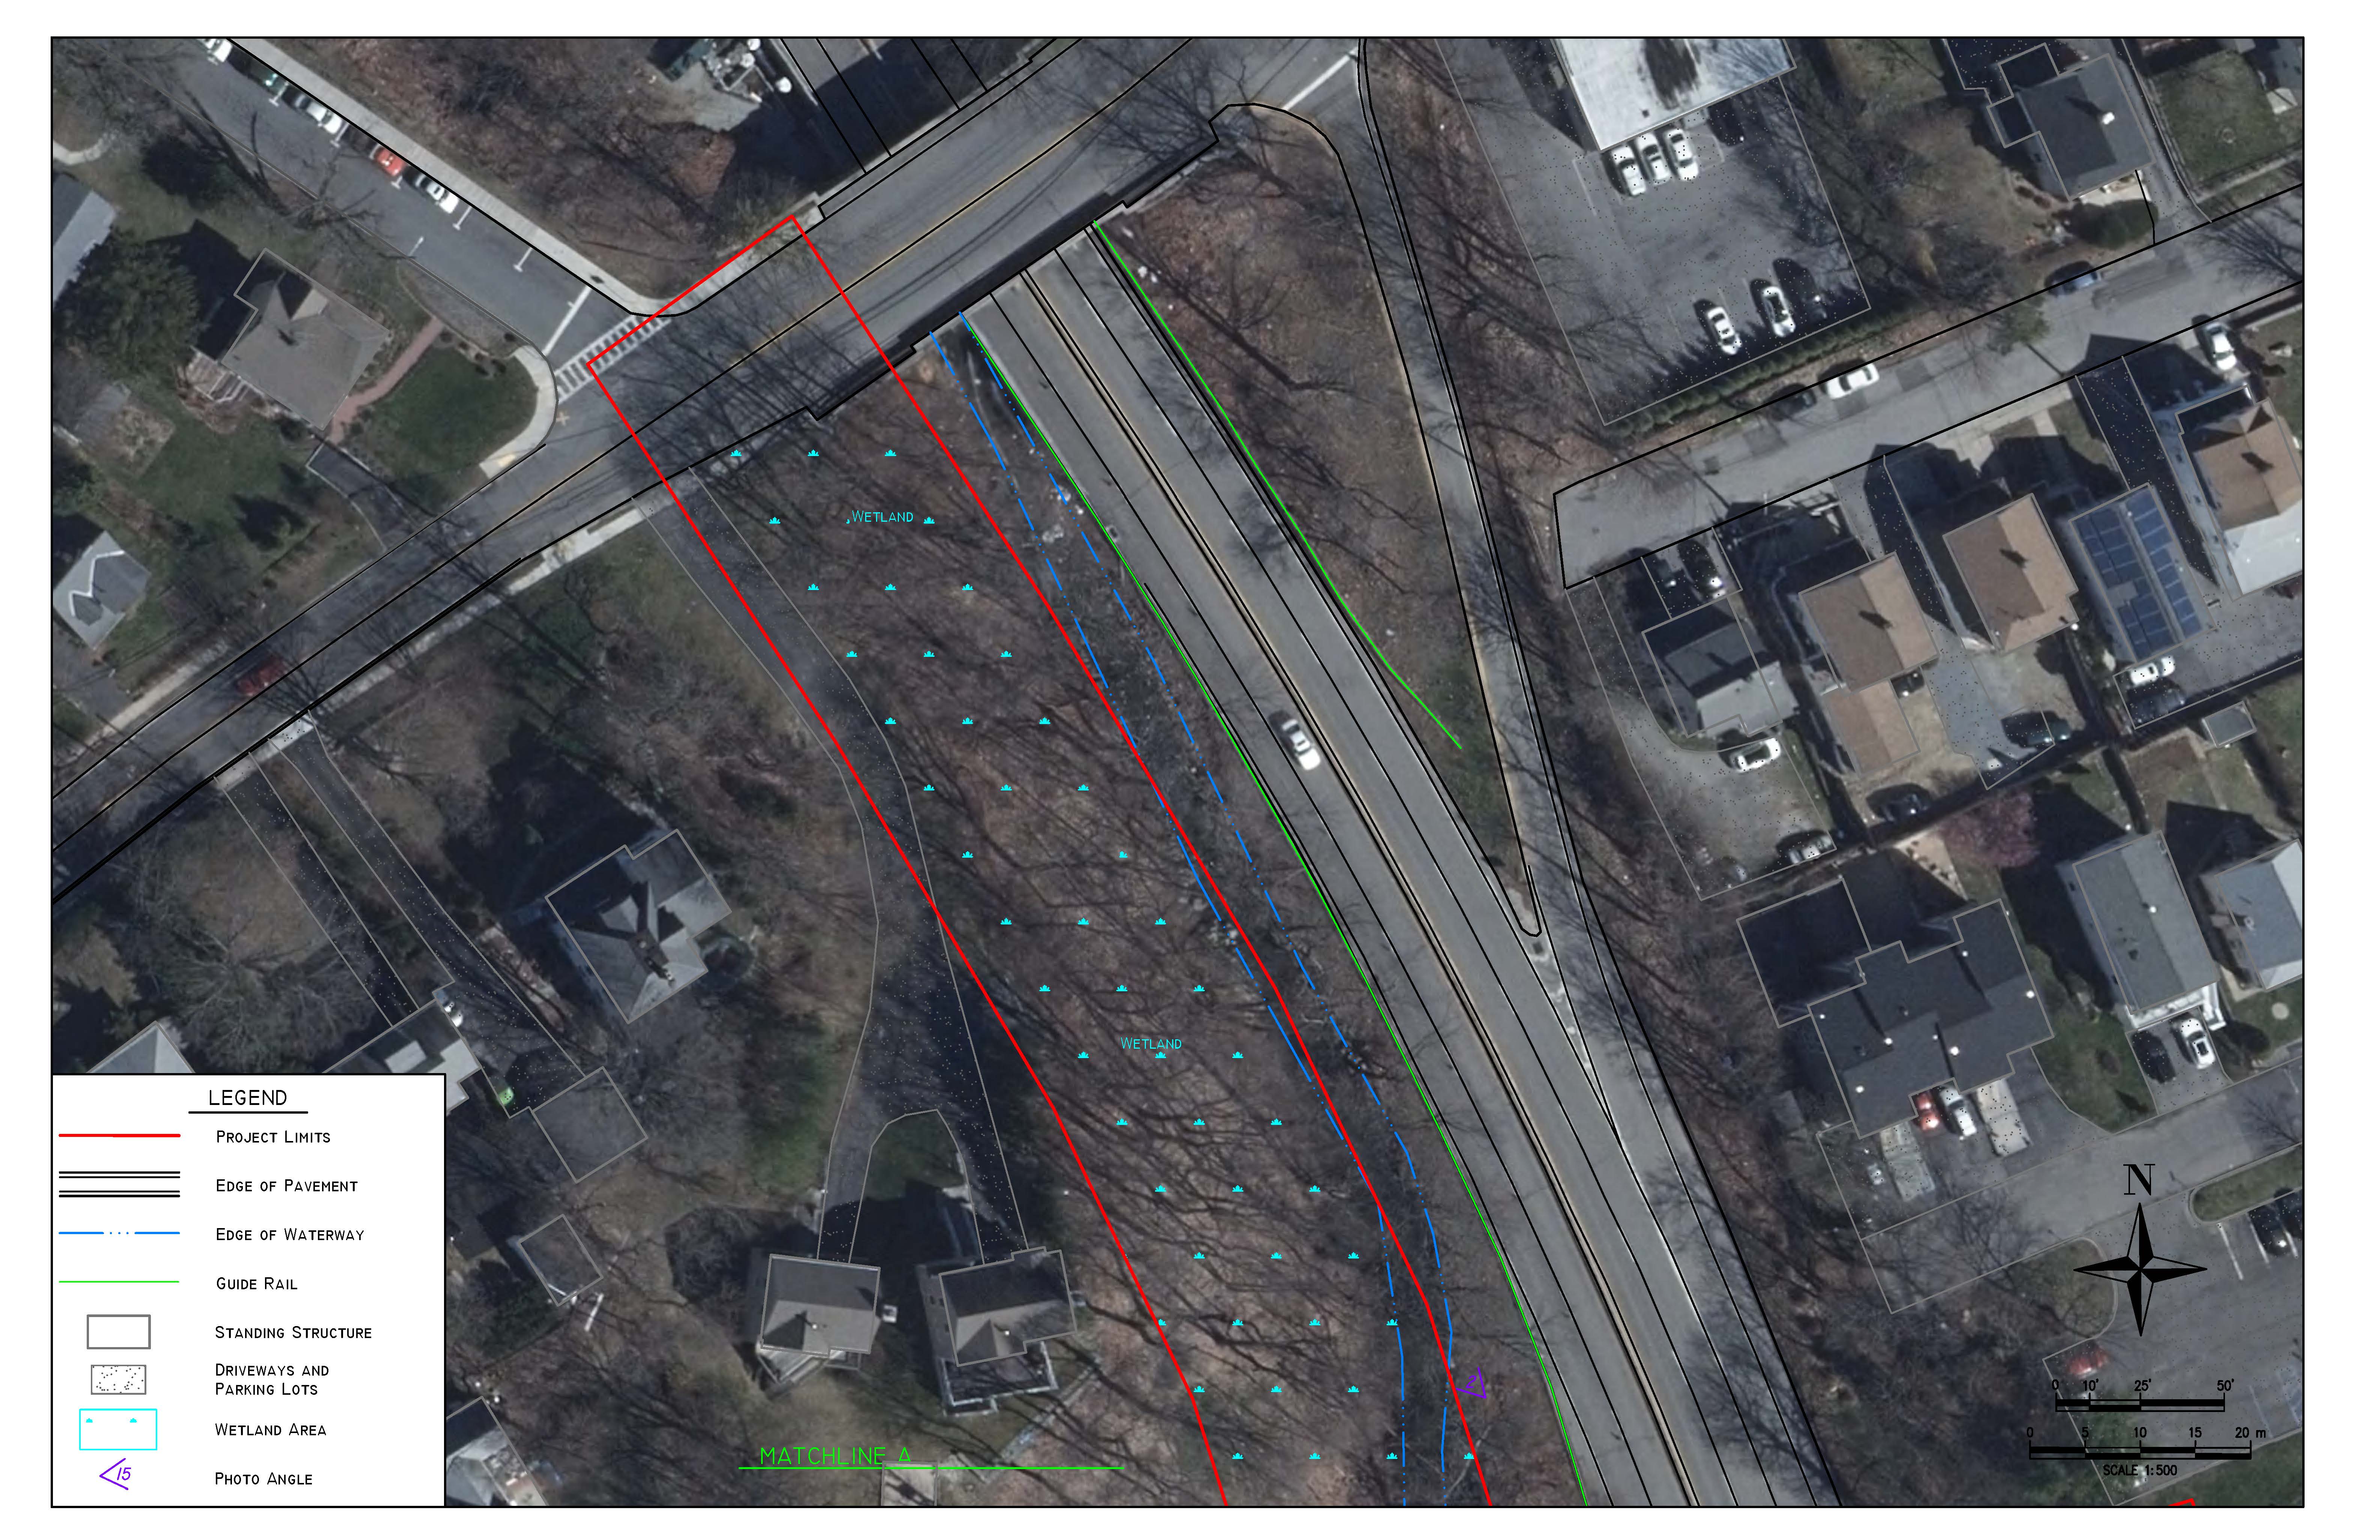
AutoCAD generated file highlighting project limits, waterways, edge of pavement, guard rails, wetland areas and other features.
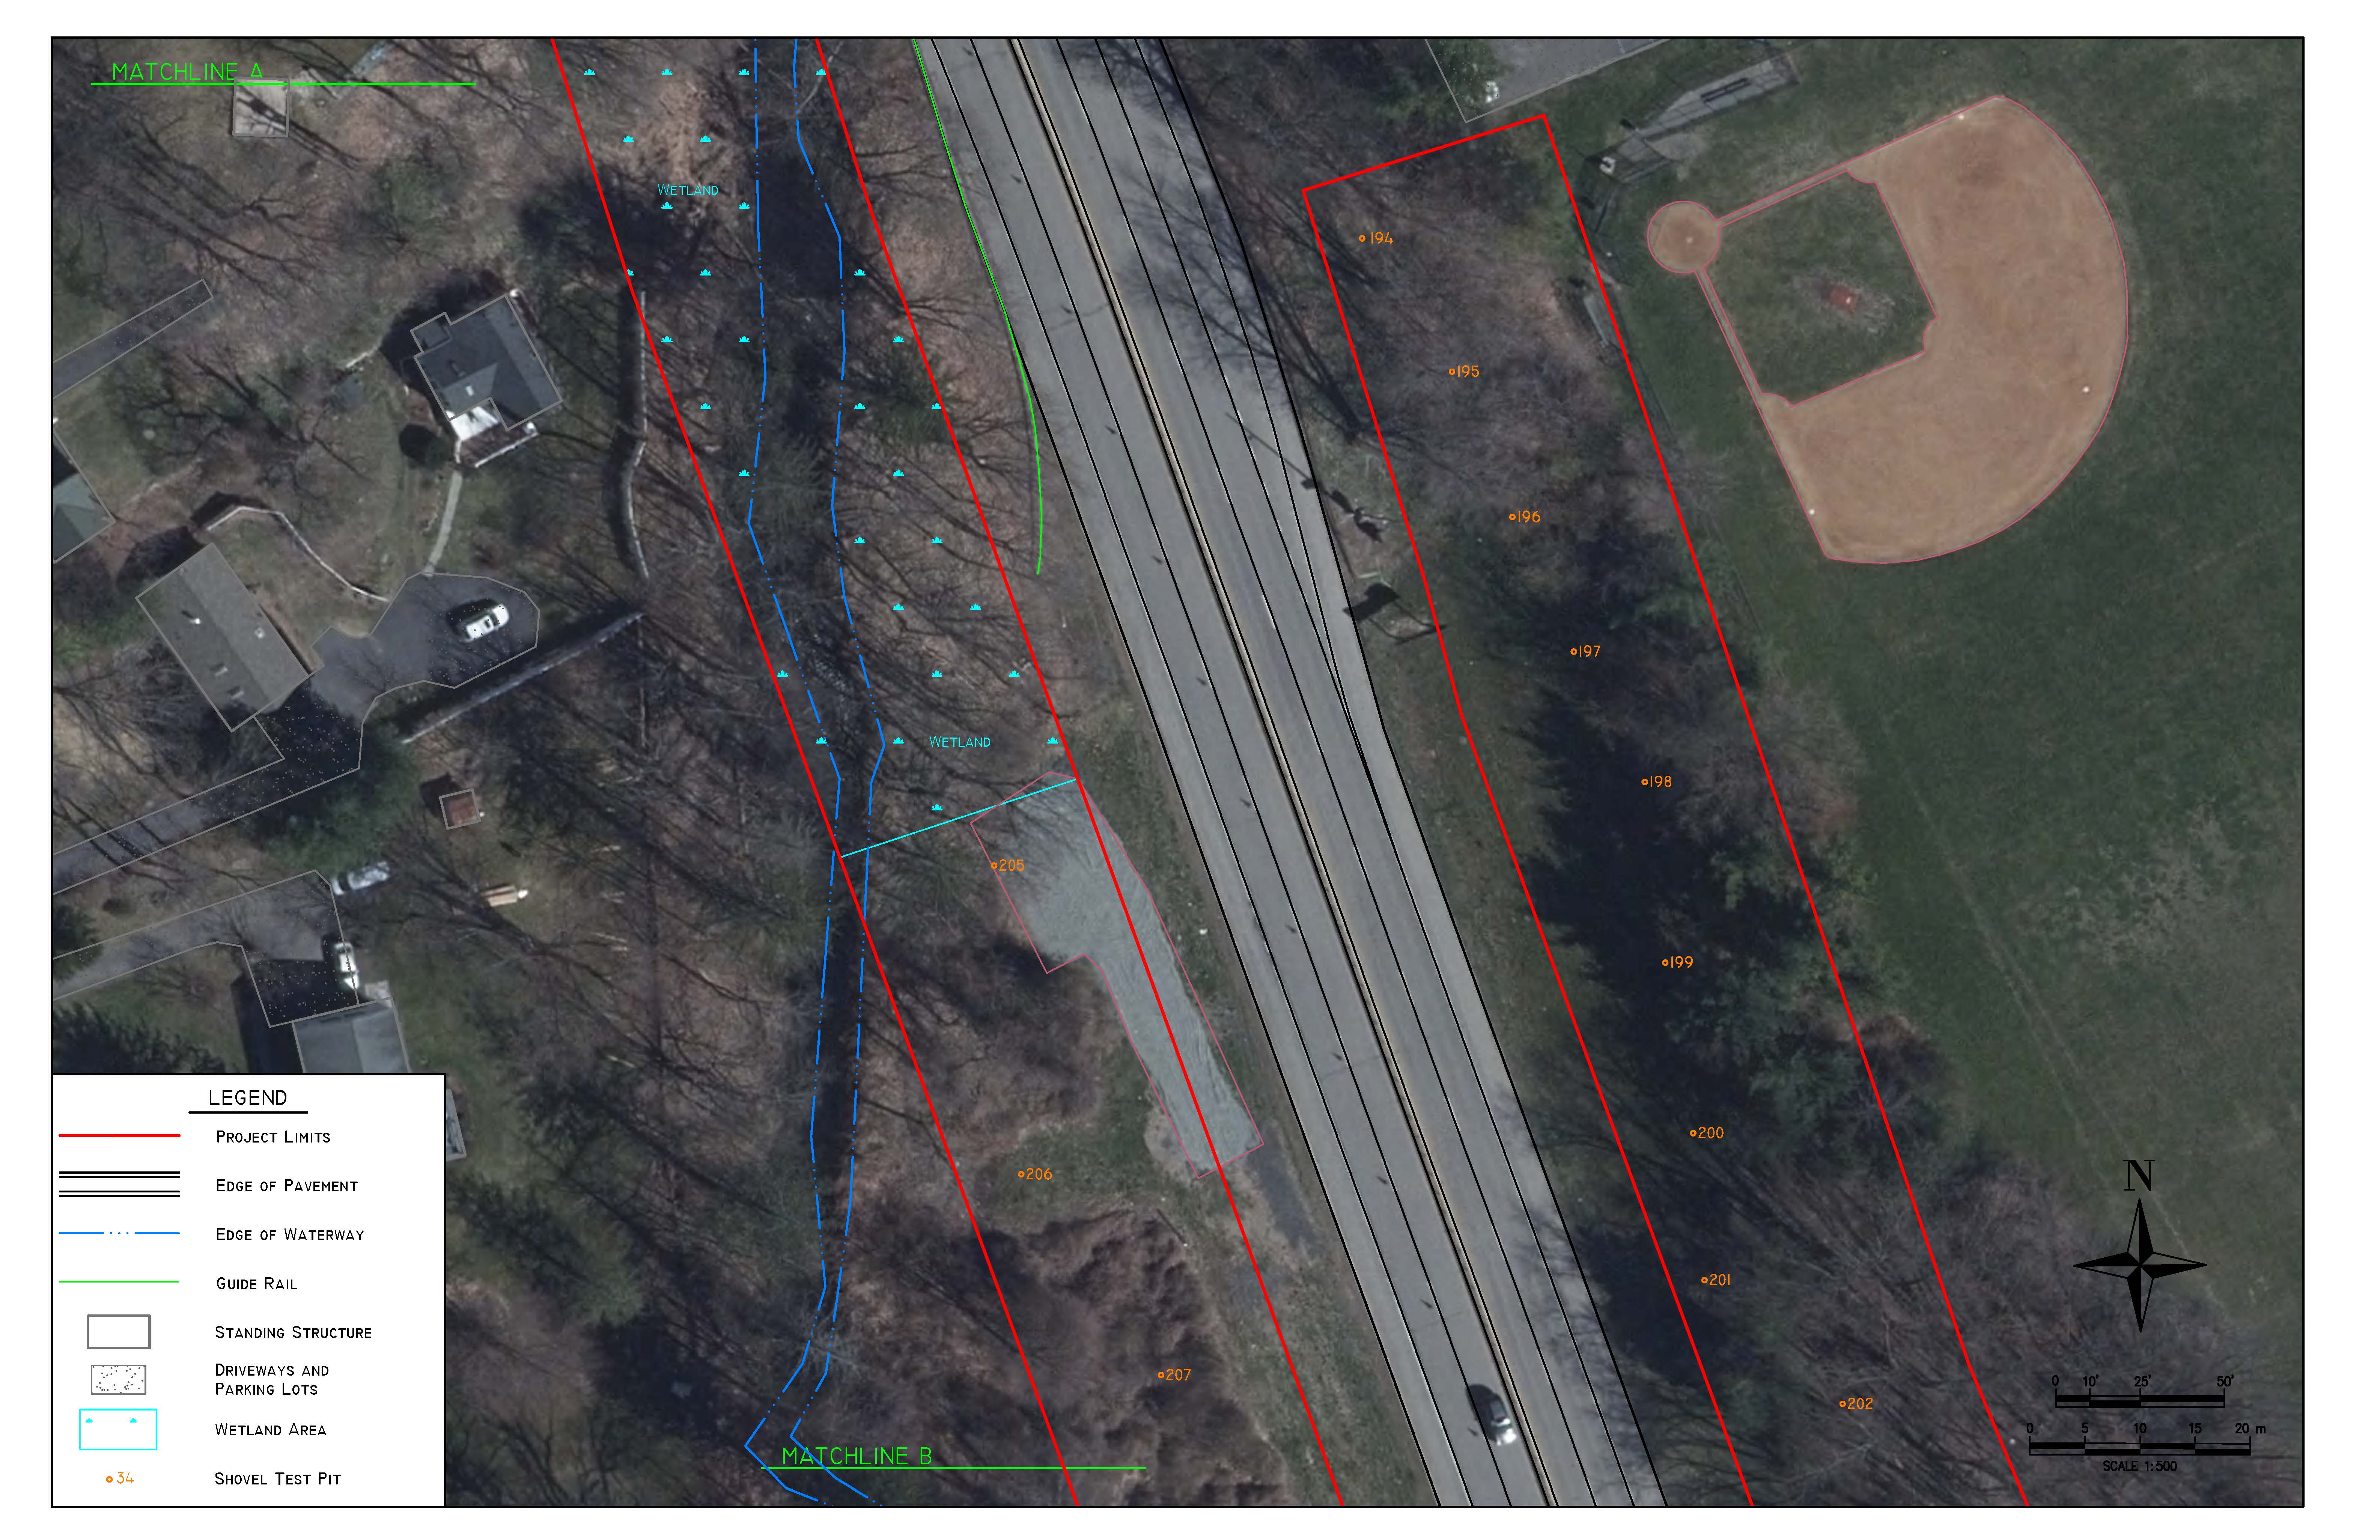
In the same project area, to determine if there may be an archaeologically significant sites, CRSP staff systematically tests the area with circular 40 cm round pits to identify soils and associative artifacts for each soil stratum (orange annotation.)
Archaeology Projects
Archaeology is concerned with the spatial relationships of materials and features, and the recording and visualizing of these finds and their locations is an important aspect of the archaeological process. In curatorial research conducted by the Anthropology Department, geographic information systems and mapping techniques are utilized during the various phases of excavation and analysis. Instrumental in expanding the use of geospatial technology in the Anthropology Department has been Historical Archaeological Technician, Susan Winchell-Sweeney.
Prior to her work with the Museum, Susan, who has a BS degree in Archaeology and Soil Science and a professional certification in GIS (GISP), worked in several archaeology and GIS capacities at Bard College. She also collaborated with the State Museum’s archaeological staff on a research project in the Southern Adirondacks and did an undergraduate internship in the 1990s learning how to use ArcINFO on a Unix Workstation making surficial and bedrock maps under the direction of Dave Gerhard.
Upon her arrival at the Museum as a full-time employee in 2007, Susan began using ArcMap GIS software in the management of the South Street Seaport Museum historical archaeological collection. This collection from New York City resulted from some of the largest professionally conducted urban excavations in North America. Spanning over 300 years of Manhattan history, the two million artifacts constitute the greatest extant collection of archaeological materials from 17th-century Dutch New Amsterdam and includes remains from 18th-century English Colonial and early 19th-century American Republic periods as well. Now under the stewardship of the New York State Museum in Albany, the collection is undergoing extensive processing so that it may be utilized for archaeological and historical research. While this preparation is underway (a task likely to take more than ten years to complete), GIS aids in inventory management, and provides context for the original buried artifact sites. An exhibit mounted in 2009 entitled, “Where Did They Come From, and Where Are They Now? The Artifacts of the South Street Seaport Museum,” highlighted this use, and originated as a poster presented at the 2007 NYS GIS conference in Albany. (Google Drive: #2SouthStreetSeaport)
Other representative geospatial efforts by Susan as part of her work with archaeological efforts at the Museum include:
Deuel Family Cemetery
Washington County, New York
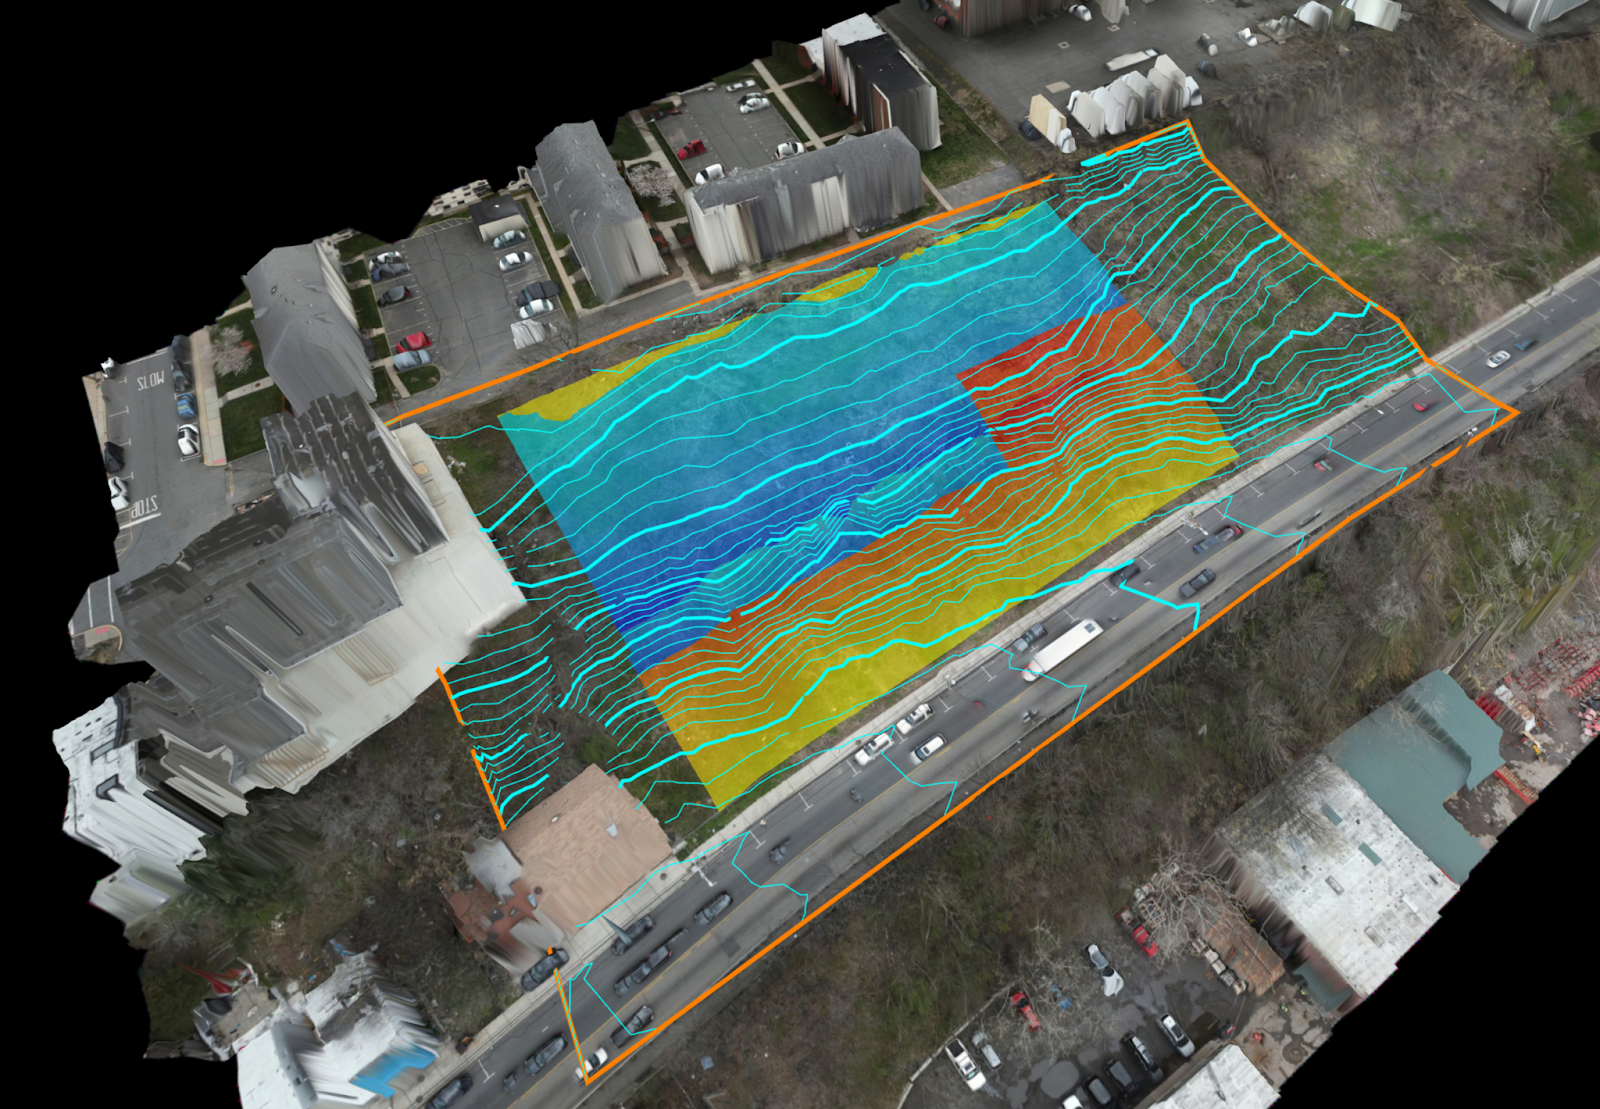
Both CRSP and Anthropology staff initiated a geophysical survey at the Deuel Family Cemetery under the direction of the bioarchaeologist, Lisa Anderson. She was contacted after the accidental discovery of skeleton remains from an unmapped historic cemetery, and asked to determine if other unmarked graves might exist. As part of this work, both GPR and MS technologies were deployed. Magnetic susceptibility (MS) is another geophysical technique becoming increasing more popular for archaeological investigations in the US (it’s been around for quite a while in Europe). In very simple terms, an MS meter measures how “magnetizable” soil is, which can be a marker of past human activity. The anomalies seen in the project map (the darkest areas) are likely grave shaft locations consistent with less compacted soil, organic material, and perhaps iron coffin hardware which could account for higher MS readings. Because different geophysical techniques measure different properties, it is often useful to use more than one on an archaeological site. The green circles on this map indicate areas where both MS and ground-penetrating radar (GPR) identified anomalies. The MS survey interval necessary to pick up something the size of an historic grave shaft requires taking a reading every 25 cm, along transects only half a meter apart which is extremely time-consuming. At this project site, Museum staff had only two days to collect data. (Google Drive: #3DeuelFamilyCemetery)
The Hurley Site
Esopus River Valley, New York
This project was created to support the research of Dr. John Hart, which focuses “primarily on the histories of maize, bean, and squash in New York and the greater Northeast and the interactions of human populations with these crops.” His work has essentially pushed back the dates of the beginning of agriculture in the Northeast (a sometimes hotly debated topic in archaeology). The Hurley site, located in the Esopus Creek valley of eastern New York, was excavated in the 1950s and 60s. The collection is now curated by the New York State Museum. The GIS map and database were produced from hand-drawn, decades-old field notes (Susan digitized the pits and features; Dr. Hart created a spreadsheet with over twenty fields defining pit characteristics – this was then joined to the digitized features, allowing for a myriad of queries and visual representations.) (Google Drive: #4HurleySite
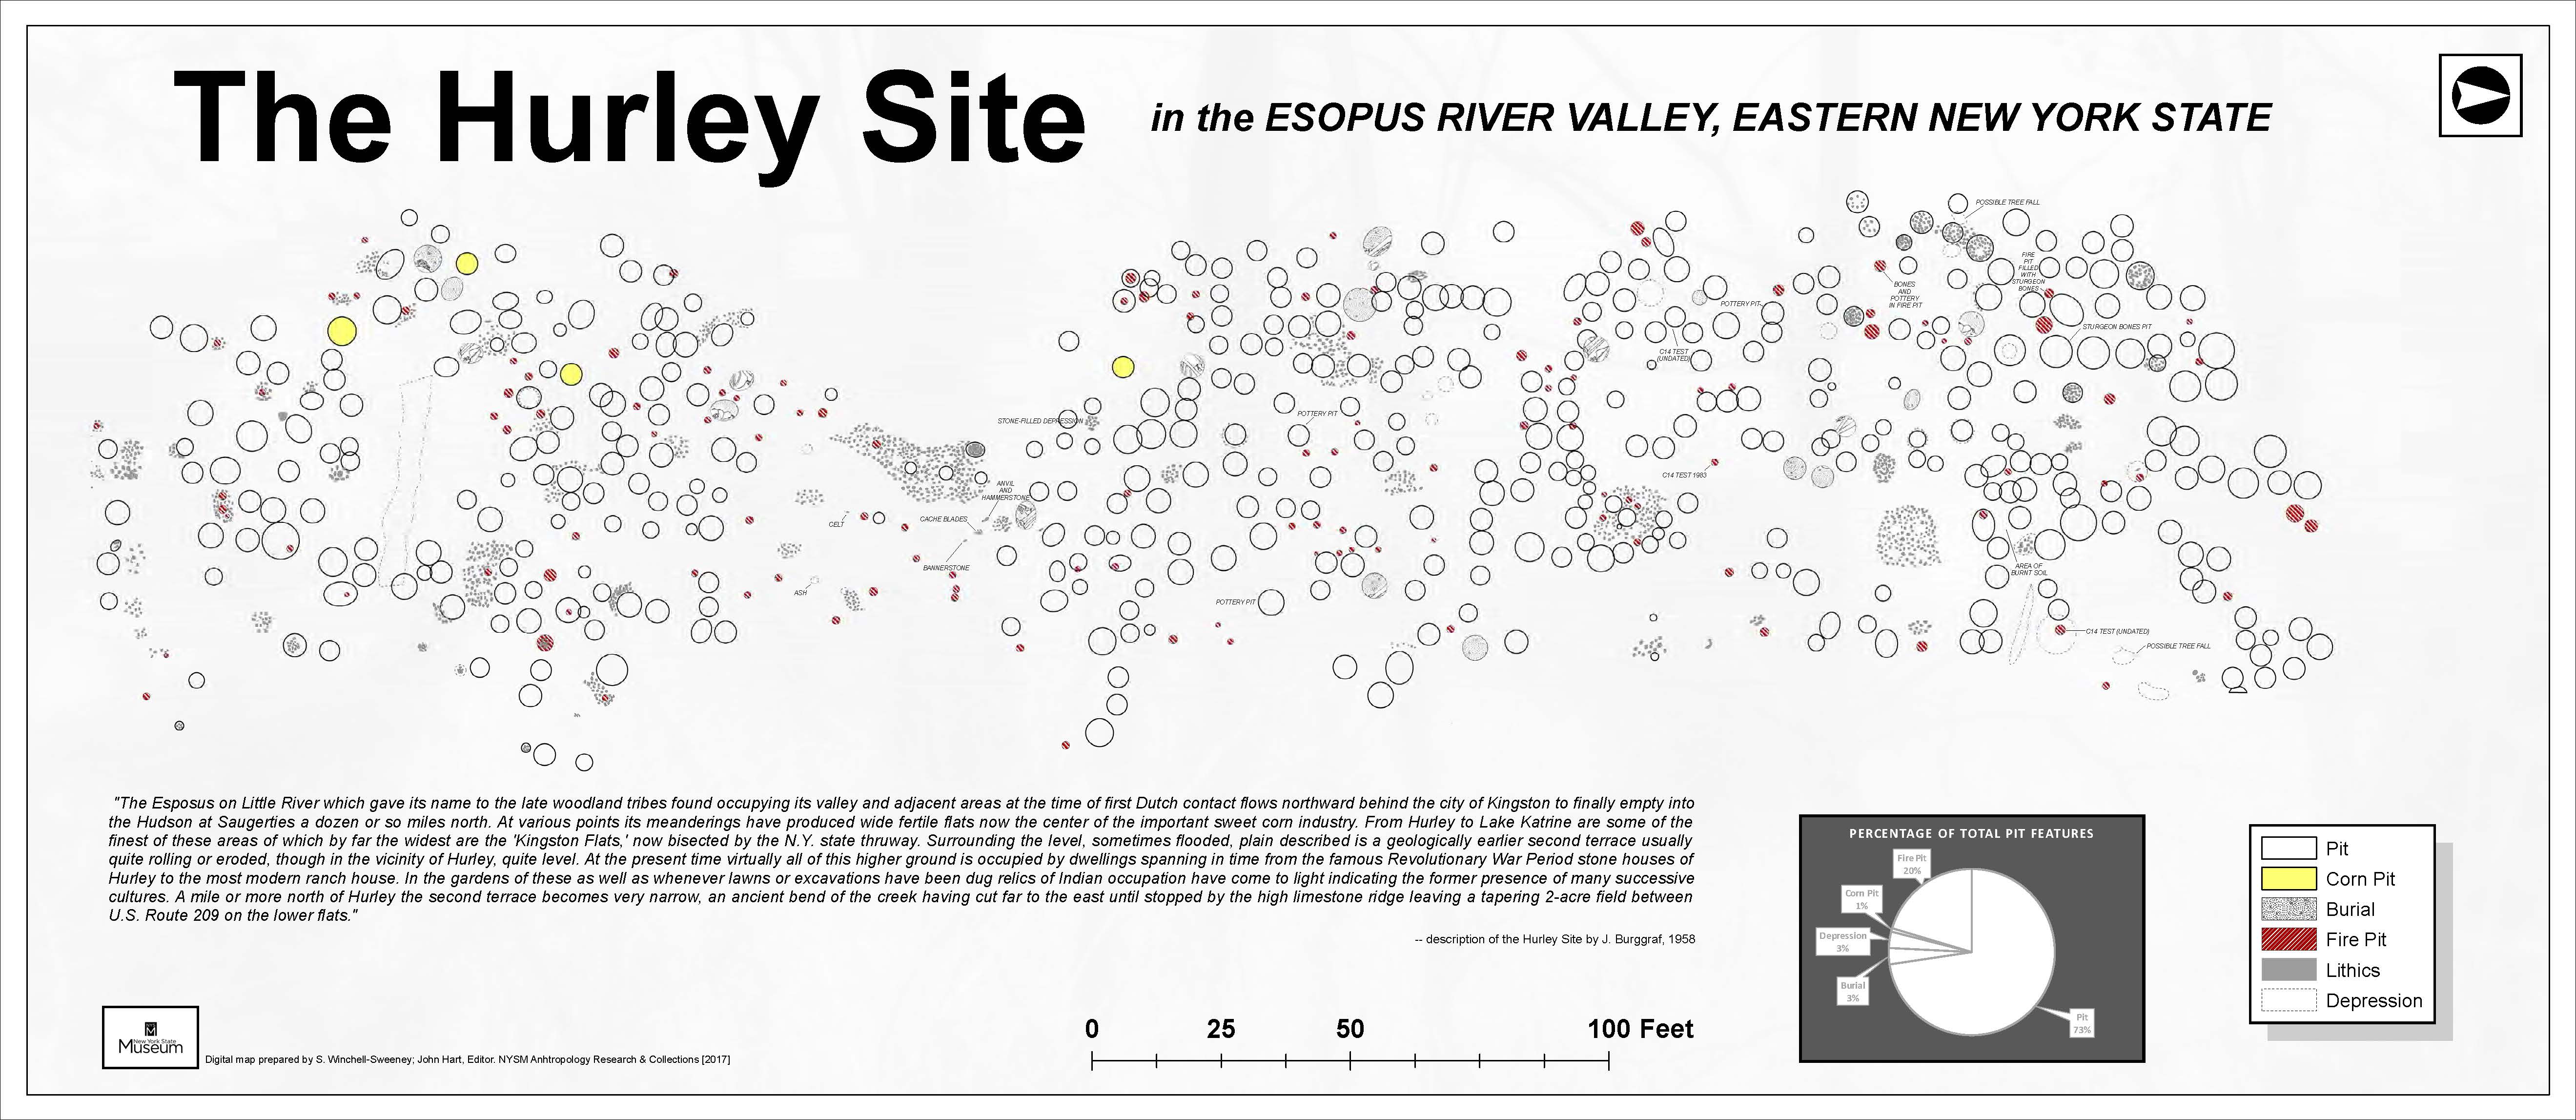
Evidence from the Hurley site including 439 deep pits, some with massive deposits of maize kernels, and human dental pathologies suggest that maize-based agriculture was a significant component of early subsistence systems. The Hurley site adds to the State’s understanding of the diversity of subsistence practices in historical Algonquian territories prior to European incursions.
Van Schaick Mansion Cemetery
Cohoes, New York
In 2016, the New York State Museum in collaboration with the Horsley Archeological Prospection completed a Ground Pentrating Radar survey of the Van Schaick Mansion Cemetery to determine if unmarked graves could be identified. Commissioned by The Chapter House for Gen. Peter Gansevoort Chapter of the Daughters of the American Revolution (who own the property) final interpretation and survey results shown in this map were completed in early 2017. This a multi-year project looking at a wide range of historical items and trends at the property. (Google Drive: #5VanSchaickCemetery)
GIS Analysis to Model Paleoindian Pathways
Northeastern United States
Finally, in collaboration with University of Montreal researchers and curator of archaeology, Dr. Jonathan Lothrop, Susan’s 2017 NYS GeoCon poster highlighted the use of GIS software in calculating the estimated Least Cost Path (LCP) of Paleoindian Pathways throughout the Northeast in search of and harvesting Normanskill chert as part of toolstone acquisition. This is an awesome hardcopy cartographic product. (Google Drive: #6NYS2017GeoCon)
Contact Susan @ susan.winchell-sweeney@nysed.gov for more information on the use of geospatial technology in archaeology at the State Museum.
Uses of Lidar
Advancements and use of lidar technology is having a profound impact on mapping and research by scientists in the Museum. Bare earth models allow staff to visualize the landscape in unprecedented resolution and provide the ability to identify previously unrecognized glacial landforms which is useful in both surficial and bedrock mapping as well as for archeological exploration. Early elevation models were constructed from grids that used 30 meter by 30 meter cells and then later models used 10 meter by 10 meter cells. In comparison state of the art LIDAR produces much finer resolution grid cells. Such resolution enables researchers to target certain glacial landforms or specific archeological sites for further investigation.
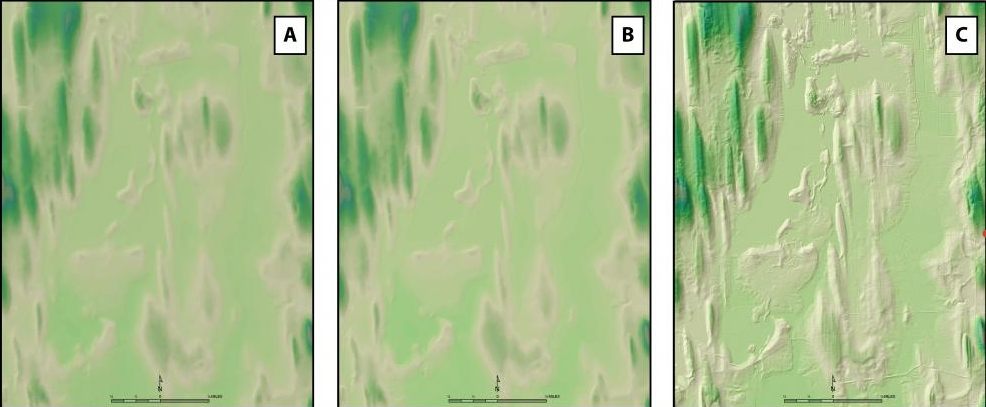
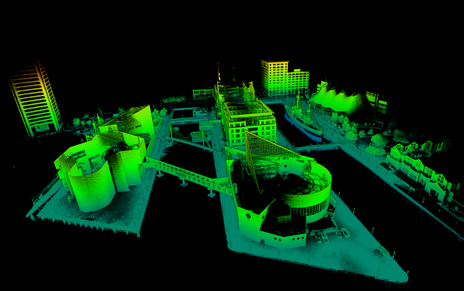
Examples of bare earth comparisons between LIDAR images at A) 30M, B) 10M, and C) 2M resolution.
Lidar is also useful for museum archaeologists who are sometimes called upon to investigate “discoveries” of historic sites by well-meaning members of the public By example, there was a request by a local conservation group in the Catskills to answer a question about “monumental and extraordinary stone structures built by an ancient race for ceremonial purposes – celestial alignment, etc.”. And having access to good lidar data for the particular area in question helped staff to determine that the features in fact were ordinary stone walls marking property boundaries – older yes, but not ancient or mysterious.
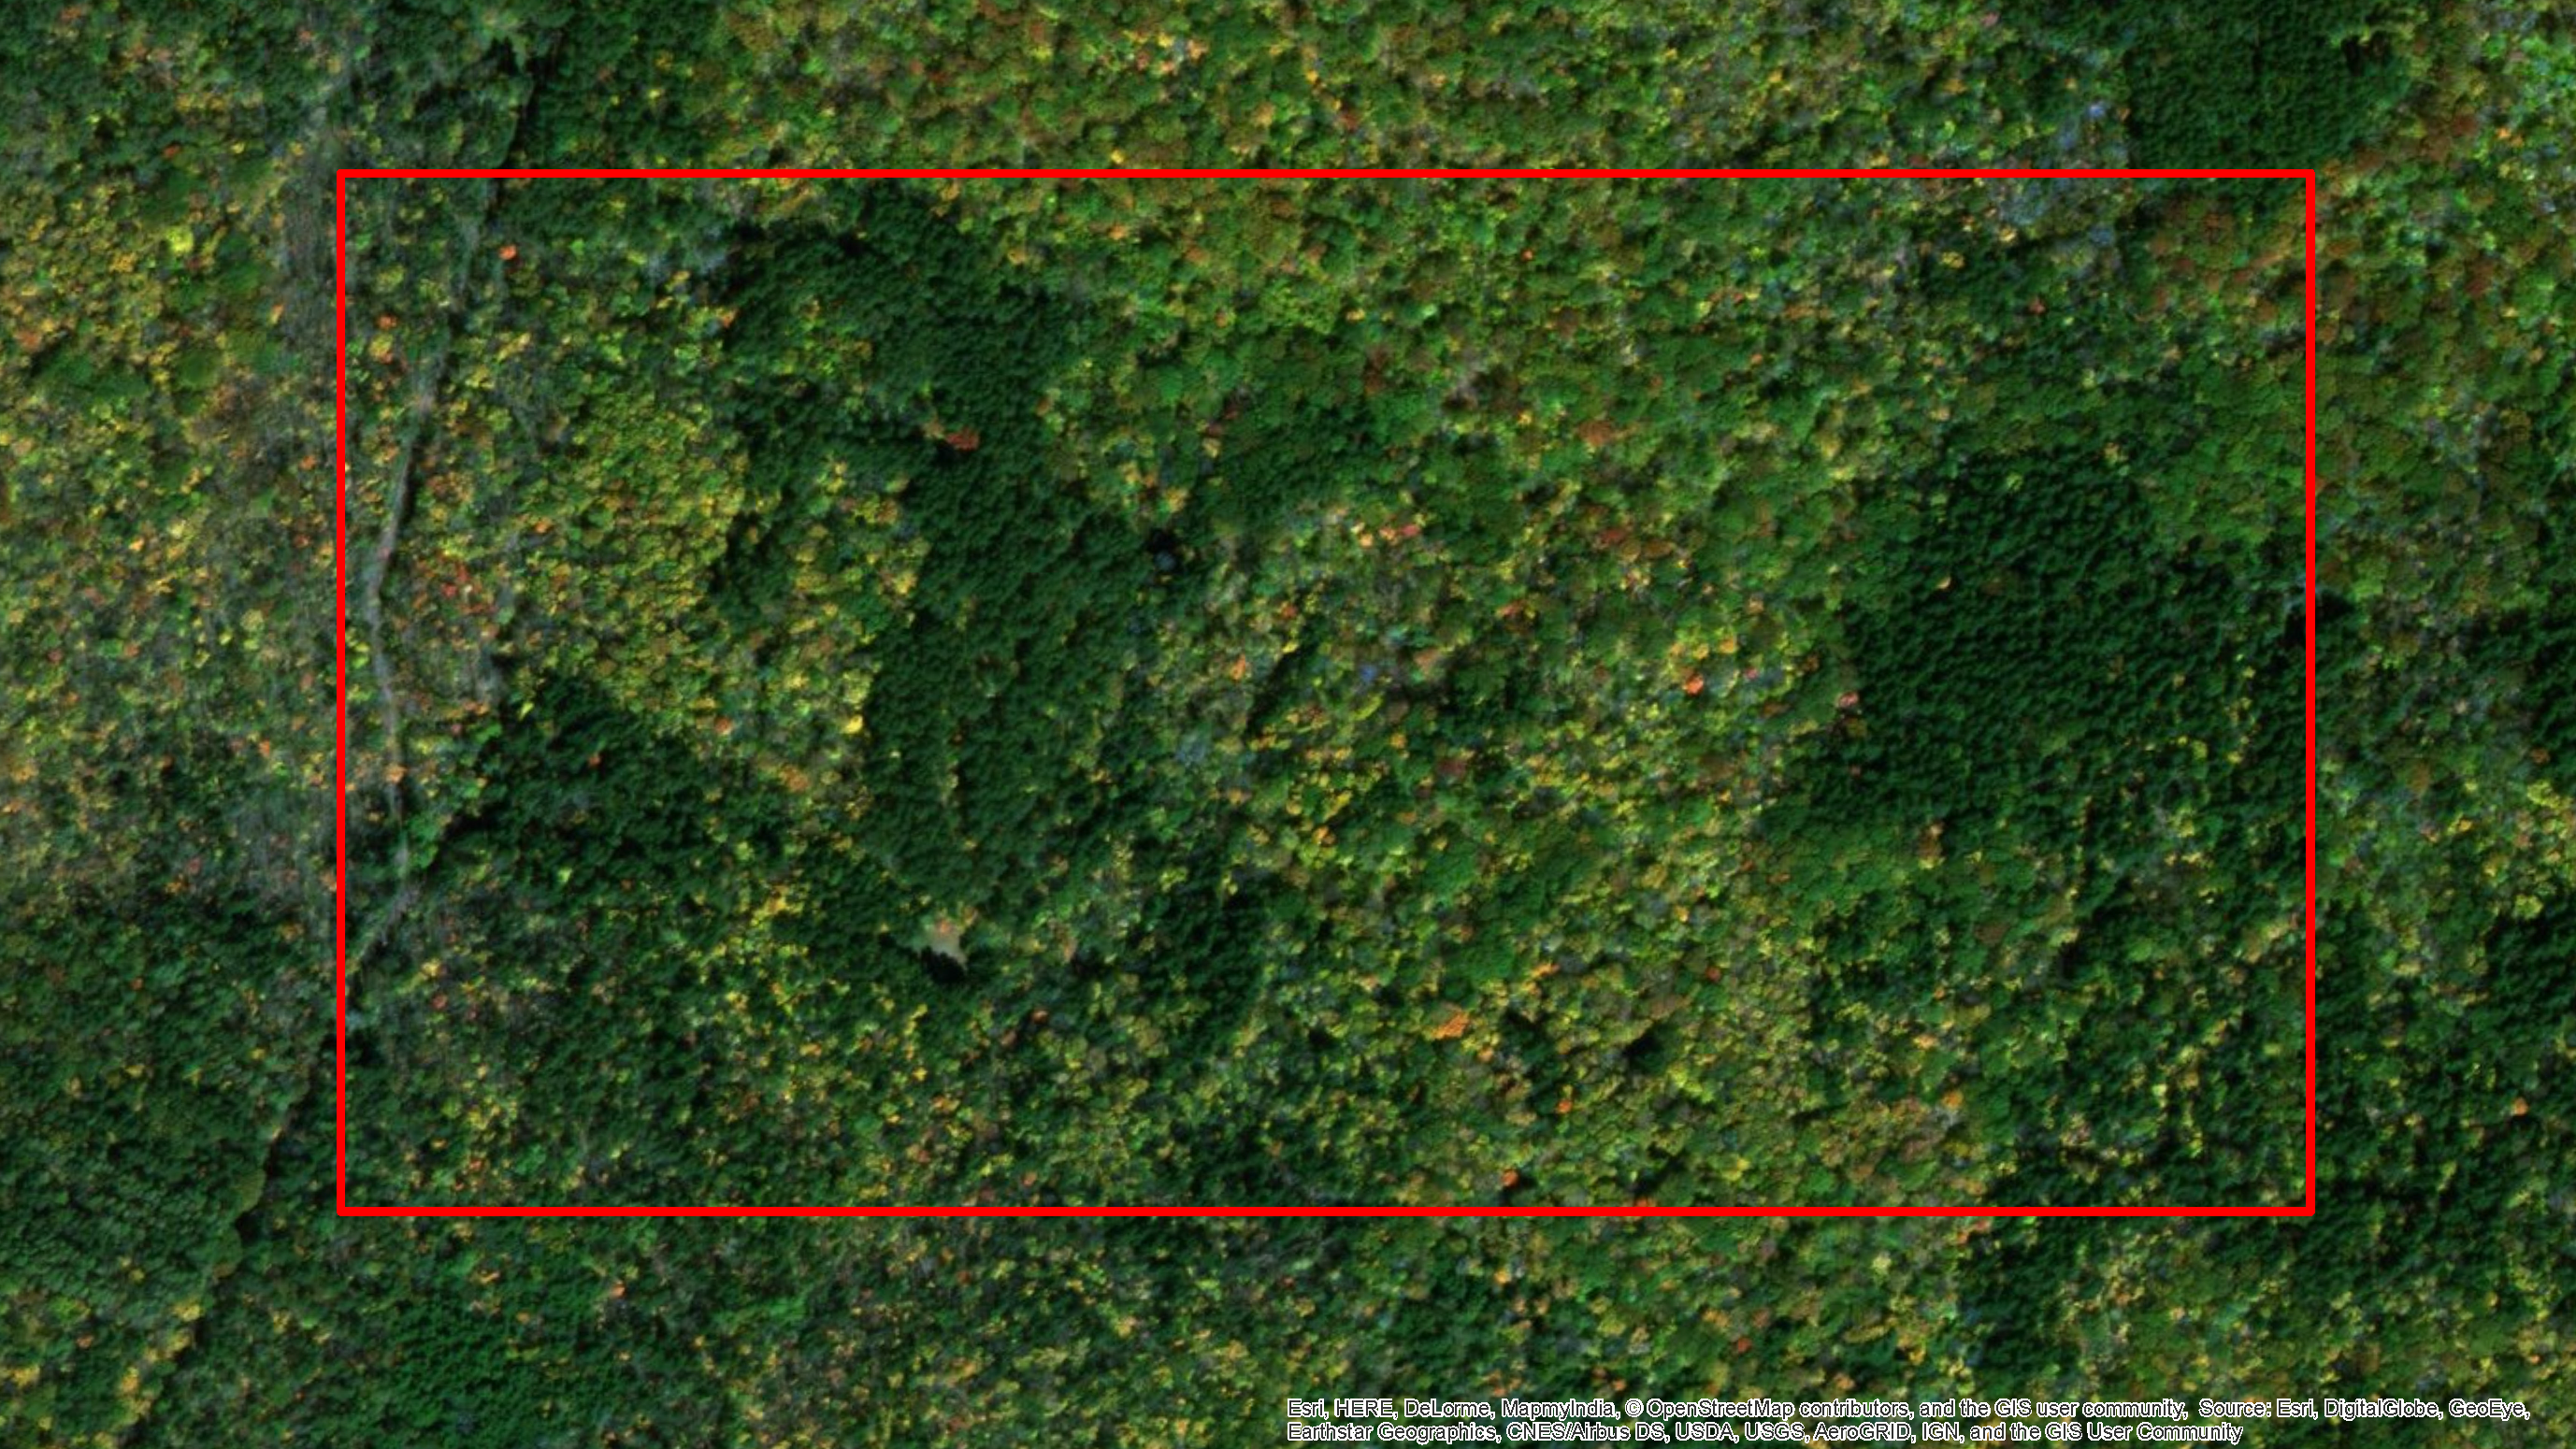
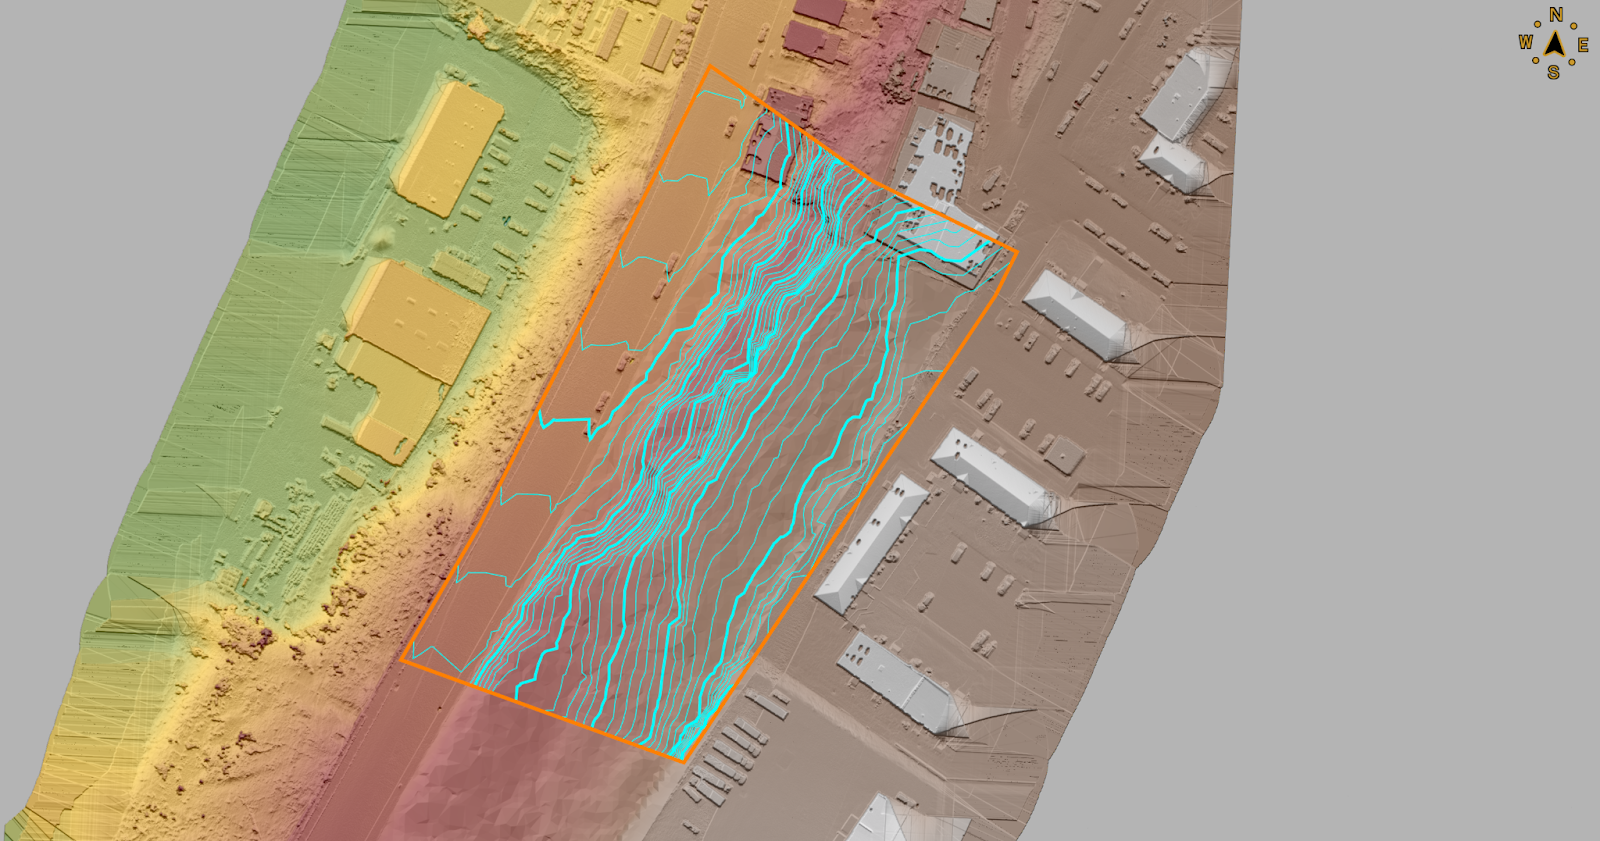
Area reported to contain “monumental and extraordinary stone structures in celestial alignment – perhaps built by an ancient race for ceremonial purposes.”
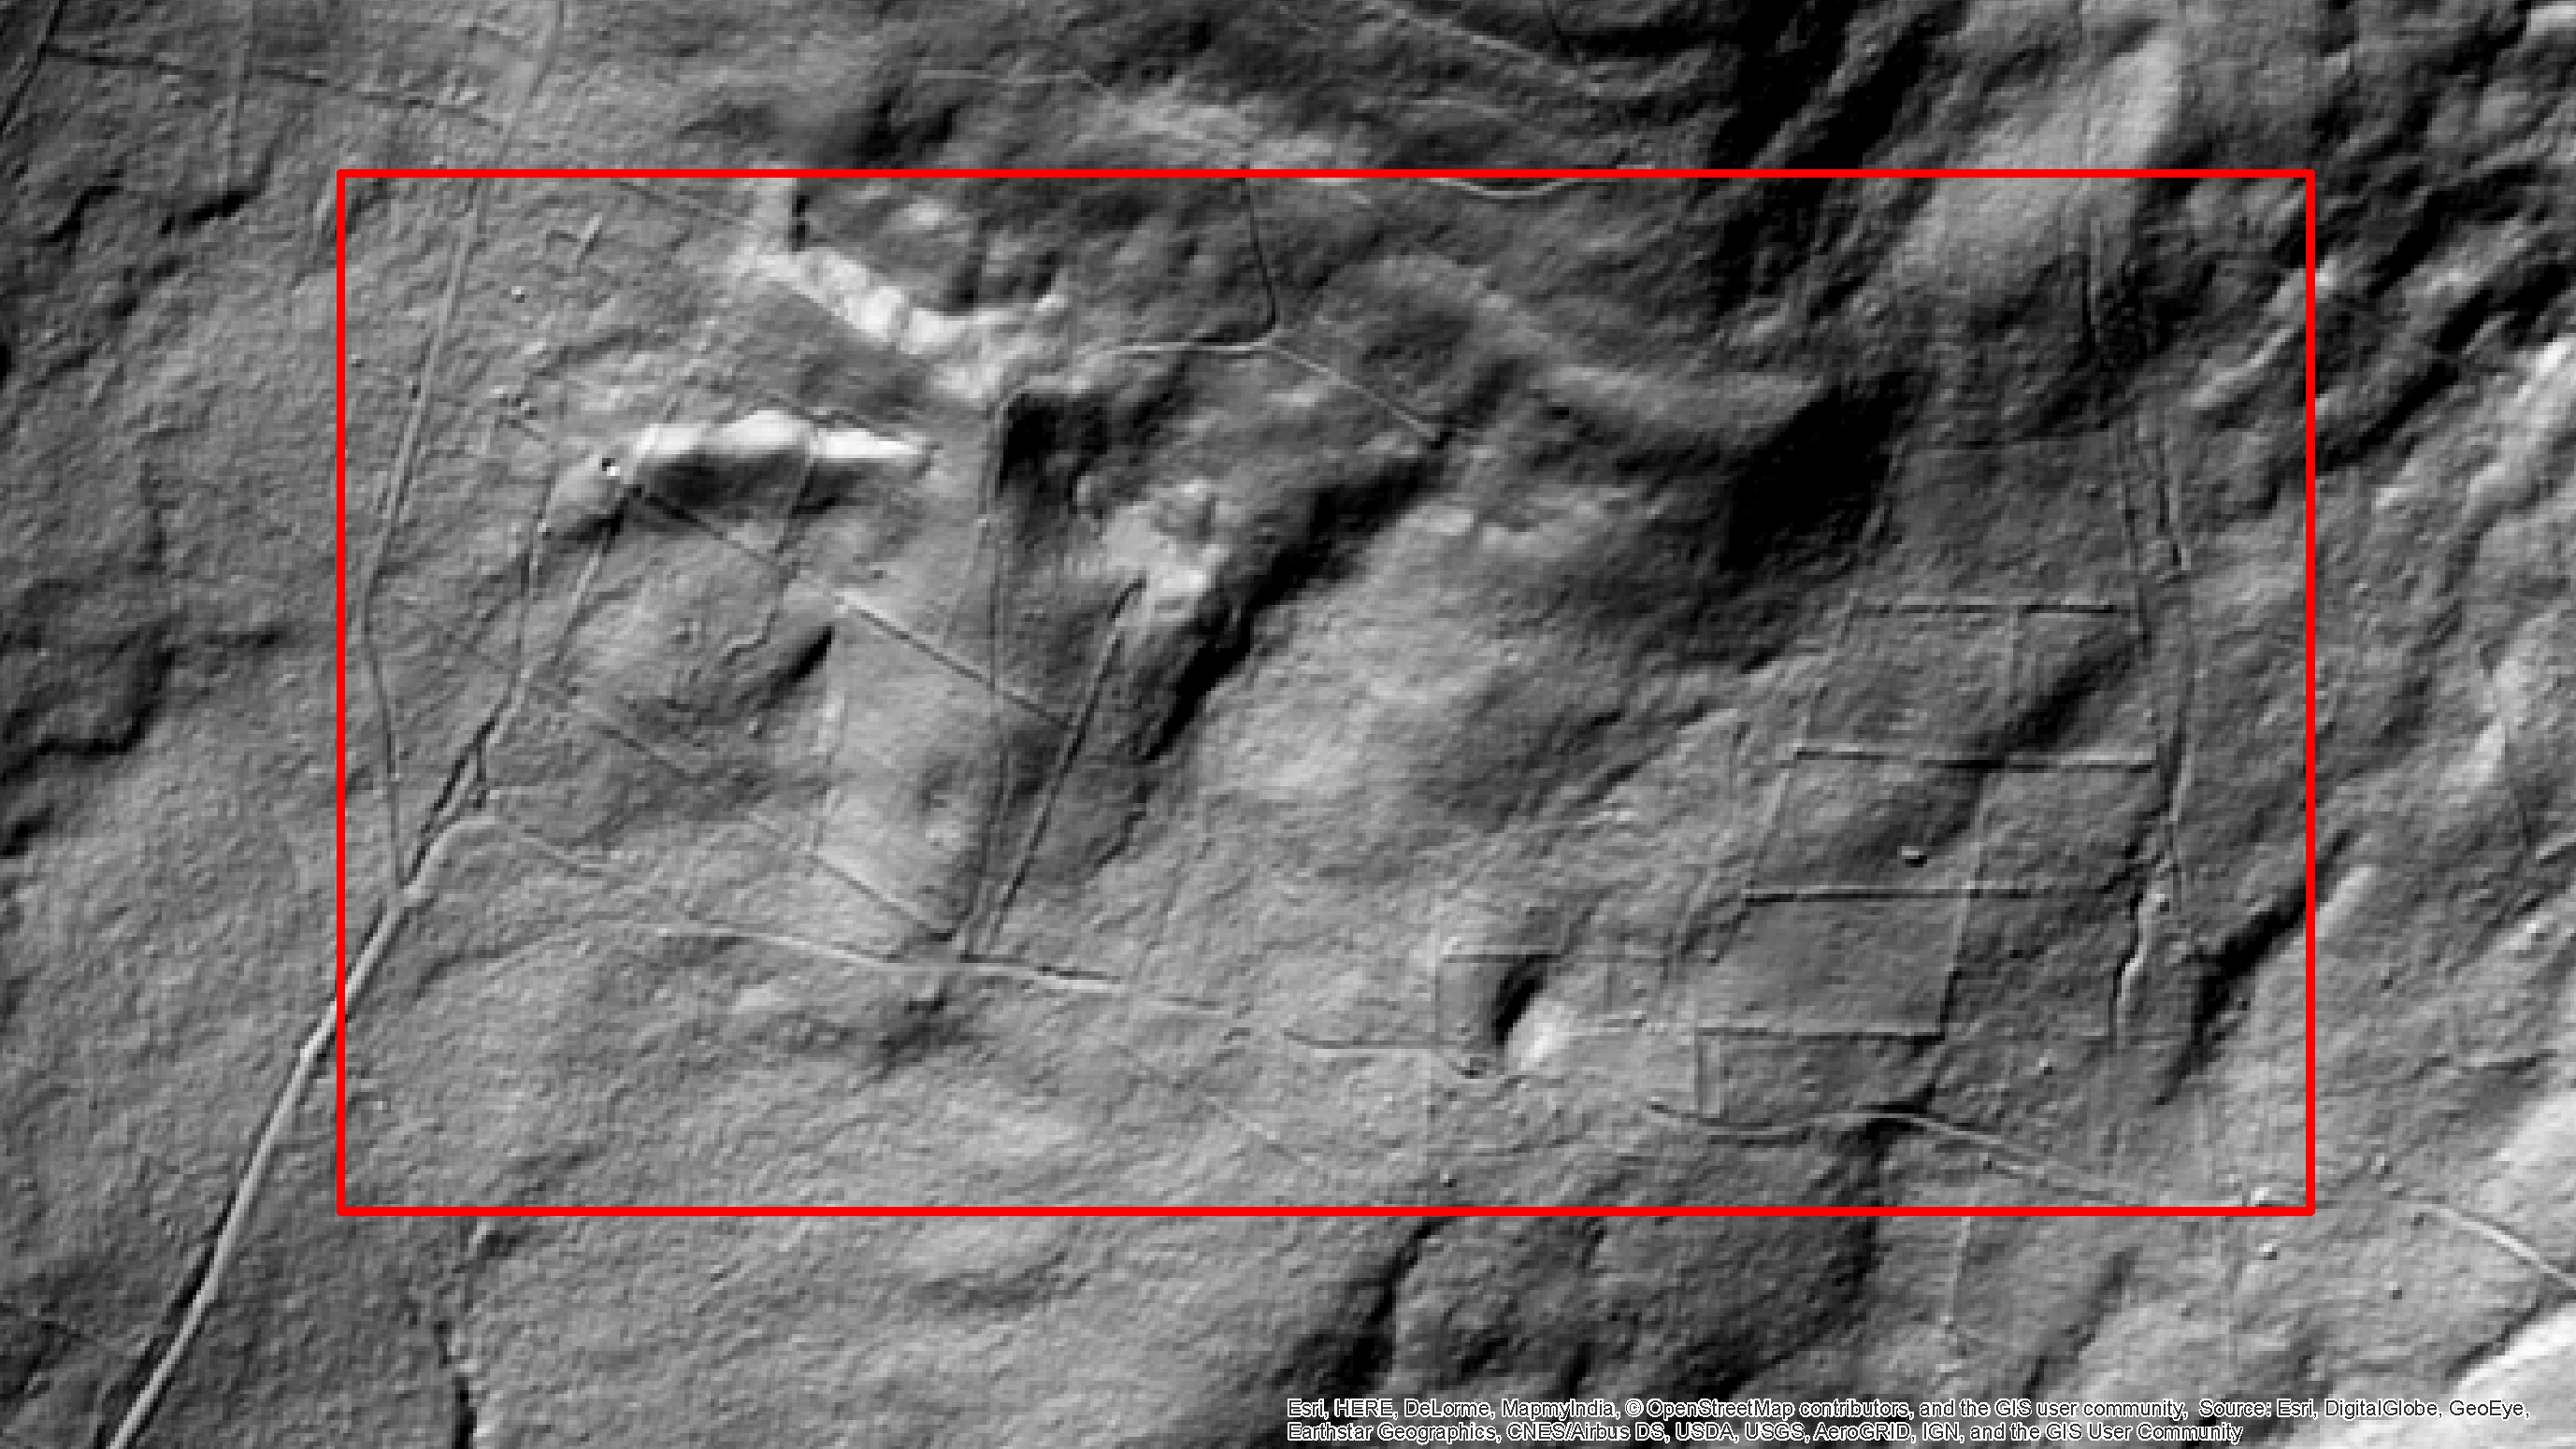
Lidar data reveals “unique features” are really no more than normal stone walls marking former property boundaries.
Coincidentally, during the preparation of this article, lidar was highlighted in what’s being hailed as a “major breakthrough” in Maya archaeology. Researchers, which included Thomas Garrison, assistant professor of anthropology at Ithaca College, have recently identified the ruins of more than 60,000 houses, palaces, elevated highways, and other human-made features that have been hidden for centuries under the jungles of northern Guatemala. The Lidar survey of 2,100-square kilometers encompassed several major Maya sites, including the largest at Tikal, and El Zotz, where Garrison focuses his research.
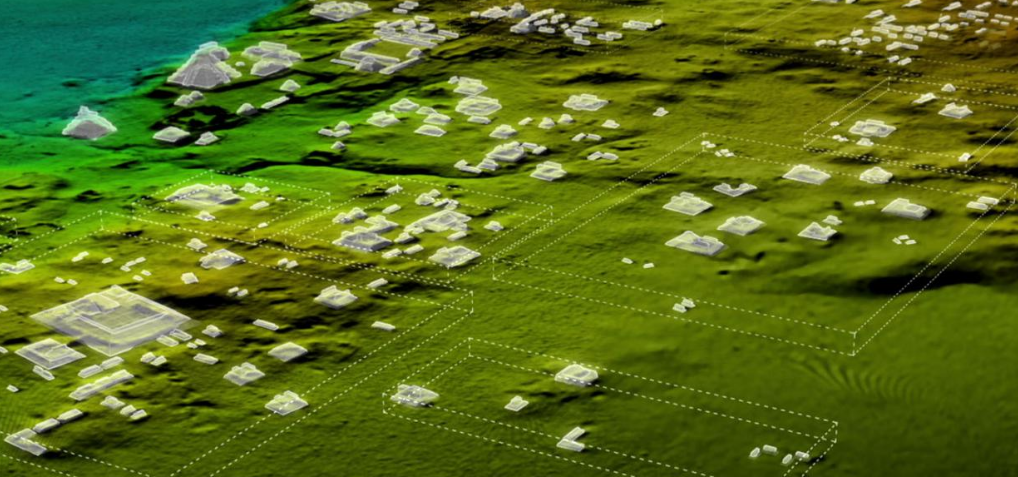
Laser scans revealed more than 60,000 previously unknown Maya structures that were part of a vast network of cities, fortifications, farms, and highways.
Summary
The above language and maps only begin to highlight the broad use of geospatial technology in the New York State Museum. While presentations by Museum staff are occasionally made at the state conferences, their work and products are often published in technical and scientific publications as well. It’s a well seasoned group of GIS professionals. In addition to the geospatial programs reviewed as part of this article, the State Museum also is home to the State Committee on Geographic Names which advises the United States Board on Geographic Names on issues relating to place names in New York and the Empire State Organized Geologic Information System (ESOGIS) which provides information all of New York’s 42,000+ deep wells and thousands of shallow wells.
For more detailed information, visit the Research and Collections on the State Museum website.
The author acknowledges contributions from State Museum staff Susan Winchell-Sweeney, Heather Clark, and David Gerhard for their contributions to this article.
Like this:
Like Loading...