Academic Institution
SUNY Binghamton Binghamton, NY
Dept. of Geography (Urban Planning and Applied Geography)
M.A. Geography May 2025
Rajshahi University of Engineering & Technology Rajshahi, Bangladesh
B.S. Urban and Regional Planning March 2021
Background
Sharmin Akter master’s research focuses on the impact of historical redlining on urban green space and surface temperature in small cities. In particular, her research aims to use high-resolution remote sensing imagery and spatial heat modeling to understand the greenness variability and surface temperature vulnerability among marginalized communities in these city environments.
Though a historical redlining map was prepared around 1930 to prioritize home loans for residents in selected U.S. metropolitan areas, a current study showed that in 108 U.S. urban places, land surface temperatures are about 36 degrees Fahrenheit warmer than those same past redlined neighborhoods. In New York, formerly redlined cities are as much as 12.6°F (7°C) hotter than non-redlined cities, according to a spatial analysis which includes nine New York State regions. (A good, short read on the history of redlining can be found here.)
While most redlining and urban heat studies focus on larger cities because of both higher populations and economic impact potential, small cities are often ignored. As such, Akter’s work focuses on utilizing advanced spatial modeling to measure the precise heat variation and vulnerability in smaller cities with the intent of contributing to the country’s ongoing effort to reduce the temperature vulnerability in marginalized communities and ensure equity in urban planning.
Data and Software
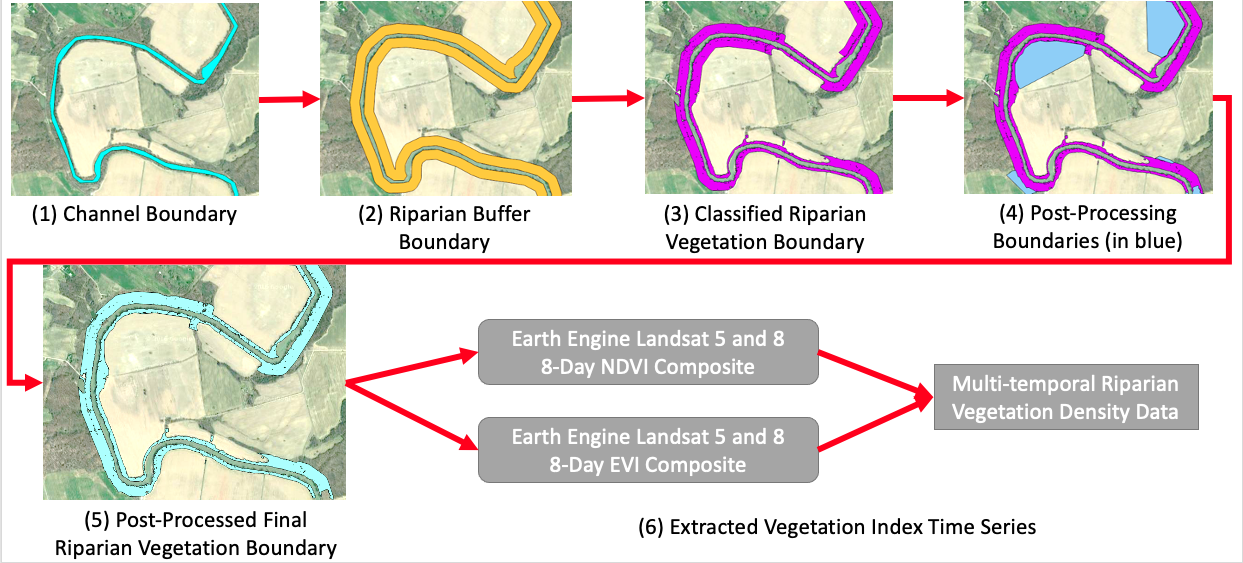
Her research utilizes publicly available data from different sources including USGS EarthExplorer for satellite imagery data and the American Community Survey for census data. Tree canopy data was acquired from the National Oceanic Atmospheric Administration (NOAA) Digital Coast: Data Access Viewer.
Statistical analyses were performed using open-source JASP software and spatial analyses were handled using ArcGIS Pro. Summertime mean temperature over five years (2019-2023) was obtained from Landsat Thermal Imagery and utilized to understand block-level heat variation, Normalized Difference Vegetation Index (NDVI) helped to understand and evaluate greenness variations.
Akter used a redlined map of the Binghamton-Johnson City-Endicott area obtained from the original 1935-1940 Home Owners’ Loan Corporation (HOLC) map series which shows how areas were rated on a scale of A through D. Neighborhoods receiving the highest grade of “A,” were deemed minimal risks for banks and other mortgage lenders when they were determining who should receive loans and which areas in the city were safe investments. Those receiving the lowest grade of “D,” colored red, were considered “hazardous.”
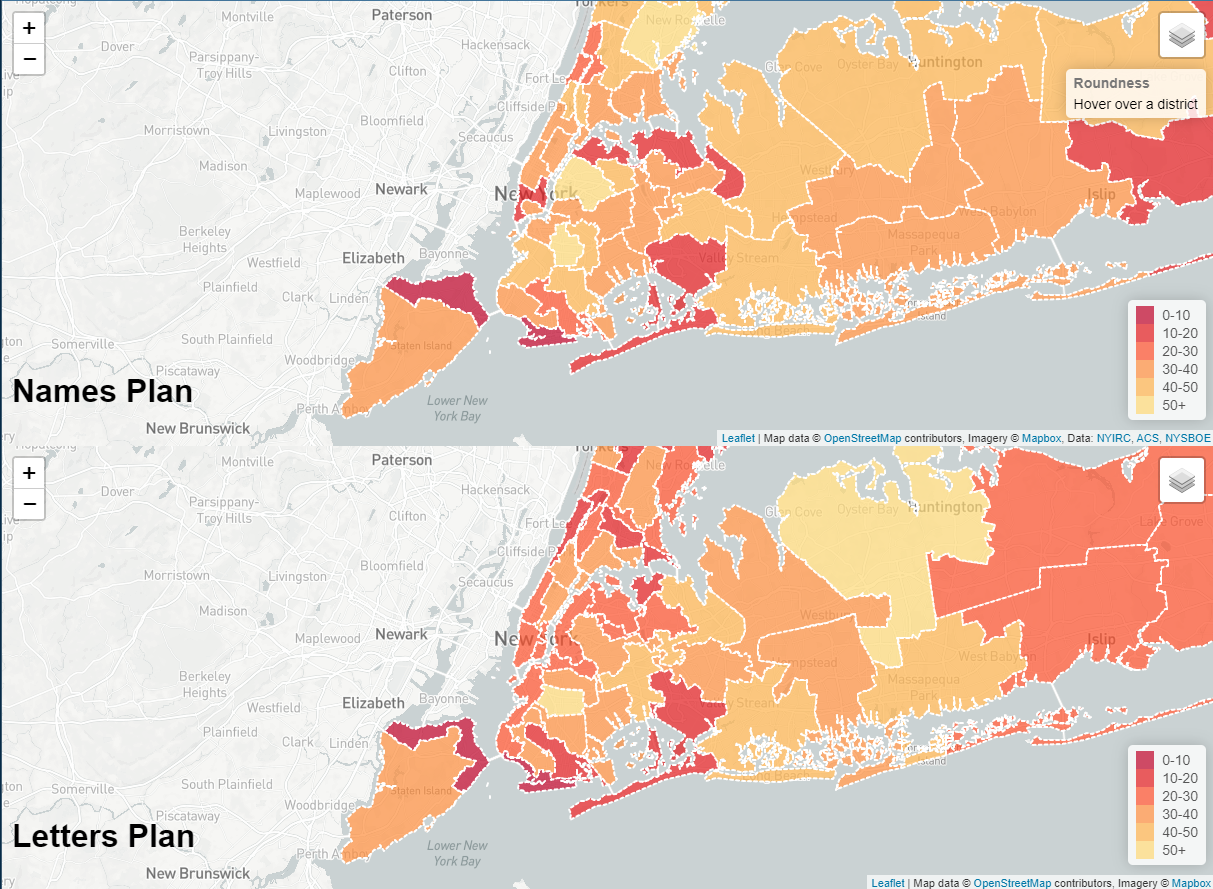
The two maps below show: (1) Block Level Summertime Heat Variations based on temperature data collected from Landsat 8-9 satellite imagery which was spatially joined to block group boundaries to calculate and render mean temperature for the block groups. Original HOLC ratings/boundaries are shown on top of this calculation. (2) The second map highlights NDVI calculated “greenness” values for the same area. Greener areas typically contained more vegetation and trees with the darker browner shading highlighting more built, urban areas. Specifically, National Agriculture Imagery Program (NAIP) imagery obtained through USGS Earth Explorer was used in the calculations.
Additional Mapping
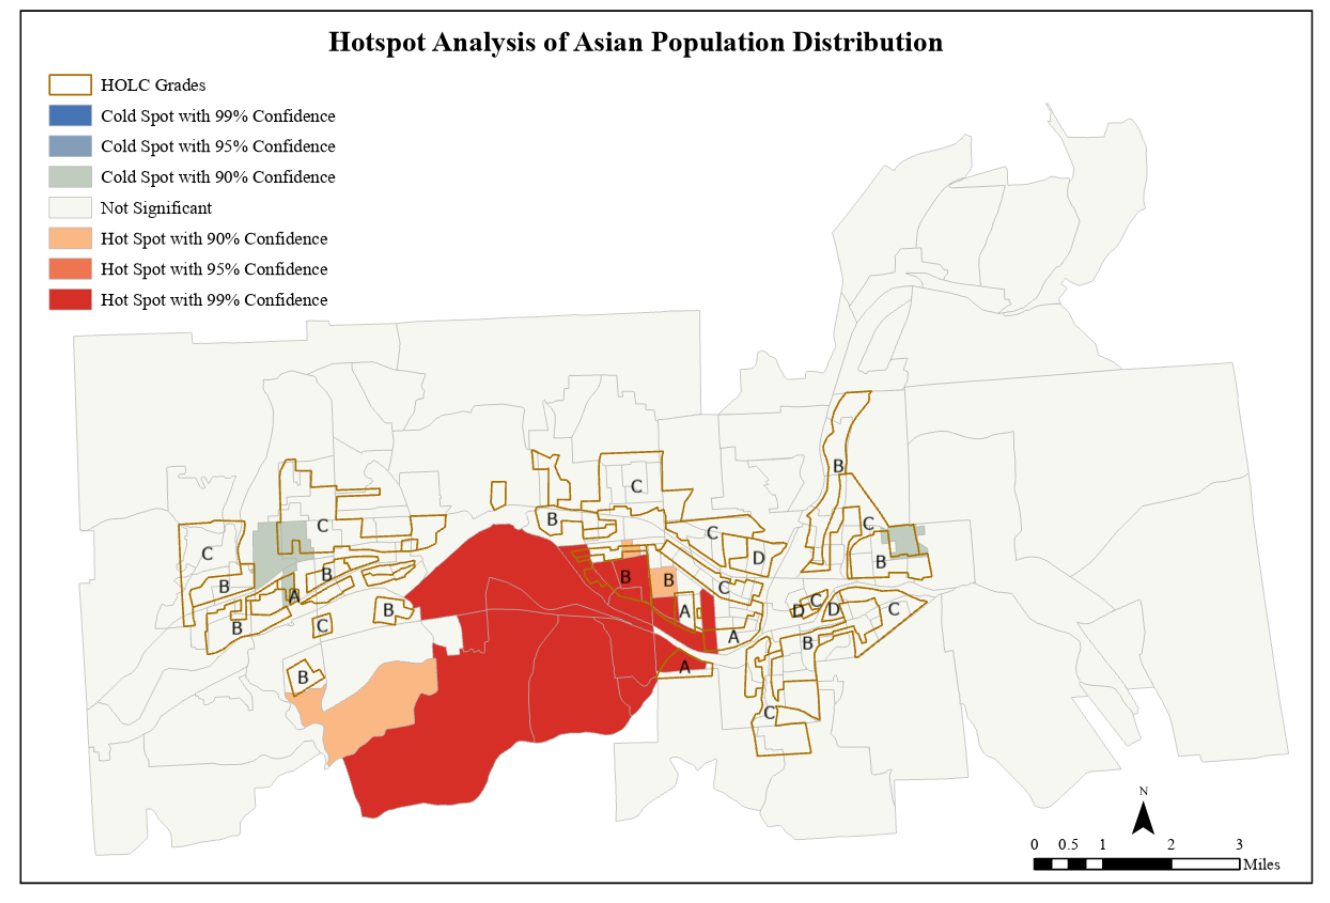
While JASP software offers established tools for statistical analysis, Sharmin recognized the importance of integrating spatial aspects in her urban research. For example, spatial statistical analyses like Getis-Ord Gi* (Hotspot Analysis), and Moran’s I (Spatial Clustering) are easily available at the ArcGISPro software. These tools are extremely efficient in understanding the concentration and clustering specific racial or ethnic groups, helping to identify patterns of segregation, integration, or spatial inequality within a given region which is the focus of her research.
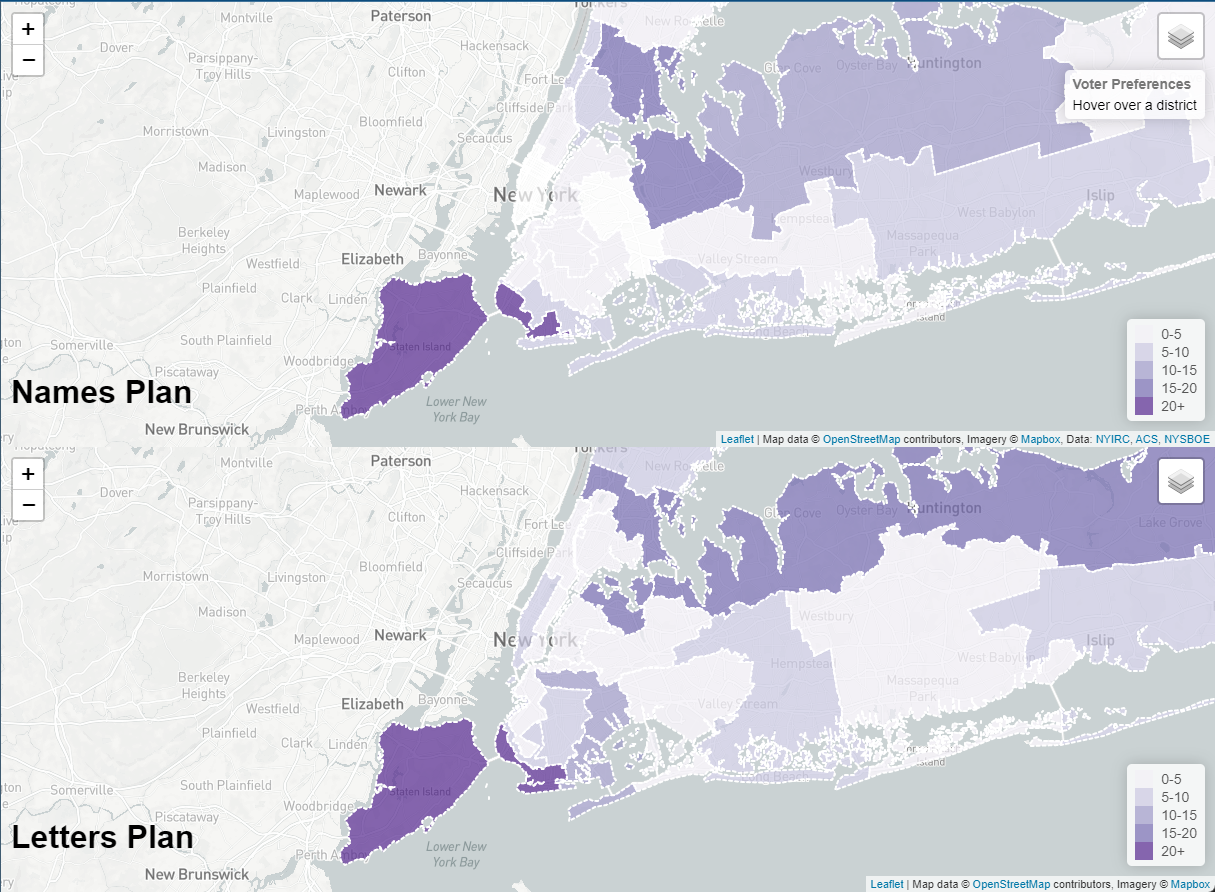
Akter applied Getis-Ord Gi* to demonstrate how populations of different races and ethnicities are distributed across the city. Akter further investigated the extent to which these populations are exposed to increased heat variations specific to the Binghamton area. In each of the following four maps, hotspots and cold spots for different population groups were identified at varying confidence levels (90%, 95%, and 99%). Hotspots are represented in red shades, indicating clusters of high population density for certain racial/ethnic groups, while cold spots are represented in blue, indicating clusters of low population density. The maps were created at the block group level. By comparing the hotspot maps with surface temperature and vegetation maps, Akter found that downtown areas are predominantly occupied by Black and Hispanic populations, characterized by lower vegetation coverage and higher surface temperatures. Conversely, White populations are concentrated in peri-urban areas with higher vegetation levels and lower vulnerability to surface temperature increases.
What’s Next?
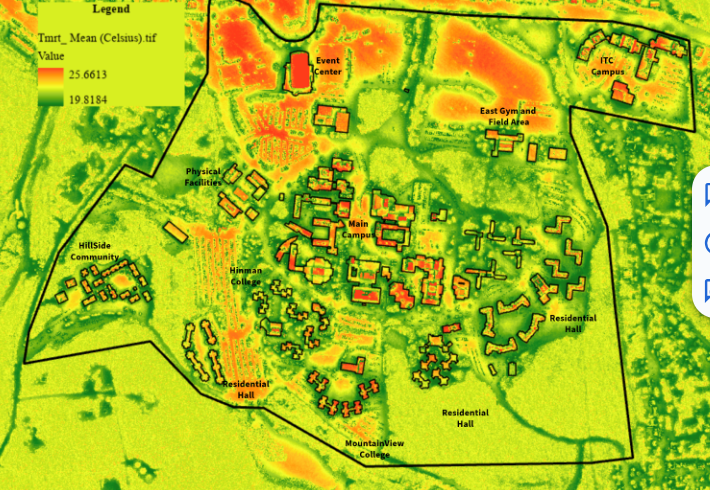
Through her study, Sharmin realized that satellite-derived thermal imagery can be limiting in capturing human thermal comfort during extreme heat events and often fails to provide precise heat measurements. Now she is looking for new spatial heat modeling techniques and working on SOlar and LongWave Environmental Irradiance Geometry model (SOLWEIG) to estimate the mean radiant temperature (Tmrt). This model requires huge varieties of inputs like Digital Elevation Model (DEM), Digital Surface Model (DSM), Digital Terrain Model (DTM) and cDSM rasters along with meteorological variables such as daily air temperature, humidity, and wind speed. (cDSM rasters are created by using the Extract by Mask tool in ArcGIS Pro. In this instance, the use of the tool identified only canopy areas in the raster’s being used in the analysis). But the outputs show improved heat variation at neighborhood and even street scale. The model was tested for Binghamton University and results are shown below.
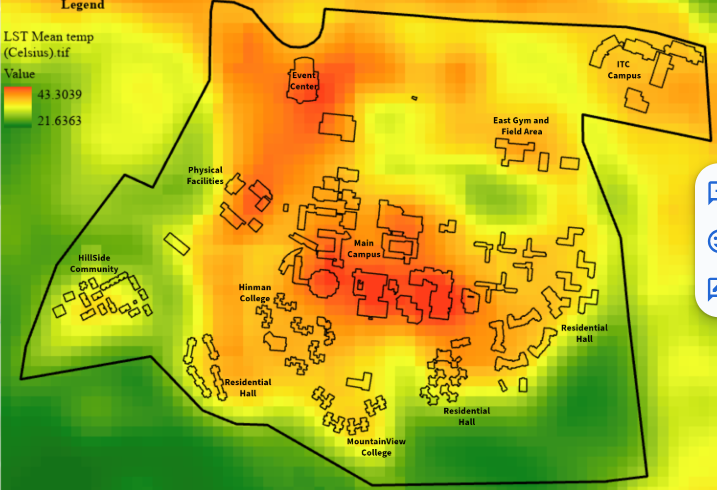
Both of the images are for the entire campus. Red areas mean higher temperatures and green means cooler areas. The first image was generated using the SOLWEIG model that shows precise heat variation at both parking lot and street level. In this example, using both the DSM and DTM raster datasets – which were generated from lidar data (also obtained from the NOAA Digital Coast website), and integrating the air temperature and other meteorological variables obtained from the National Renewable Energy laboratory (https://www.nrel.gov/) , the SOLWEIG model was performed in QGIS software which can generate the final temperature raster at 1m resolution. The model can be applied to measure heat more precisely in context of daytime/nighttime and hourly variations as well.
By comparison, the second image is out-of-the-box Landsat processed thermal data with much less definition.
Summary
There are many other detailed elements of Akter’s research as it will be the first comprehensive research on Binghamton area focusing on understanding the impact of historical policies on current-day community vulnerability utilizing spatial modeling and aerial imagery. She hopes that upon completion, this study will provide decision-makers with more detailed information and insight into the impact of historical redlining on current-day surface temperature vulnerability.
Contact:
Sharmin Akter
Graduate Student
Dept. of Geography (Urban Planning and Applied Geography)
SUNY Binghamton
sakter3@binghamton.edu
Dr. Adam Mathews
Associate Professor
Dept. of Geography
SUNY Binghamton
adam.mathews@binghamton.edu