Jonathan Levy: Cartography Remixed

Jonathan Levy is yet another geospatial enthusiast I have made contact with via the burgeoning GeoNYC Meetup group. It’s a small world indeed as Jonathan and I share some common interests including music, sports, and time spent in one of my most favorite spaces: Idaho. His path down the cartographic road might be considered a bit different than the conventionally trained geospatial professional.  However, what is coming out the other end today is a wide range of interesting cartographic products and services.  Enough for an interesting dialog and blog post – including some interesting personal stuff on the side.  Enjoy.

Jonathan Levy grew up in the Durham and Chapel Hill areas of North Carolina spending lots of time running around in the outdoors.  His dad was a huge fan of National Geographic exposing Jonathan to both the beauty and vastness of the publication’s cartographic products and at the same time taking him camping and trail hiking around  in the Appalachian Mountains.  In his teens, he completed an Outward Bound course which introduced him to orienteering and using maps for navigation and survival.

After graduation from high school, Jonathan attended Brandeis University majoring in Near Eastern and Judaic Studies with a minor in Environmental Studies focusing on conservation biology and environmental politics.  After finishing his undergraduate work he traveled to Grenada, West Indies, to teach environmental/social science to children with Dr. Dessima Williams.   Afterwards, he worked for Polaroid’s Corporate Environmental Department in Boston, MA for nine months before heading to Salmon, Idaho as part of the Student Conservation Association working with the U.S. Forest Service in the Frank Church Wilderness Noxious Weed Inventory program.  It was here he was introduced to Global Positioning System (GPS) data collection concepts and GIS software to make maps of field guides of rare plant species in the wilderness area.

Completing his internship work in Idaho in 2002, Jonathan was  given a grant towards graduate study at at Hunter College in New York City in the MA program specializing in Geographic Information Systems (GIS)  and Media during which time he was able to intern at the United Nations and the New York City Office of Emergency Management.  He received his Masters from Hunter College in 2005.

Getting Started

His first job out of Hunter College was with the NY State Legislative Task Force for Demographic Reapportionment which Jonathan notes “was very GIS heavy and really interesting”.  At this point he began picking up freelance work on the graphics side of things with TED.com, Maps.com and Not For Tourists – the latter of which was has continued to be a successful long term contract.

Along the way he has continued to expand his use of the ESRI software particularly with regard to the spatial/network analyst extensions as well as becoming proficient in QGIS and Carto. Because he extends his cartographic product beyond the what is available with GIS software, Jonathan uses Adobe Illustrator and Photoshop for graphics processing, texturing and post production. For 3D renderings he uses Cinema 4D, After Effects, and Sketchfab.

Sample Cartographic Products

Lower Manhattan Buildings:

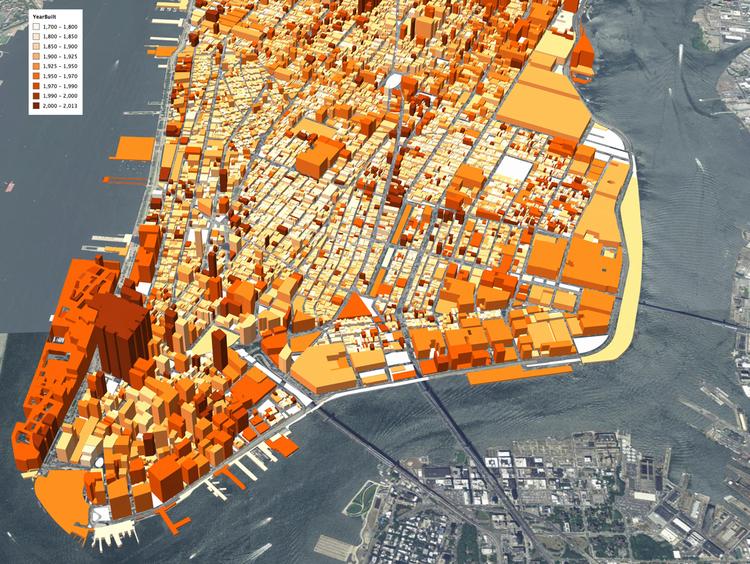
This 3D rendering of buildings in Lower Manhattan show the years in which they were built from 1700 to the present. The gradations of dark orange to light orange correspond to the newest to the oldest buildings. The data used to create this map came from NYC Open Data.

Environs Map Series:

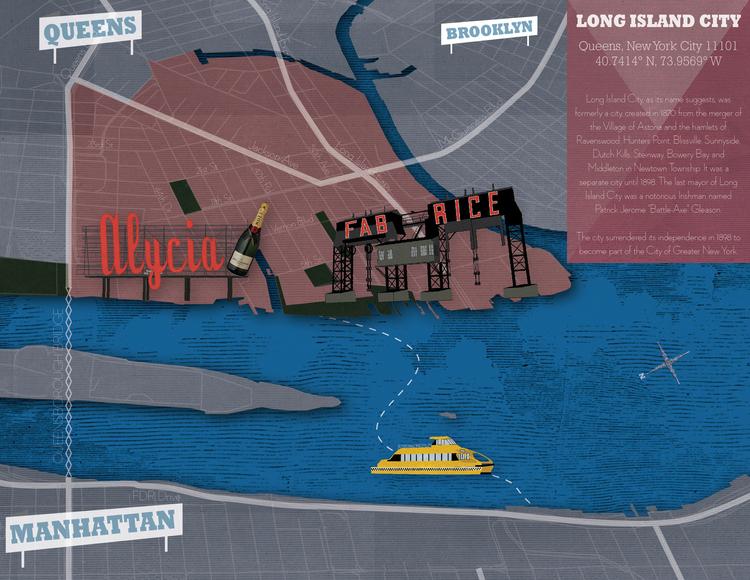
This series is a way of sharing Jonathan’s life experiences of favorite places and spaces in his  life through map renderings and illustrations.  It is his personal experience of specific places and the personal “visions” of that space.  He gets requests to produce custom maps for friends, family and clients who want their town or neighborhood mapped in this style. He’s currently working on a Valentine’s day gift for a client who wants a map of Roncolo di Quattro Castella in this style.  These images are created using: Photoshop, Adobe Illustrator, scanned textures and GIS data.

Jonathan notes: “I love seeing Long Island City from across the East River. The Pepsi and Long Island City signs are featured prominently although here I’ve replaced them with my sister and brother in law’s names in lieu of their recent marriage.”

Airbnb:

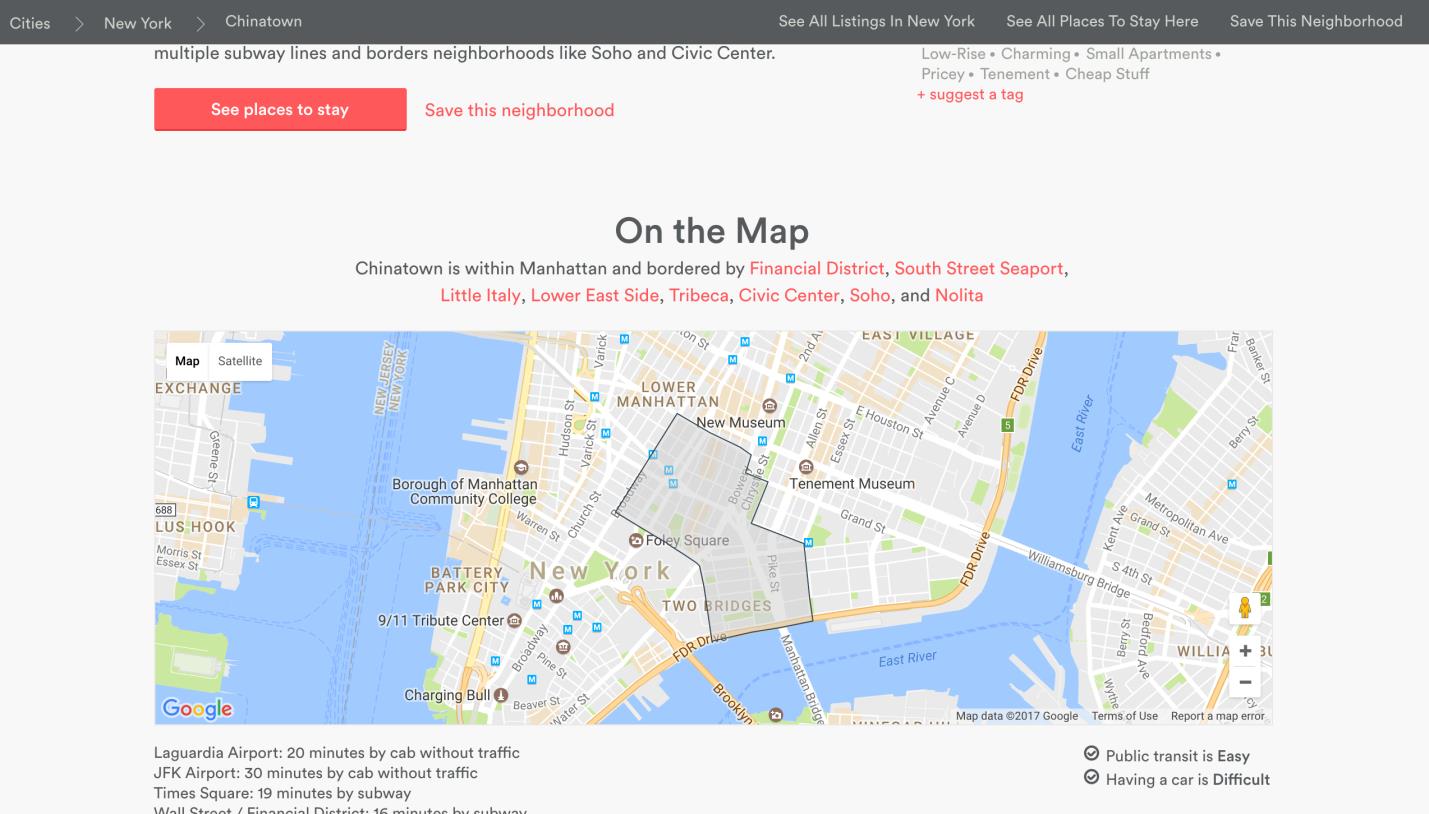
Jonathan notes this was a “fun” project. Using some fancy internal tools Airbnb developed, Jonathan helped map out neighborhood boundaries in 20+ cities across the U.S – including New York City.   It involved lots of research and involvement with city planners, residents and/or a combination thereof to get a feel for the individual city.

Sample of one NYC neighborhood maps – Chinatown – Jonathan researched and created for Airbnb helping users better define which areas and neighbors they are looking for lodging and accommodations.

Montauk 3D:

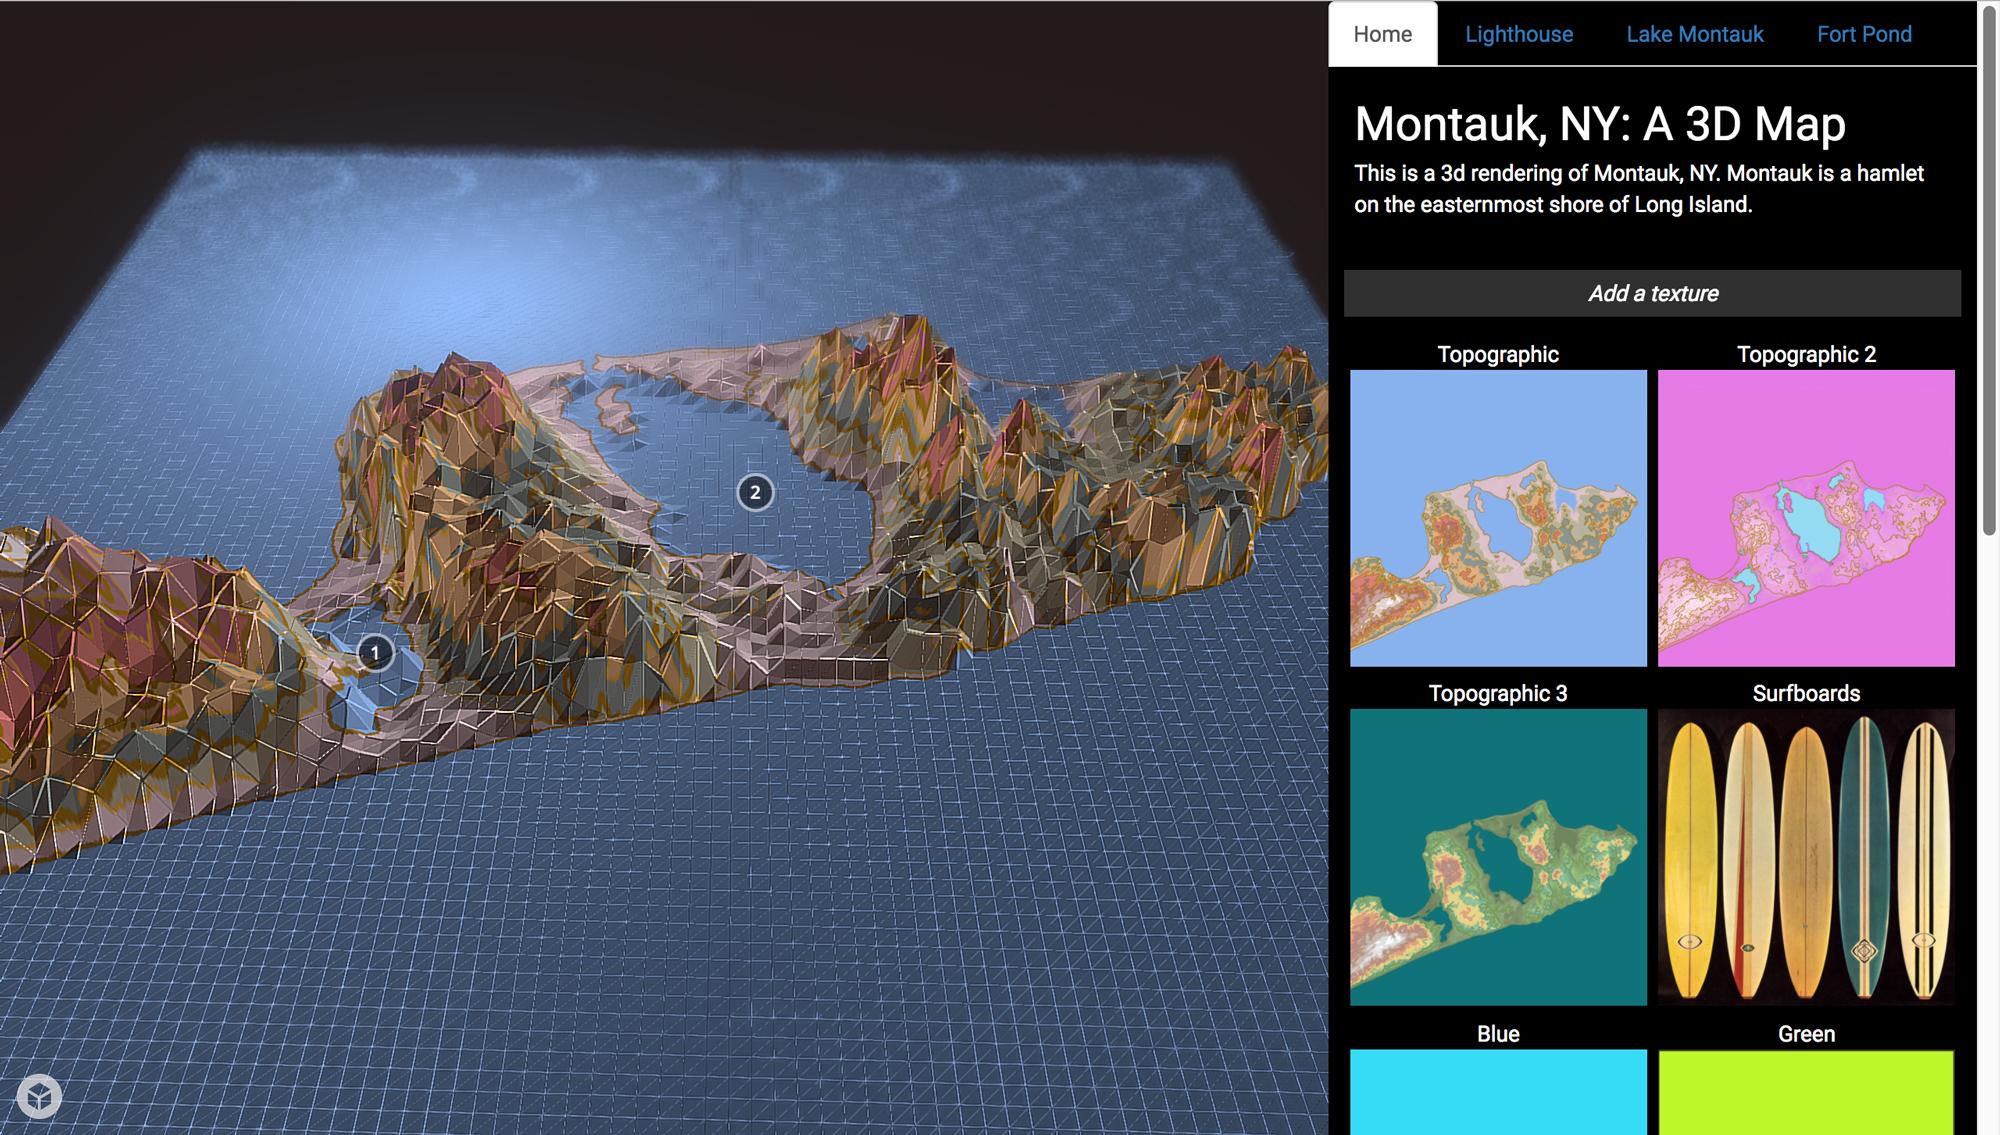
This was a personal project that was inspired by his time this past summer learning to surf in Montauk. He was struck by the interesting topography of the area. He took digital elevation model (DEM)  data, exaggerated the contours in Cinema 4D for effect, created custom topographic palettes and created a website that uses Sketchfab’s API to switch out textures on the 3D surface. Link to website: http://aws-website-montaukd-vr1zr.s3-website-us-east-1.amazonaws.com.  (Note:  Sketchfab recommends WebGL to display 3D content in real-time  which is a standard in most modern browsers.  Check your browser for compatibility at http://get.webgl.org/).

Amped Topography of Montauk: If you know the Montauk landscape and locations of specific geographic features (i.e., Lake Montauk and the Lighthouse – chances are you would find these renderings of the area very interesting – and different.

Loud Noise/Noise Complaints:

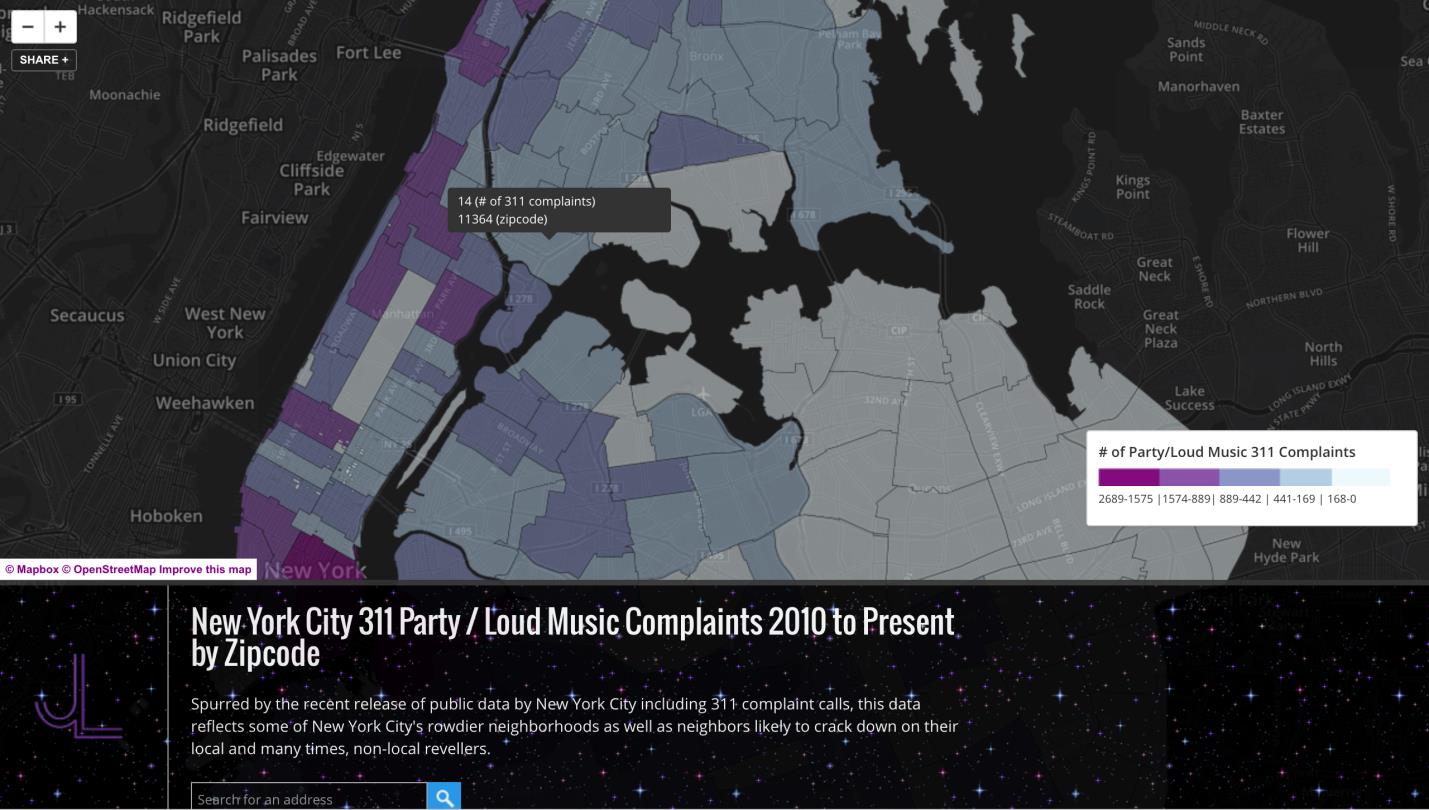
Jonathan also enjoys scrapping data from public web sites to develop maps and visuals.  While living on the Lower East Side of Manhattan, Jonathan created a Party/Loud Music Complaints map based on 311 data obtained from New York City’s Open Data Portal. These maps include and reflect his interest in rendering the “personality” of geospatial data through design choices – as illustrated in this map/web map – including a dark background, a purplish nighttime color palate and star animated Gifs.  Indeed an interesting map from a person who loves loud music and spends his spare time playing in a metal band!

Built with OpenStreetMap, this interactive map allows users to pan around Manhattan to see which NYC zip code has the largest number of noise complaints as filed through 311.

The Other Stuff

Jonathan always finds his legal mapping client work interesting as it requires mapping and data development to such a fine level of detail.  Often such work involves boundary disputes requiring the review of historical deeds and historic photogrammetry to determine boundary line changes. Looking forward he continues working with Sketchfab in context of mapping in the 3D space.  He supports Sketchfab because it is “accessible, light and has a community for sharing 3D models with annotation”.

As a one person shop, Jonathan does not have a large marketing and public relations budget and as such all of  his business development is  word-of-mouth.  He’s recently created an interactive presentation for a close friend and chef/owner Will Horowitz (Duck’s Eatery / Harry & Ida’s) which he presented at the Food on the Edge conference in Ireland. He’s working on an online platform, Common Scraps, which addresses the issue food waste.   As an extension he has produced some animated maps that show how food scraps can be saved and reused in an exchange system between local farms/suppliers and restaurants.

Jonathan covers a lot of ground and styles in his work which is more detailed and described on his website. Take a look, and if you are really lucky you might find him playing at a local club down the street with his band Autowreck.  Go check them out.

Though take some ear plugs and hold on.

Contact:  Jonathan Levy @ jl@jlcartography.com


10 Questions: Steve Romalewski

Steven Romalewski is currently director of the Mapping Service at the Center for Urban Research at The Graduate Center / CUNY.  During his 32-year career he has helped hundreds of nonprofit groups across the country leverage the power of GIS; helped develop more than two-dozen online mapping services analyzing environmental issues, social services, transit routing, demographic trends, voting behavior, and legislative representation.  He has also coordinated the work of community groups and others across New York to advocate for sensible environmental policies at the local, state, and federal levels.  For the past 10 years, he has taught students at Pratt Institute how to use GIS in their urban planning careers, and helped educate many others through presentations about the value of GIS.  He lives in Manhattan.

eSpatiallynewyork:  How did you end up in your current position at Center for Urban Research?  

Romalewski:  Before joining CUNY I ran the Community Mapping Assistance Project (CMAP) at NYPIRG for about eight years, providing mapping services to nonprofit organizations across the country.  (Before that I was an environmental researcher and advocate at NYPIRG.)  By 2004 or so, CMAP’s work had started to outgrow our advocacy-oriented parent organization. Internally we discussed options of spinning off CMAP as a social business venture, merging it with another organization, or launching it as its own nonprofit.

At the same time we were going through a strategic planning effort for the OASIS project, and one of the key findings was that OASIS would benefit from an institutional setting such as academia where the OASIS website would be able to leverage more stable technology resources and organizational support.

One of the academic programs we talked with was the Center for Urban Research (CUR) at the CUNY Graduate Center.  I had worked on projects over the years with CUR’s director John Mollenkopf, and he was a big fan of our work. It seemed like a great fit, and in January 2006  I moved to CUNY.

eSpatiallynewyork:  How do CUR projects come to be or developed?

Romalewski:  We’re fortunate to have a good amount of leeway in deciding on projects.  Generally CUR engages in applied research projects in the areas of neighborhood change, immigration, and urban development broadly speaking. Within those areas, we look for mapping projects where we can have an impact, where we can leverage CUR’s mapping skills and expertise in analyzing urban trends, and that come with funding support so we can cover staff time and related expenses.

We’re especially interested in working with our colleagues throughout CUNY, as well as within city government (since CUNY has a close relationship with New York City agencies), but we also take on projects with a wide array of partners.

If the project involves an online mapping component we try to structure it so we can incorporate the latest and greatest interactive web and mapping techniques and technologies. Continue reading

Geospatial Business Spotlight: Tyler Technologies

Company Name:  Tyler Technologies

Business Unit:    ERP & Schools Division, Transportation Solutions (formerly Versatrans)

Website:               www.tylertech.com

Established:        1966

THE COMPANY

Tyler Technologies, Inc., is a leading provider of end-to-end information management solutions and services for local governments. Tyler partners with clients to empower the public sector — cities, counties, schools and other government entities — to become more efficient, more accessible and more responsive to the needs of citizens. Its mission-critical applications provide the public sector with the ability to streamline and automate operations, resulting in improved productivity, reduced costs and continual process improvement. Tyler’s client base includes more than 14,000 local government offices in all 50 states, Canada, the Caribbean, the United Kingdom and other international locations. Forbes has named Tyler one of “America’s Best Small Companies” eight times, and the company has been included six times on the Barron’s 400 Index, a measure of the most promising companies in America. Tyler provides a broad line of software products in seven main solution areas: appraisal and tax; courts and justice; ERP financial; planning, regulatory and maintenance; public safety; records and documents; and K-12 schools. Tyler has over 400 customers in the State of New York. Customers include large counties such as Nassau, Suffolk and Westchester as well as municipalities such as City of Buffalo, Rochester and Yonkers.

Versatrans started as a transportation planning consulting firm in 1965 and began developing software in 1980. For more than 35 years, Versatrans has developed the leading technology for school professionals to deliver the best service to their districts. In 2008, Versatrans became part of Tyler Technologies, which today employs more than 3,600 professionals. Since that time, the Versatrans® product line has been maintained and supported, and the number of development resources assigned to the product line have nearly doubled. Tyler’s transportation solutions are the software of choice among more than 1,600 school districts and pupil transportation service providers in the United States and Canada. In the State of New York, Tyler transportation solutions are used in over 280 school districts including large school districts such as Buffalo Public Schools, Williamsville Central School District and North Syracuse Central School District, but also in small school districts such as Fort Plain Central School District, Candor Central School District and Broadalbin-Perth Central School District.

PRODUCTS AND SERVICES

Tyler’s transportation solutions are built to factor together district policies and student information with hazard restrictions and realistic bus speeds. This provides safe and accurate bus stop locations and optimal routes that save money. By geocoding with the latest GIS technology using county maps, and taking into account cross restrictions, hazard zones, predator locations and more, the software picks up students from their exact location and assigns them to the safest stop. The Tyler team is composed of industry transportation professionals such as former directors, trainers, routing experts and drivers which, combined with experienced software engineers, apply their expertise and latest technology to transportation solution products, implementation and support.

Tyler’s transportation solutions include Traversa®, the Versatrans suite and Tyler Drive™.

Traversa

Traversa is Tyler’s integrated, comprehensive transportation management system. Traditionally, transportation software has been offered piecemeal, with different interfaces, different data sources and different requirements for training and installation. Traversa offers a seamless user experience for:

  • Bus routing
  • Activity trips
  • Work order tracking
  • Fleet maintenance
  • Automated vehicle location (AVL)/GPS tracking

In addition to the areas mentioned above, Traversa’s core functionality includes entity management (students, vehicles, employees, etc.), messaging and alerts, planning and reporting. Traversa is a cloud-based service supported by Tyler experts and hosted in Tyler’s SSAE16-certified data center. Tyler’s GIS services department converts a client’s data and helps verify client maps. Tyler’s transportation team provides training and data security and – when needed – disaster recovery.
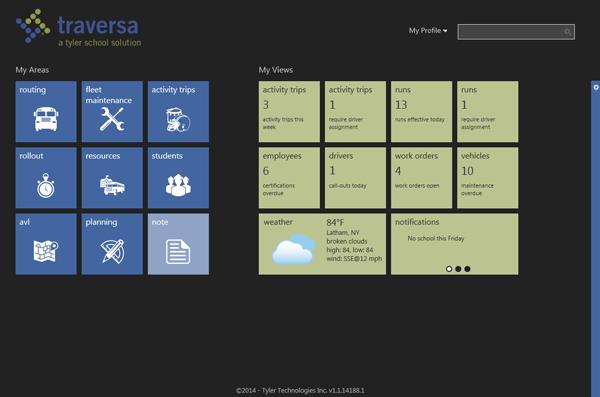
 

TylerTech1

Traversa Dashboard allows school district transportation personnel to see a comprehensive view of everything they need for routing, planning and fleet maintenance.

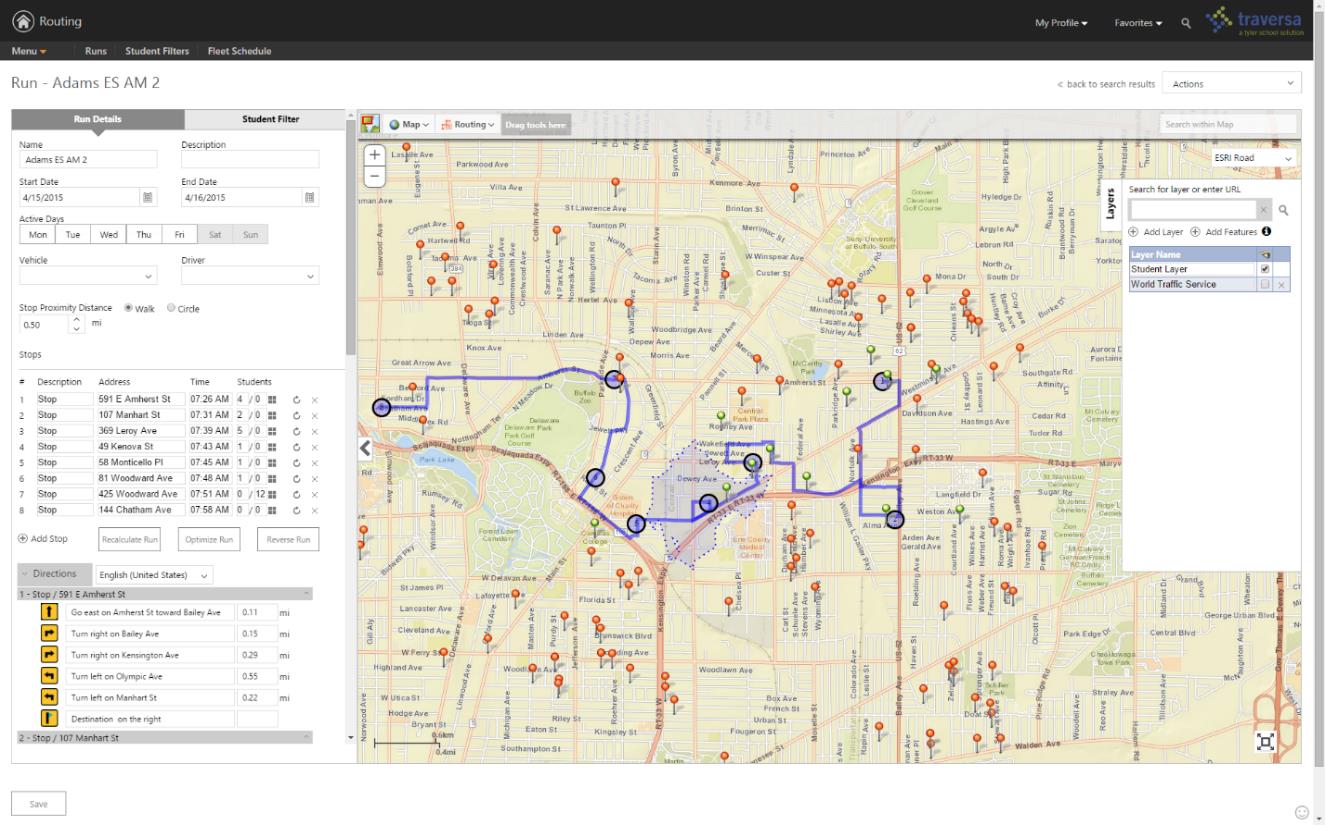
Traversa’s technology stack incorporates portions of ESRI’s mapping software and can also interface with third-party data providers to show real-time traffic conditions, construction projects, city planning, evacuation routes, weather and more. A user can select a bus stop and zoom in to inspect the streetscape for possible safety issues. Traversa even helps a user respond to change. If a bridge washes out, he or she can quickly find an alternate path and print the new directions for drivers to use.
TylerTech2

Traversa Routing allows a school transportation router to build daily runs, assign students to stops, generate driver directions, assign vehicles/drivers and more.

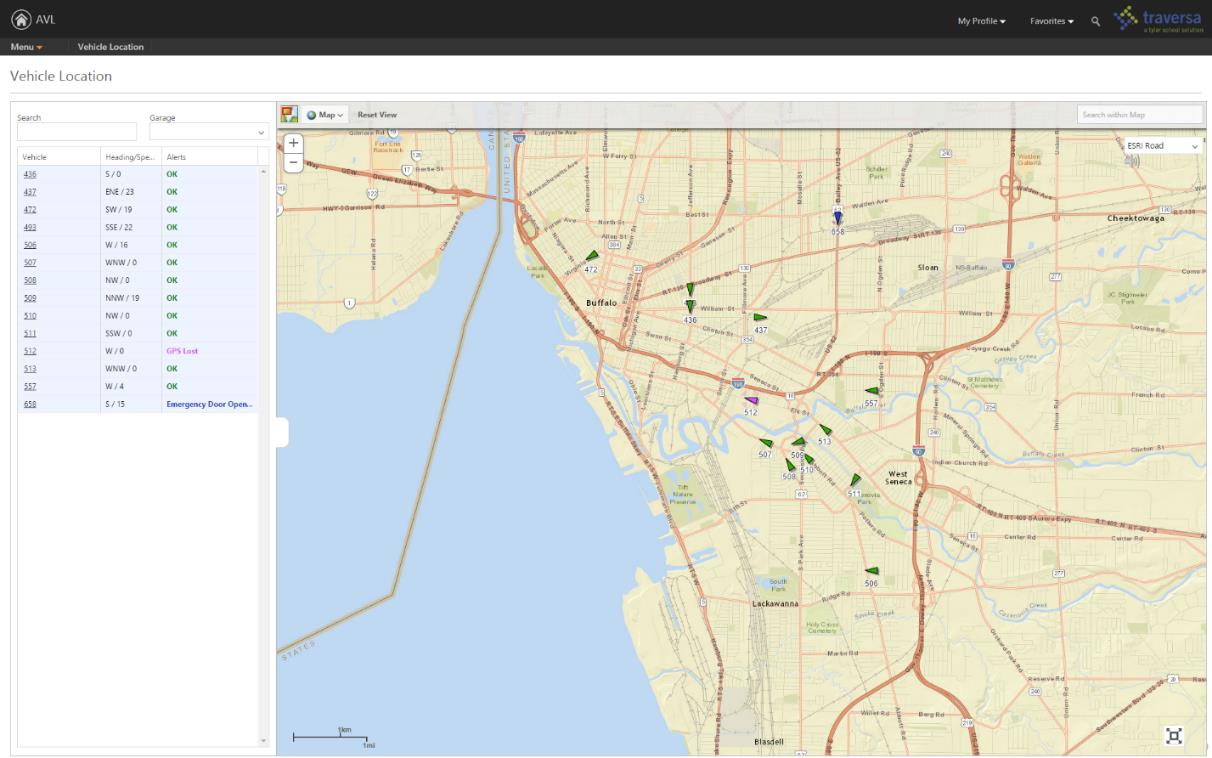
Traversa AVL brings all vehicles to one screen for the dispatcher to monitor them in real-time. Users can filter for a specific vehicle, date or time and follow the path of that vehicle. They can also assign geofences for alerts and much more.
TylerTech3

Traversa AVL allows users to view current and historical data related to the location, speed, and direction (N, E, S, W) of the entire fleet of GPS equipped vehicles.

To learn more about Traversa, follow this product overview video.

Tyler Drive

Tyler Drive is an innovative, mobile device designed for the school bus driver.  Mounted on the school bus console, Tyler Drive’s 4G service and cloud-based software closes the gaps in school bus transportation.  It stems the losses caused by outdated timekeeping software and substitute drivers navigating unfamiliar routes. Tyler Drive keeps school buses on course and generates the documentation for reporting and reimbursement.

Tyler6

Tyler Drive Dashboard presents drivers with a comprehensive view of everything they need for their shift.

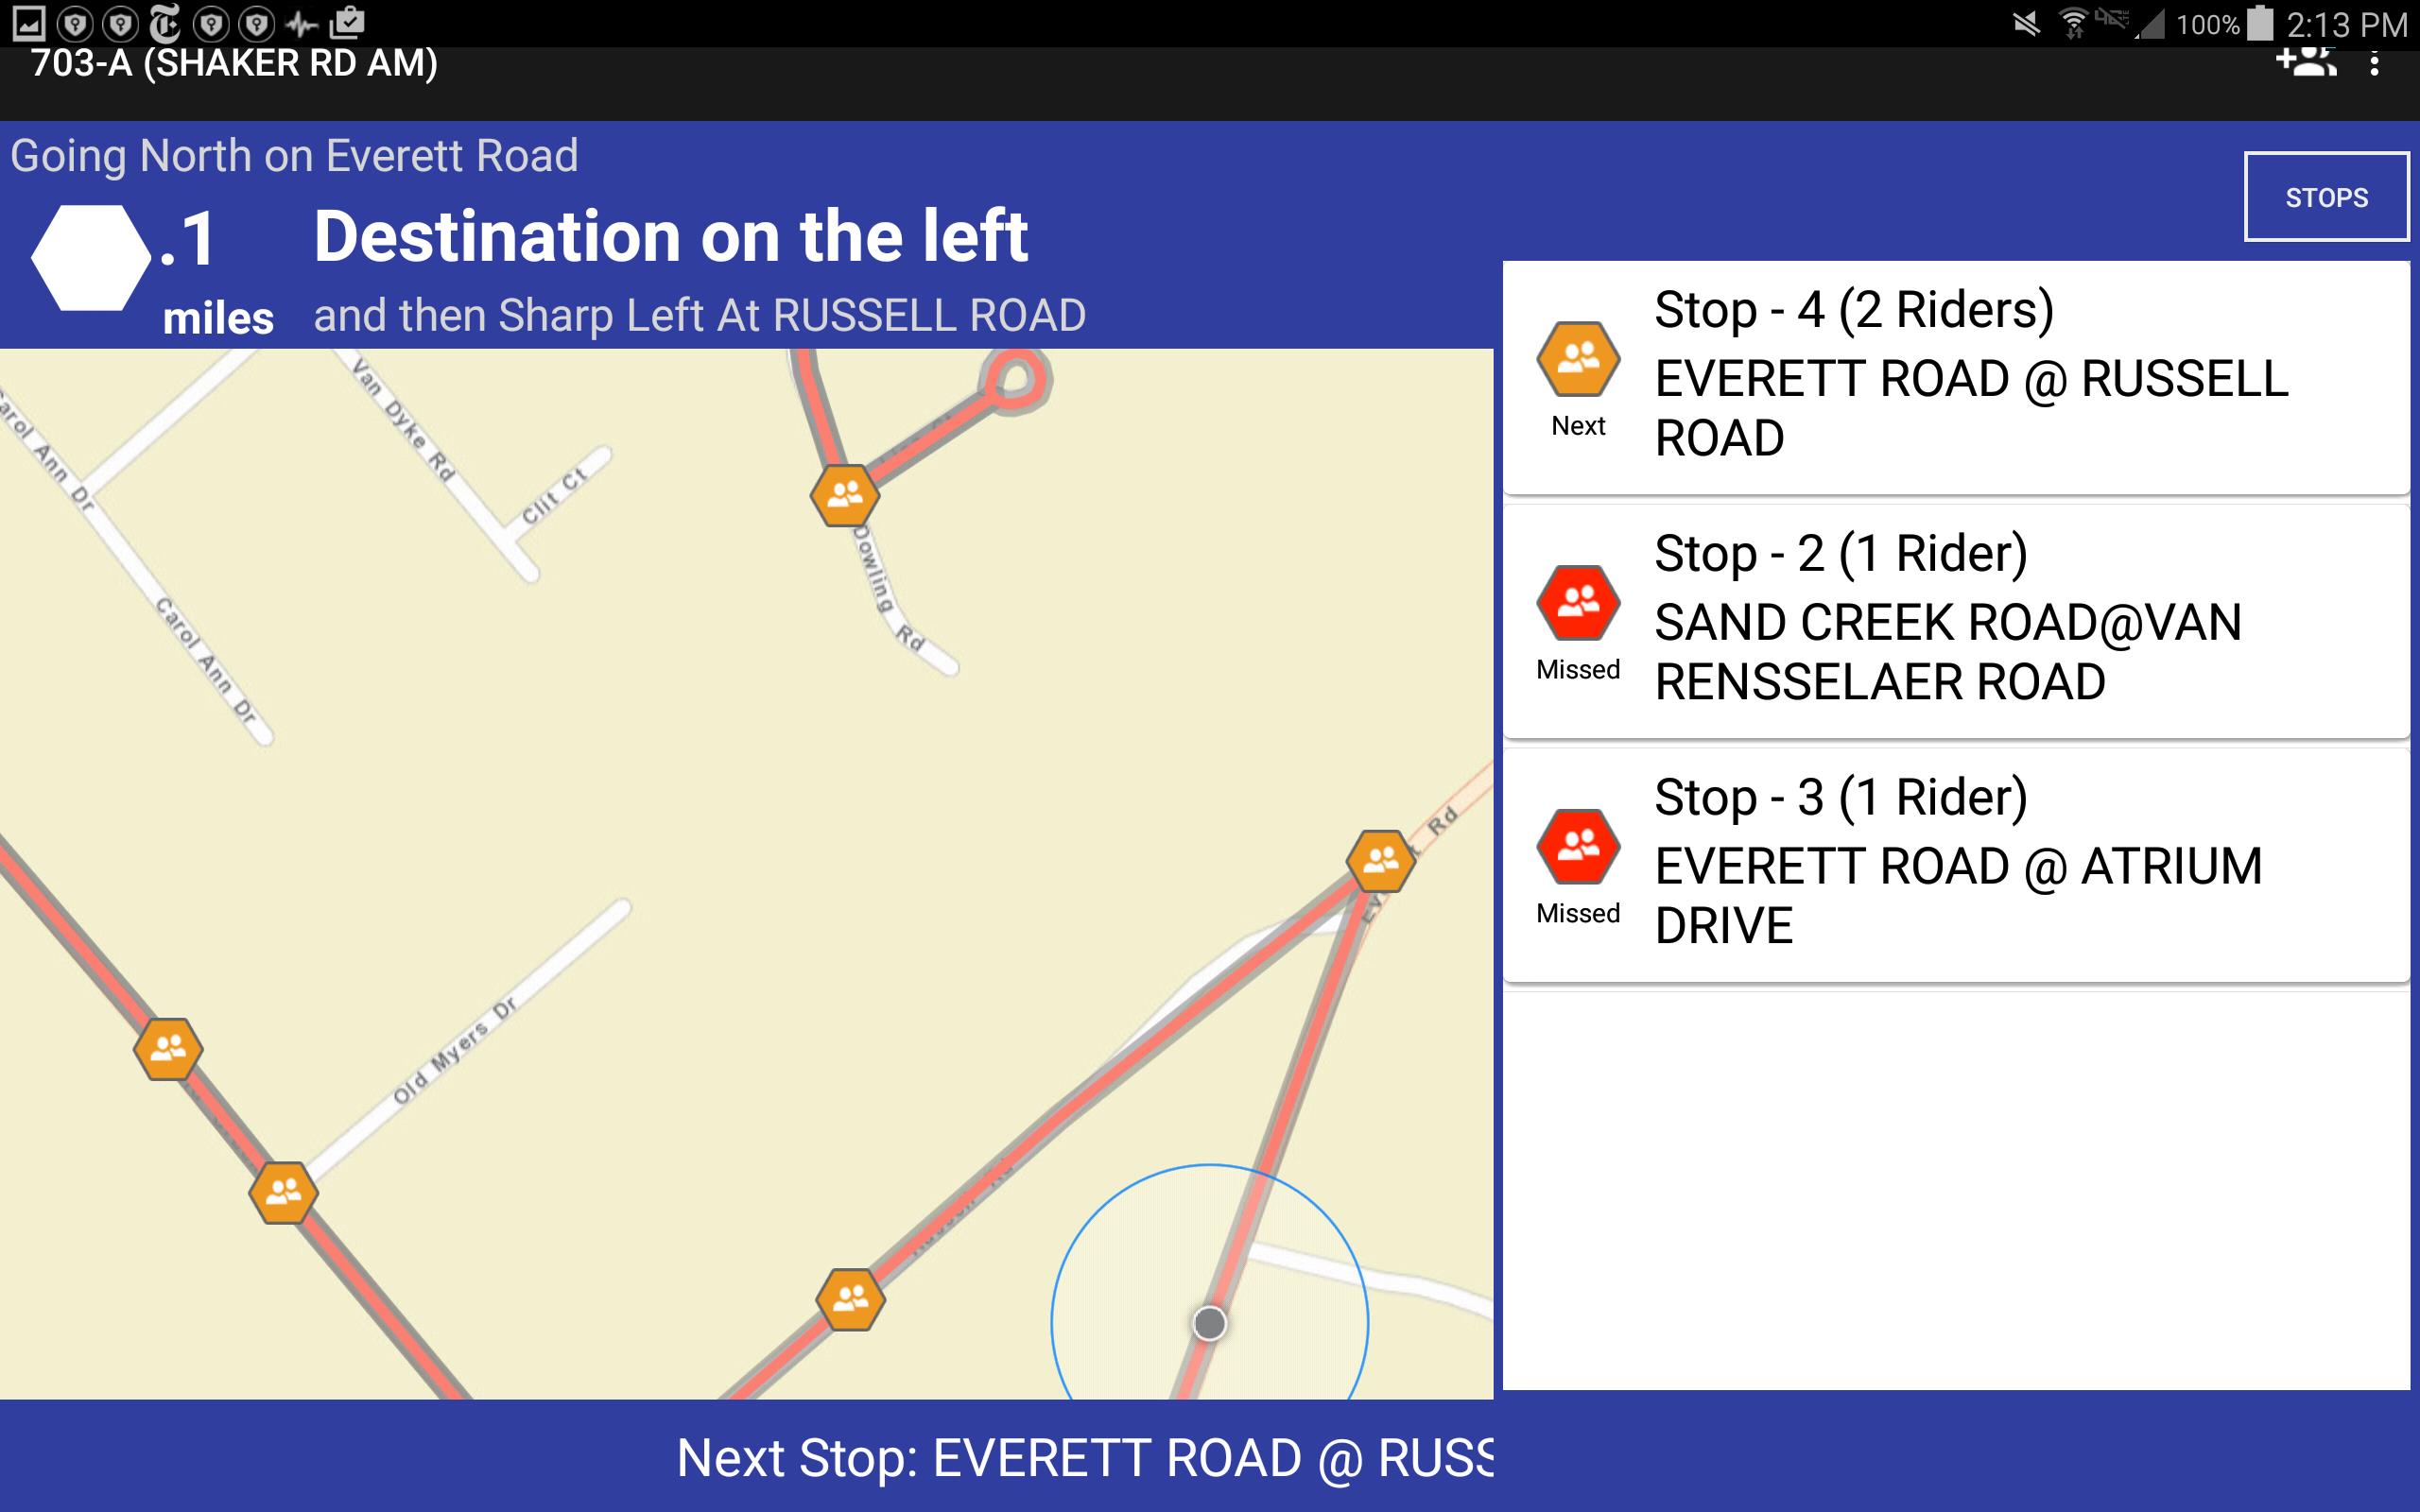
Through integration with Tyler’s student transportation routing and planning solutions, Tyler Drive is able to provide the most comprehensive and reliable route navigation available. Tyler Drive navigation map highlights the planned route with detailed directions to the next stop. If a road is closed, Tyler Drive can redirect the bus to the planned stop. Driver is presented with turn-by-turn directions and a list of students to pick up or drop off as the bus approaches a stop. If the school bus goes off the planned route Tyler Drive re-routes through the shortest path to the next stop in sequence.
TylerTech5

Tyler Drive live navigation assist the bus driver in getting to all the planned stops, picking up students and dropping them off.

Versatrans Suite

Versatrans is a complete school transportation software suite designed to help school districts efficiently and cost-effectively manage day-to-day transportation needs, transporting students to and from their educational programs on time and on budget.

  • Routing & Planning is a multi-user transportation management system that can effectively handle multiple destinations within the District’s demographics.
  • Versatrans Onscreen® is a GPS fleet tracking solution.
  • Versatrans My Stop™ is a mobile application for parents, guardians and students to know exactly where their bus is and what time it will show up at their stop — all from a smartphone or similar mobile device.
  • Versatrans Fleetvision® is a maintenance software to manage district fleet. It can auto-generate work orders, track inventory and organize employee certifications.
  • Versatrans Triptracker® is web-based field trip software, automates otherwise cumbersome processes like driver selection and personnel approval.
  • Tyler Telematic GPS™ is a hardware solution for school buses providing a complete view of vehicle, driver and engine. Tyler Telematic GPS includes: software expandability, driver scorecard, accident reporting, engine data, real-time alerting and more.

Implementation Services

Tyler’s implementation services include training on software functionality and full map preparation, including entering all district schools with grades, other buildings, walk zones, safe zones, bus stops, bell times and more. Tyler gives many options to keep customer maps current, and when the product receives electronic updates from the original map source, functionality is not affected. Tyler’s maps have the ability to utilize GPS information, draw streets simply and accurately, modify street names, and adjust run times to factors like time of day and school bus speeds. The process is automated to provide both efficiency and safety.

Geotab GPS

Tyler has a long standing relationship with Geotab Inc.; the leader in telematic solutions for heavy-duty vehicles. Tyler has been an authorized reseller for the Geotab hardware since 2010 and its close partnership with Geotab over the years has led to Tyler having the distinction as the only partner to have integrated Geotab data within the K-12 marketplace.

Esri Gold Partner

Tyler is an Esri Gold Tier partner, which enabled Tyler to be an industry-leading provider of geospatial solutions and services. As a Gold Tier partner, Esri recognizes Tyler’s commitment to providing enhanced technical and sales support, collaborative engagement and a national and multinational focus. Multiple Tyler solutions use Esri technology, including suites in school transportation, appraisal and tax, planning, permitting and public safety. Tyler has been an Esri partner for more than a decade.  Tyler’s new K-12 transportation solution, Traversa, is based on Esri technology.

 To find more about Tyler Technologies and their office in Latham, New York, visit their website.

CONTACT

Ted Thien
Sr. Vice President and General Manager, Versatrans
Tyler Technologies, Inc.
23 British American Blvd
Latham, New York 12110
Phone: 800.433.5530 ext. 131840
Email: ted.thien@tylertech.com

10 Questions: Dale Morris

Dale Morris is one of New York State’s most recognized and senior GIS statesmen.  With a distinguished civil service career spanning 38 years, he has contributed significantly to the NYS GIS community in many capacities to say the least of directing one of the most established GIS programs in the state at Erie County – and its far reaching influence in western New York.  Ten questions seemed like a slight to an individual with such a body of professional work, so the eSpatiallyNewYork editorial team gave him permission to push it to 15 questions. Or something like that.  Enjoy.

eSpatiallynewyork:  How long have you been with Erie County?

Morris:  I’ve been in the Department of Environment and Planning since 1981. Prior to this I worked as a Planner for the Town of Amherst, NY and before that the Erie and Niagara Counties Regional Planning Board. I graduated from Cornell University with a Master’s Degree in Regional Planning in 1977.

eSpatiallynewyork:  When did you start doing GIS work?

Morris:   Working initially as a Planner for Erie County presented  many opportunities for making and using maps. In the 1980s we were still using Mylar, zipatone, and Leroy Lettering Sets for making maps, which is tedious, time consuming, and not easy to change. I began to investigate the world of digital mapping, which was still in its beginnings as a desktop product. I started with the DOS version of MapInfo. I recall how amazed we all were that we could do something as simple as draw the County and municipal boundaries on-screen. Looking back on it now it all seems so rudimentary!  Regardless of how basic it was, my Division became known for our ability to make computer drawn maps. At that time there wasn’t much concern about the database behind the maps- it was enough to be able to draw and edit maps digitally rather than by hand.

As desktop mapping grew in popularity through the 1990s a number of County departments began independently looking into it. This usually resulted in them calling me to ask for advice or data. Of course, this also meant that everyone was using different systems, and at that time it made exchanging data between systems very difficult or impossible. It was a classic case of disjointed silos of data and applications.

A change in County administration in the late 1990s brought new management in our department, and I was challenged to prepare a white paper for moving the County further forward into the digital mapping world. I proposed creating a new County Division that would be empowered to centralize decisions relating to geospatial technology (by then we could use terms like “geospatial” without getting blank stares!). The Office of Geographic Information Services (OGIS) was born in 2001, and I have been the Director since then. So for me personally, my career started with both feet in the urban planning field, then a gradual shift to one foot in planning and one in digital mapping, and then finally both feet in GIS. I do very little “typical” planning anymore, even though OGIS is part of the Planning Division.

While OGIS is an Office within the Department of Environment and Planning, only a portion of our work is related to this department. We work very closely with our IT shop to maintain and operate the County’s GIS technology infrastructure, and with other departments and outside agencies who either use our enterprise GIS technology or who need direct assistance with their mapping needs.

eSpatiallynewyork:  What’s the relationship between your office and Niagara County?

Morris:  We have a formal Intermunicipal Agreement (IMA) with Niagara County for GIS Services. The agreement is for a five year period and we are well into the second of these five-year agreements. Erie County hosts Niagara County’s geospatial data and provides on-line mapping services to Niagara County. The two counties are connected by a high-speed microwave link, which operates very well. In essence, Niagara County is simply like any other Erie County department that taps into the Erie County enterprise GIS network. In addition to providing Niagara County this service for a fee, the IMA provides a framework for backup of GIS data between the two counties, and as well defines a GIS “mutual aid” protocol for sharing of GIS resources and staff in the event of an emergency.
Continue reading

Queensbury Geospatial: A Model for NYS Town Government GIS

Northbound New York State Northway Exit 20 leads to the Town of Queensbury which is the seat of Warren County.  With a 2010 population of 27,901 the town covers nearly 65-square miles including shoreline along Lake George and lands within the Adirondack Park.  Further into town, several of the usual NYS town government program offices are located at 742 Bay Road including staff and resources which support the town’s geographic information system (GIS).

GIS Background

Prior to 2002, Queensbury officials had worked with consultants to establish initial GIS capacity including the creation of ArcIMS applications and investing in multiple ESRI desktop licenses.  In 2002, the town’s GIS initiative changed significantly with the hiring of George Hilton.  Hired as a GIS Specialist and planner, George was brought onboard to build and advance the town’s  GIS program.

Prior to arriving in Queensbury, George had honed his GIS skills while a student at Central Connecticut State University and later in government positions  in the Denver and Kansas City areas as well as three years with Westchester County.  Now, 15-years after his arrival, George oversees a program which can be considered an exemplary NYS municipal government GIS program.

Current Queensbury Geospatial Products and Infrastructure        

George designs, codes and maintains the Town’s Interactive Mapper (Firefox and IE only) and a host of other ArcGIS.com map viewers including Fire and EMS, Planning and Zoning, and Phase II Stormwater Infrastructure.    He also supports emerging mobile mapping and data collection efforts which includes Trimble GPS units with Trimble Positions to collect data and update feature services and Geodatabases in the field.  The town also collects data (hydrant inspections, site inspections) with ArcGIS Collector using feature services and make maps available through ArcGIS Online.

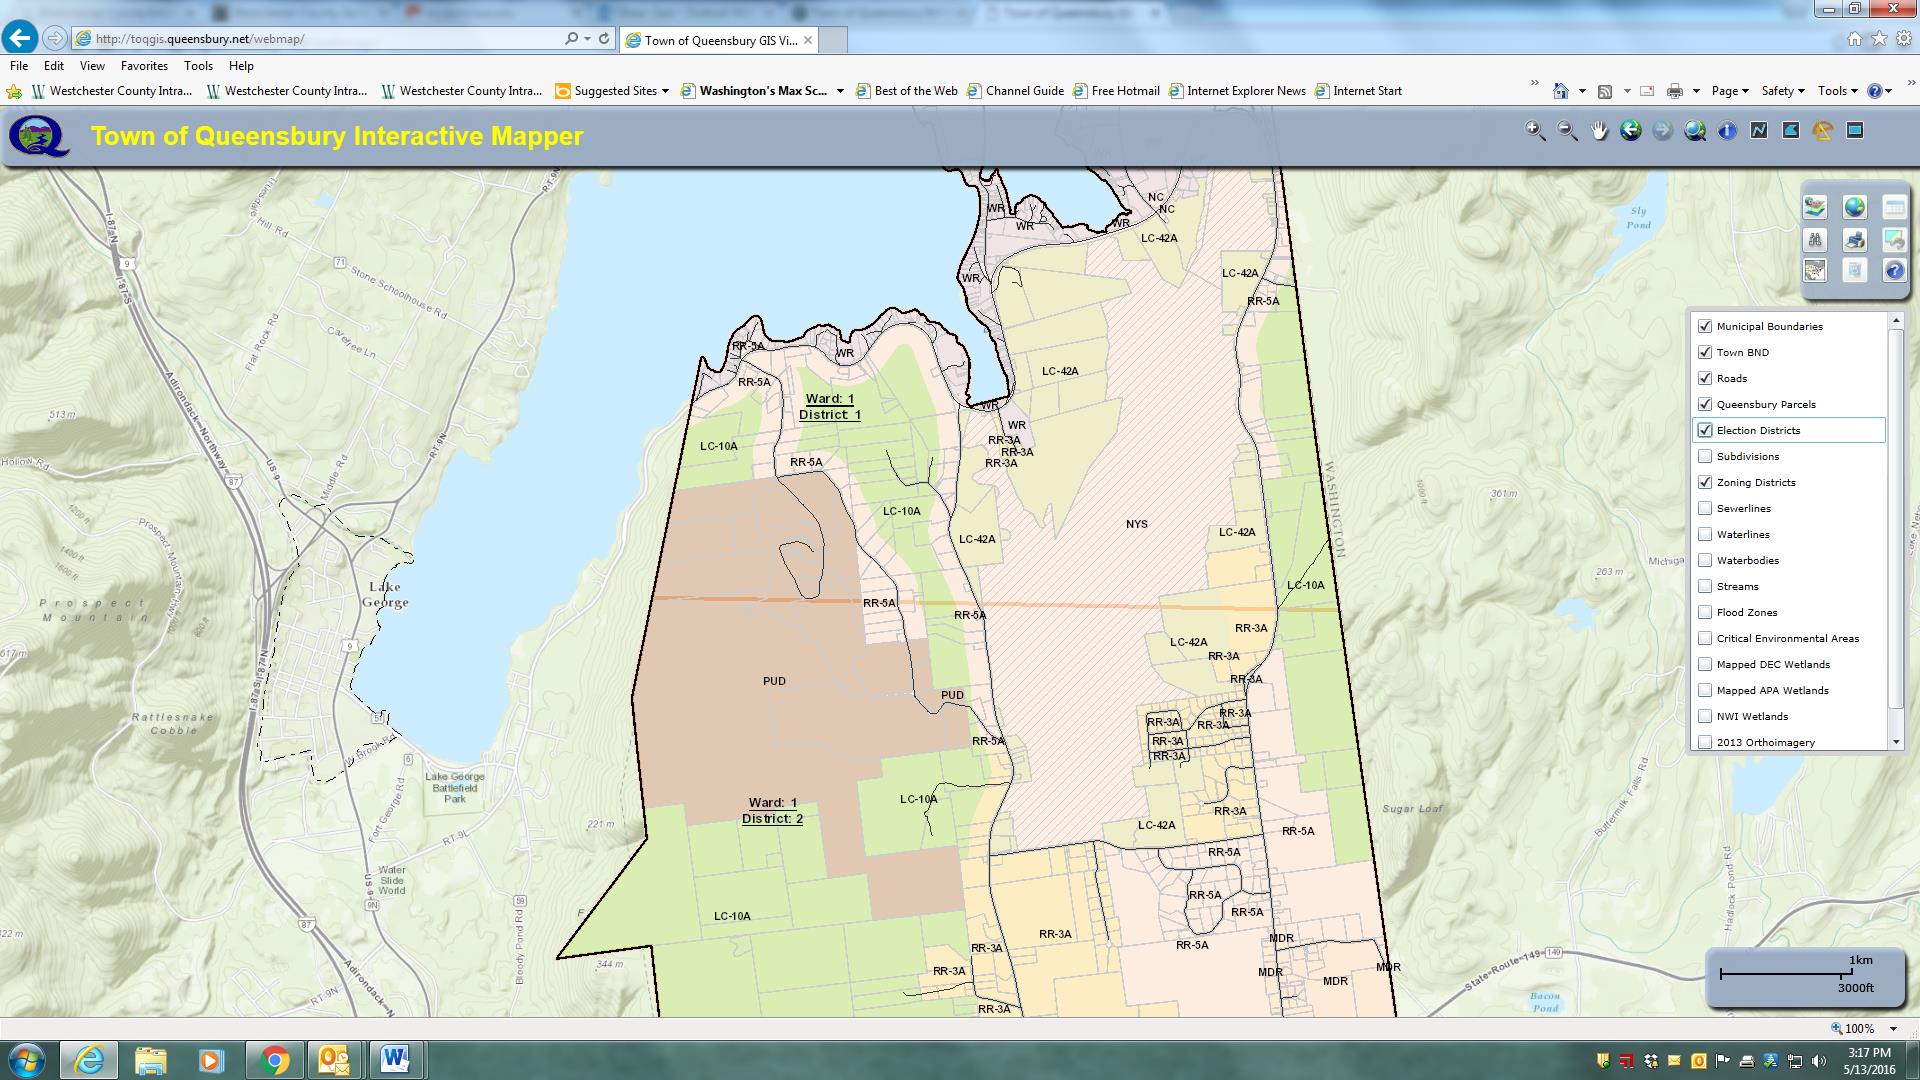
The Town of Queensbury Interactive Mapper includes many locally developed datasets as well as data from other authoritative sources including Warren County, NewYork State and the Adirondack Park Agency.

The Town of Queensbury Interactive Mapper includes many locally developed datasets as well as data from other authoritative sources including Warren County, NewYork State and the Adirondack Park Agency.

Other software components – much of which has been self-taught – George uses inlcludes Sybase (RPS) and SQL Server with ArcSDE as well as ArcGIS Server, ArcSDE, ArcGIS (Advanced), and Spatial Analyst.  The town is currently at ArcGIS Server 10.22 and are testing 10.4 with plans to upgrade very soon.  He also works with QGIS and Global Mapper from time to time.  Global Mapper has been particularly helpful in importing updated USGS topo quads (DRGs) in GeoPDF format into our GIS.

The Queensbury GIS program has grown from primarily providing support to the Planning Department to becoming a very important resource for many departments across town government.  Both the Town Board and Town Supervisor are very supportive of GIS and recognize how much of an important tool GIS has become to the Town.

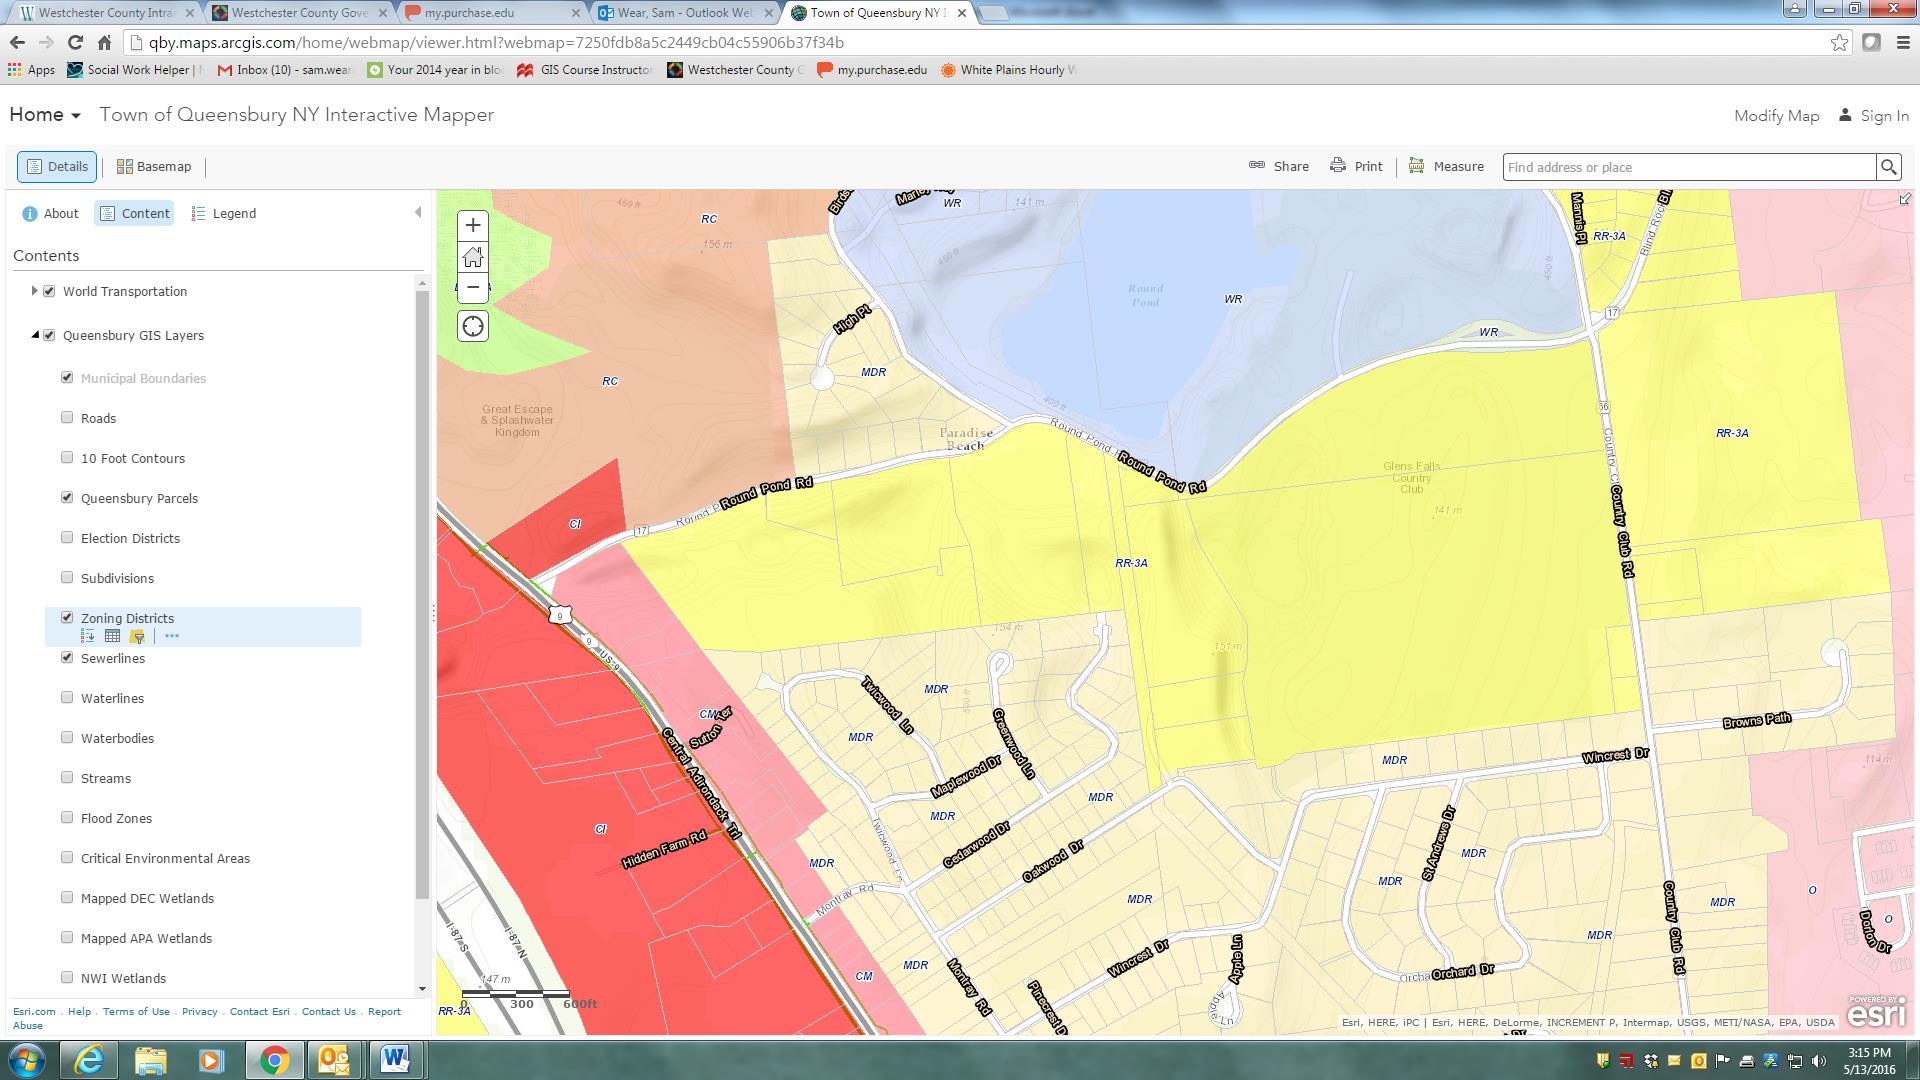
Parts of the Town of Queensbury is actually within the Adirondack Park and therefore subject to stringent land use regulations. This image highlights zoning districts on the southeastern shore of Lake George – within the park boundaries.

Parts of the Town of Queensbury is actually within the Adirondack Park and therefore subject to stringent land use regulations. This image highlights zoning districts on the southeastern shore of Lake George – within the park boundaries.

George maintains an excellent working relationship with Warren County GIS which is under the direction of Sara Frankenfeld where he obtains  parcel data.  The town creates town-wide datasets (zoning, subdivisions, hydrants, infrastructure, environmental, street centerlines, address points, etc) which are then shared back with the County. Referencing her ongoing GIS work with Queensbury, Sara explains:

“George is great to work with and especially in a rural environment where we don’t have any other full-time GIS staff within our respective local governments, it’s so helpful to have a colleague to bounce things off.  He’s a very good sounding board and when I’m considering starting a new project, I often call to get his thoughts.

 We’ve worked closely together on a number of projects.  We recently worked together to streamline the way e-911 addresses are assigned, and this has been a huge improvement to workflows in both of our offices, as well as in the Real Property office, the zoning/building inspectors departments, and the assessors’ offices

 Our current cooperative project is a NYS Archives LGRMIF grant funded project to make the SAM data, along with information about truss roofed structures (as required by a NYS law that went into effect 1/1/2015), and other relevant data such as hydrant locations, available to first responders via an Android/iOS app”.

George also works closely with several state agencies including the Adirondack Park Agency, NYS Parks and Historic Preservation, NYS Department of Environmental Conservation, and NYS Information Technology Services (ITS).  Queensbury Town Supervisor John Strough adds:

“Like today’s computers, I do not know how we lived without him. His GIS services have helped us map the town’s infrastructure structures, trail systems, historic places and many other location details that we absolutely need to comply with the needs of today’s municipal world. I am in his office requesting his services almost as often as am in my budget officer’s office, that’s how important GIS services have become to the town.

Broad User Base

The town enjoys a wide user base including ESRI desktop clients in Planning, Water and Sewer, Assessor, and Parks departments though George is commonly called upon to assist in more detailed data creation, analysis, and cartographic products throughout town government.  He also provides training for users in many local, regional and statewide agencies including the Warren County Soil and Water Conservation District, the Champlain Watershed Improvement Coalition of New York, and the NY State Conservation District Association at their statewide conference in Auburn and Syracuse.

Additionally, George provides maps and data analysis for many community groups, nonprofits, schools, as well as for other municipalities and quasi-governmental agencies in the area.   Queensbury if one of the few municipalities in the area with a GIS program and is often asked to provide support throughout the area.

Creating More Queensbury GIS Programs

While George brought years of GIS experience to the town when accepting  the job, his ability to advance the town’s GIS program has certainly been augmented by ongoing political and administrative support.  Such combination of experience, competitive salary, technical skills and political support is often hard to replicate –   or even find for that matter –  in small town governments across the Empire State.

The Town of Queensbury GIS program speaks to the importance of educating elected officials in the benefits and  importance of investing – both financially and institutionally –  in the role of geospatial technologies in small town governance.  While the Queensbury GIS solution might be considered a typical for similar-sized communities across the state, it nonetheless can be a model for the GIS community to aspire to and replicate.

Visit the Town of Queensbury website at http://www.queensbury.net or George Hilton directly at GeorgeH@queensbury.net.


2016 NYS Spring GIS Conference Specials

With my March Madness bracket already busted just four days into tournament play and watching anymore games for the most part pointless (Syracuse in the Sweet 16, really?),  combined with winter returning and getting out on the golf course also not an option, it seemed like a good time to sit down and compile my annual plug of regional one-day GIS conferences and meetings around the Empire State over the next 4-6 weeks.

Most of the Spring 2016 shows are held in locations accessible via a maximum 2-4 hour drive from all parts of the state, offer a wide range of geospatial topics and presentations, provide excellent networking opportunities among colleagues and industry representatives, and are generally light on the wallet.    And for the GISP folks, most of the shows also provide certification credits.

Sounds pretty good, right? So consider the following options:

GIS-SIG 25rd Annual Conference, April 12th, Burgundy Basin, Pittsford, NY.  Its unfortunate I cannot make GIS-SIG this year as it is one of my most favorite statewide one-day shows.  GIS/SIG provides the premier geospatial professional forum in the Rochester/Genesee Finger Lakes/Western New York region for GIS practitioners focusing on trends and policies relating to new geospatial technologies and current projects.  With a loyal membership and Board of Directors, the size and content of the GIS/SIG conference is broad enough to often substitute as an annual state conference for many GIS practitioners in the western half of the state. This year’s conference again includes vendor displays and an agenda covering topics such as drones, open source, and mobile apps among others as well as a keynote address by Steve Coast, Founder of OpenStreetMap.   Corporate sponsorship keeps the price tag of an individual registration at under a $100 for the day which also includes lunch. Online registration is available and while you are at the GIS/SIG website you can also see the many resources and links GIS/SIG provides to its user community.  This is a great show and if you have the opportunity to attend, I highly recommend it.

Long Island GIS (LIGIS)  2016 Spring User Conference, April 15th, SUNY Farmingdale, Farmingdale, NY.  LIGIS meetings and conferences have grown in structure and content recently and this spring’s April 15th meeting is anticipated to illustrate these continued improvements.  And the big plus for the Long Island GIS community is that the show is free.   While the agenda is close to being finalized, already confirmed is a U.S. Census Bureau “Map Tab Lab” workshop, plans for a user-submitted map session, and anticipated presentations from government, nonprofits, and industry.    Those interested in attending can monitor conference specifics at the LIGIS homepage.  Located in central Long Island on the SUNY Farmingdale campus, this is a not-to-miss conference for the  extended GIS/geospatial community on “the Island” with limited travel budgets.  Make plans to attend.

Northeast Arc User Group (NEARC) Meeting, May 9th, University of Massachusetts, Amherst, MA. Though not in New York State, the 2016 Spring NEARC meeting is conveniently located in Amherst, MA which is easily accessible to the Albany Capital District and GIS professionals in eastern New York State. Once considered the smaller venue of the NEARC suite of meetings, Spring NEARC grew too large at its original site and moved to the conference center at the University of Massachusetts which actually hosted the annual NEARC conference in the early 1990s.   Unlike the GIS/SIG conference which is software vendor independent, this show is very much ESRI centric though is packed with high quality user presentations. Even though only one day, the show  has grown to be so popular that it now competes with the larger multi-day GIS shows and conferences across New England.   Price tag for attending:  $65 which includes lunch.  If you can afford an overnight, activities the evening before downtown Amherst and a hotel room at the UMass conference center make it even more worth your while. (As of the day of this blog post, the May 9th agenda was still in development.)    If your organization is an ESRI shop – this is a Spring show not to miss.

Westchester GIS User Group Meeting, May 12th, Purchase College, Purchase New York. As one of the largest geospatial meetings in New York State, the Westchester GIS User Group Meeting is a free one-day conference held at Purchase College. Made possible by financial support from exhibiting vendors and conference facilities provided by the college, the 2016 agenda tentatively includes user presentations from a geospatial start-up company, Westchester County municipalities, nonprofits, and industry representatives. There is also a  student project contest and post conference training in building Story Maps led by Westchester County GIS staff and a Bring Your Own Device (BYOD) workshop with instructor Austin Fisher.   The Purchase College location provides easy one-day access across the metropolitan NYC area, as well as the broader lower Hudson River Valley and southeastern Connecticut. Agenda and other meeting specifics – including registration – is available from the Westchester County GIS website.

So, if travel expenses are once again limited and/or at a premium, no problemo.  The entire Empire State GIS community is fortunate enough to be close enough to a range of regional geospatial meetings and conferences which are accessible from most areas of the state and provide many of the same benefits of larger shows.

Safe travels!

The Blue Highways of GIS: Seneca Nation of Indians

Location

The Seneca Nation of Indians (SNI) is a federally recognized tribe located in what is now Western New York State.  It consists of five territories.  These territories are adjacent to the counties of Allegany, Cattaraugus, Chautauqua, Erie and Niagara in an area of the state where communities are primarily rural in geographic location. The territories are not contiguous and each is unique in its economic, social, and environmental profile.  With 53,947 acres, the Seneca Nation controls and holds a significant land base in Western New York. The Seneca Nation of Indians traditionally lived in New York between the Genesee River and Canandaigua Lake and as far south as northwestern Pennsylvania and Eastern Ohio; however, currently the Nation is located strictly in the Western New York area.

In two different offices (Irving and Salamanca) nearly forty miles apart, Nation GIS staff communicate daily on a wide range of tribal GIS projects.   The GIS Division is a part of the Community Planning and Development Department.  The SNI-GIS Team consists of Ms. Gerri Jayne Jimerson GISP (tribal member) who has served the Nation for nearly 14 years, Todd LaQuay GISP, who covers the Cattaraugus Territory and has been with SNI for 11 years, as well as Trever Annis who handles GIS duties on the Allegany Territory. Continue reading