Background
In 2008, friends, hackers, open data/open government enthusiasts, and other professional acquaintances began to gather and discuss the state of open governance in New York City and created the NYC Open Government Meetup by Hailey Austin Cooperrider. In 2009, this group was relaunched as the Open NY Forum under the leadership of Philip Ashlock, Cooperrider, and Noel Hidalgo. Over the next 3-4 years, the group met periodically to discuss and push for an Open Data agenda in the city.
The movement and discussion on open data in the metropolitan region was augmented by ongoing work of Council Member Gale A. Brewer who at the time was Chair of NYC Council Committee on Technology in Government and was campaigning for an Open Data statue for the City of New York. In June 2009 she hosted a public hearing on open data standards legislation. Another public hearing was held in June 2010. The law has finally passed, and was signed into law by Mayor Bloomberg on March 7 2012. In 2013 and after New York State Governor Cuomo launched Open NY, the state’s Open Government initiative, the group renamed to BetaNYC.
In 2013 the BetaNYC community embarked on a five borough tour and authored The People Roadmap to a Digital New York City – and agenda setting publication identifying community values and 34 ideas for successive administrations and Council to work on. Since this this time, BetaNYC and the civic tech community have seen several policy and legislative victories — better Freedom of Information tools, NY City Record Law, expanded Mayor’s Office of Data Analytics (MODA), and the expansion of civic innovation challenges.
During the same time period, the City of New York partnered with Code for America to enlist a team of fellows to build technology to address criminal justice issues as well as initiating a search to hire a local community organizer. Noel Hidalgo was hired to fill this position and bringing a broad understanding and connections with the open data/open government community across New York City as part of his involvement with betaNYC. It was at this time BetaNYC became Code for America’s official NYC brigade.
In 2015, BetaNYC became a “Partner Project” of the Fund for the City of New York (FCNY) continuing its mission to “improving lives in New York through civic design, technology, and data.” A purpose which clearly augments the New York City Open Data program, though with a uniquely different and more clearly refined focus on community groups and city residents. As FCNY had been one of the organizations supporting the City’s first data datalog, being a Partner Project had enabled the city’s efforts towards open government and open data to come full circle.
With FCNY as fiscal sponsor and Noel being selected as a fellow at Data & Society, BetaNYC began work with the Civic Innovation Fellowship program out of the Manhattan Borough President’s Office. BetaNYC and the FCNY have continued the partner project relationship. As of April 2017, the Alfred P. Sloan Foundation has provided the funding for the Civic Innovation Fellowship program, and the FCNY continues to manage those funds.
BetaNYC Today
BetaNYC supports a broad range of programs focusing on geospatial-focused efforts in the city’s civic technology arena, open data, and community neighborhoods. Of particular focus in their outreach and mission are the city’s community boards which are the appointed advisory groups of the community districts of the five boroughs. There are currently 59 community districts: twelve in Manhattan, twelve in the Bronx, eighteen in Brooklyn, fourteen in Queens, and threehttps://communityprofiles.planning.nyc.gov/ in Staten Island.
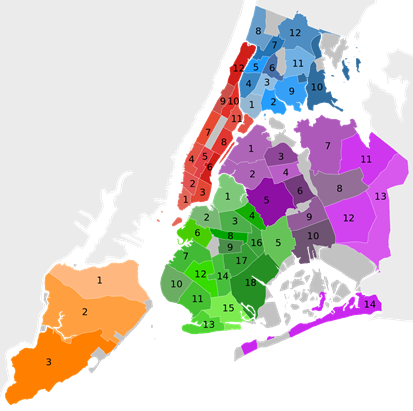
Manhattan’s 59 Community Districts covering the five boroughs
Data
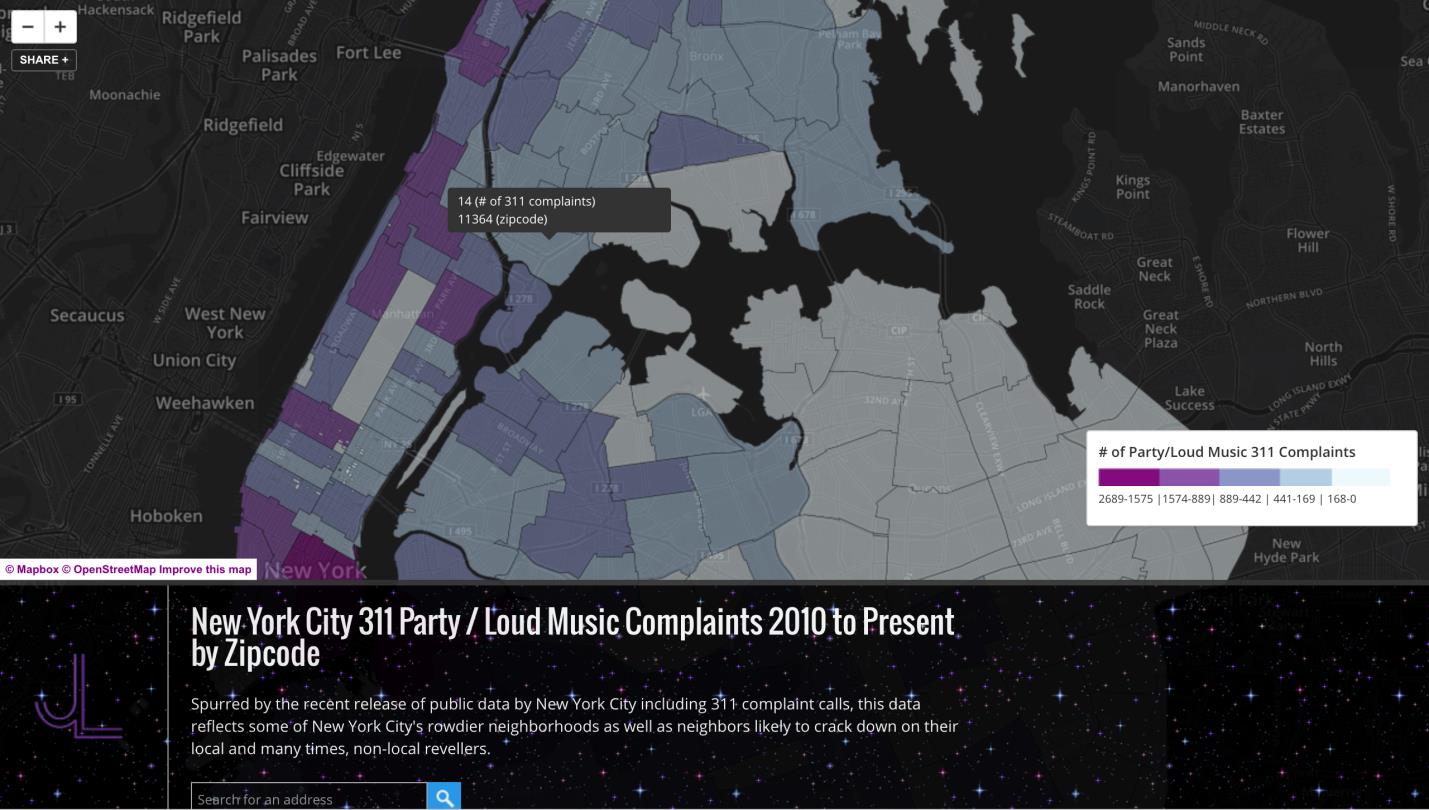
At the core of BetaNYC’s offerings is its data portal which currently includes 130 datasets (BetaNYC sponsors 27) from 22 different organizations. The interactive portal offers developers and individual users access to a wide range of data formats. Illustrative of their work in advocating open data and access, BetaNYC sponsored its third NYC School of Data conference on March 3, 2018. This community-driven conference included conversations, panels and workshops intended to empower community members to improve neighborhoods across the city. The conference is framed to celebrate NYC’s transformative open data law and International Open Data Day, while kicking off NYC’s second annual open data week. Conference attendees are encourged to participate in #hackhall — a daylong open space for open source civic & government technology projects. In the #hackhall, attendees collaborate, connect to new libraries/projects, and improve open source projects.
BetaNYC’s data catalog is leveraged to support the development of apps, websites and visualizations. Selected datasets are featured in media articles, news reports and blog posts across the region and are highlighted in the Showcases collection on their website.
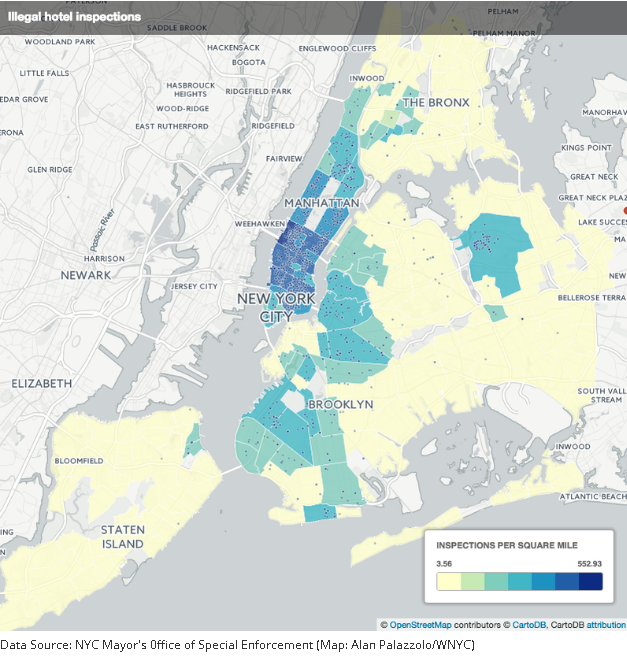
A BetaNYC Showcase: WNYC: When Inspectors Look for Illegal Hotels
Programs and Activities
Community Boards
As the result of a three year partnership with the Manhattan Borough President’s Office, BetaNYC designed tools and customized trainings specifically intended to help Community Boards access, analyze, map and use data to inform decision-making. The workshop introduces the easy-to-use BoardStat tool to query NYC 311 – service requests and explore trends in health, safety and quality of life concerns. BoardStat is designed for community. Not only does BoardStat empower a community board staff and its members to gain timely insights, it is furthering the Manhattan Borough President’s long-standing goal of making government transparent and responsive, reactive, and moving beyond open data access to meaningful use. BetaNYC’s most recent event in this space was March 5th. Examples of documents and materials used as part of this BetaNYC training session are available in this Google Drive shared folder.
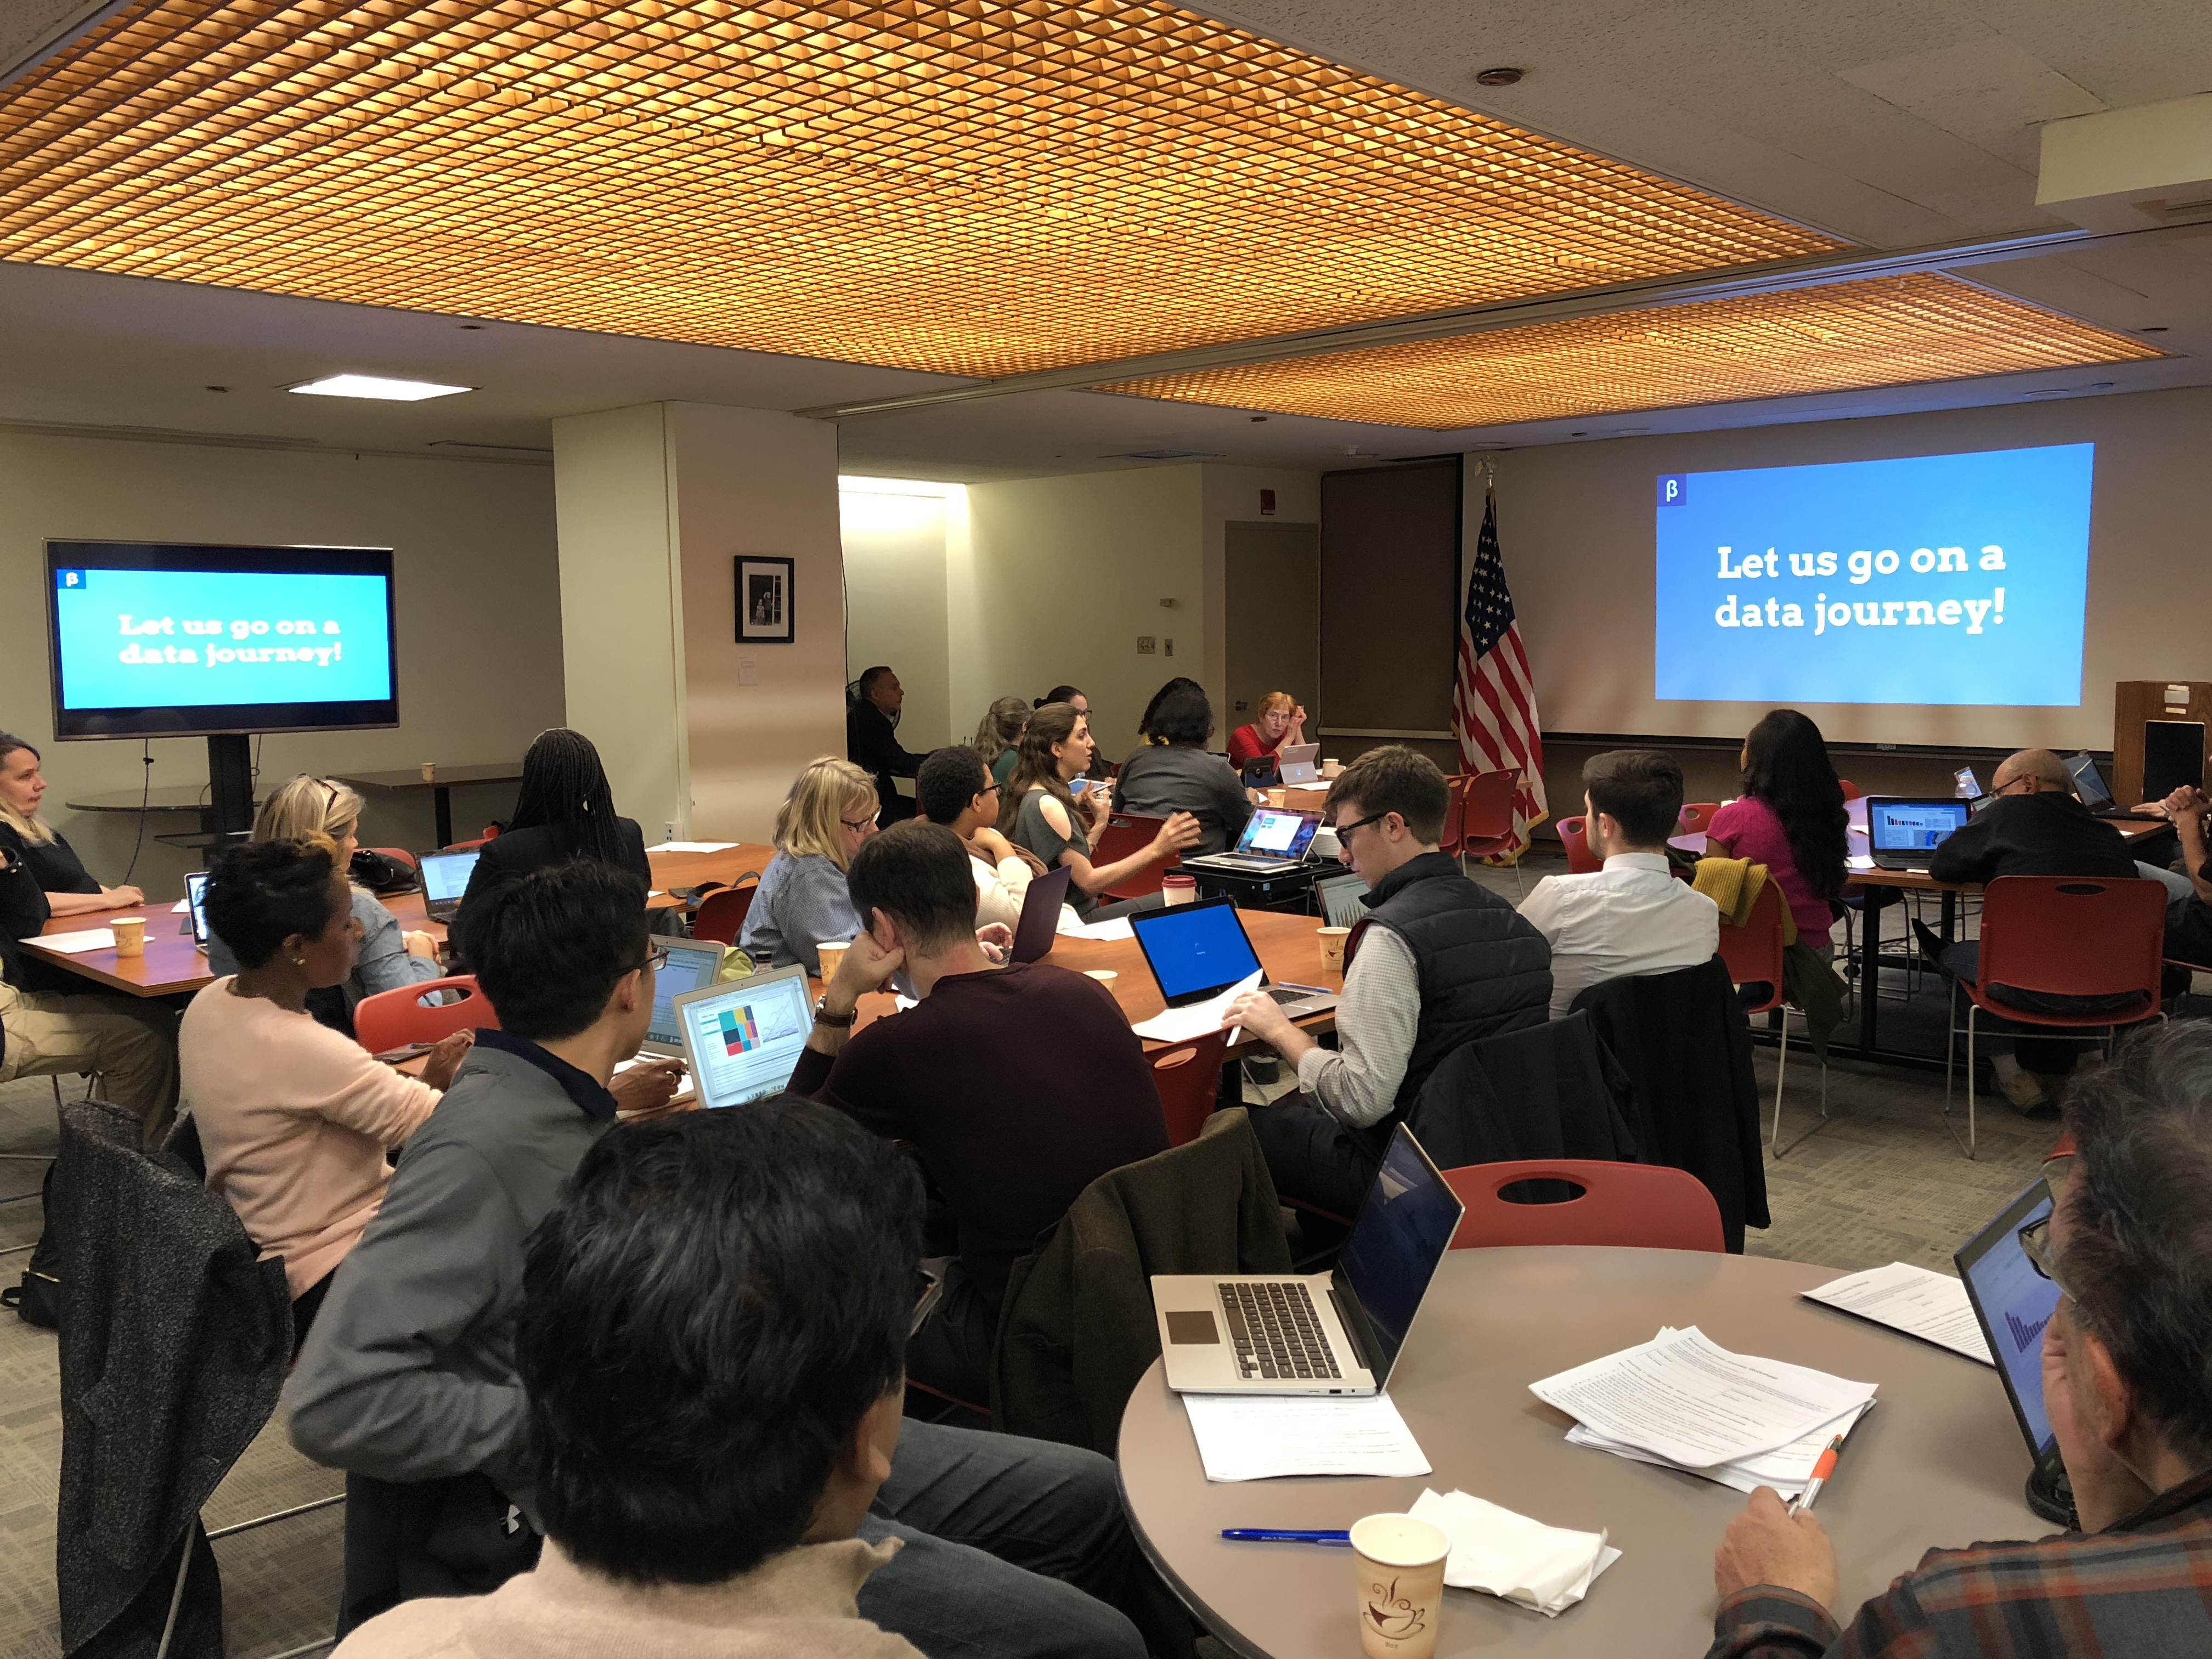
Attendees at BetaNYC’s School of Data March 5th focusing on NYC Community Boards
#BetaTALK – Affordable Housing: Data, Policy, People
In July 2016 BetaNYC hosted a lunchtime discussion at Civic Hall centering on the topic of affordable housing in New York City. The event was to share knowledge about this extremely important and complex topic focusing on a wide range of housing-related topics (and data) including, but not limited to, rent-stabilization, New York City Housing Authority and Section 8 voucher statistics, proposed building plans and Landmark Laws, and NYC government datasets such as Pluto, ACRIS, Department of Buildings, and the Dept. of Housing Preservation and Development as well as the American Community Survey among others. Other BetaTalks are available for viewing on YouTube.
BetaNYC is committed to continue the conversation and help the Civic tech community grow ideas, analyses, and projects on this topic by building more accountability, clearer, and up-to-date information on rents across the City at a highly localized level, since differences can be stark between blocks, buildings, professional even within buildings.
Testimony & Advocacy
On behalf of BetaNYC, Executive Director Noel Hidalgo frequently provides expert testimony to the New York City administration and legislature on a wide range of open data/open source, new technologies, and government transparency issues. BetaNYC has been instrumental in Over the past 18 months, illustrative efforts in this context include presentations on the Automated Decision Systems Local Law 49, testimony on both the Open Data Examination and Verification Report, and Intro 1696-2017 (Open Algorithms Bill).
Data Jams
Data Jams are occasional BetaNYC “hands-on” events focusing accessing and interpreting specific NYC government program datasets. Recent Data Jams have centered on program data from NYC311, NYC Dept. of Planning, and NYC Parks.
NYC School of Data
Held in conjunction with NYC Open Data Week (March 3-10, 2018), BetaNYC’s School of Data is a community conference showcasing NYC’s civic design, civic/government technology, and open data ecosystem. It seeks to build a framework of relationships that can demystify data and technology, foster democracy, build cross-borough relationships, and mentor a new generation of civic leaders. 2018 topics focused on four key areas: digital literacy & privacy, smart & wise cities, effective & open government, and lastly, civic
Summary
BetaNYC continues to champion the open data and government transparency intersection in New York City. Best illustrating how grassroots efforts can have significant and game changing impacts on public policy in the new technologies realm. For the taxpayers and by the taxpayers.
Their broad catalog of programs and activities offers many opportunities for involvement much of which is centered around their long-standing and highly visible BetaNYC Meetup platform. And by extension, collaboration with several other Meetups (GeoNYC, New York Tech, Civic Hall) Code for America, Coalition for Queens, Dev Bootcamp, OpenPlans, Silicon Harlem, NYC Digital, NYC Mayor’s Office of Data Analytics, NYC Mayor’s Office of Technology and Innovation, NYC’s Department of Information Technology and Telecommunications, and NYC 311 has broadened its footprint as well. While this critical mass of geospatial infrastructure, to say the least of visible and strategic political support, has contributed to the development of BetaNYC’s success and unique position on the Manhattan geospatial landscape, it can serve as a model to other metropolitan areas across the Empire State in establishing frameworks for similar open data and civic technology causes.
We are pleased to have BetaNYC on our agenda for this year’s Westchester GIS User Group Meeting May 17th at Purchase College. We anticipate considerable discussion and attendee involvement focusing on open data and government transparency as part of our “GIS for “Resiliency and Sustainability” theme. The BetaNYC community is encouraged to attend.
For more information, BetaNYC contact Noel Hidalgo and Emily Goldman or visit the betaNYC website.


