New York City nonprofit uses GIS to help support cooperative and community-led development projects as well as advocacy campaigns
Introduction
Nonprofits are one of my favorite areas to cover in the geospatial space. More than not their geospatial efforts operating on a shoestring budget, relying mostly on filtering through open data portals and mashing everything together to create visual products with open source software or via discounted vendor supported nonprofit software licensing agreements. Its not uncommon to find the person(s) doing spatial analysis and map making having been self-taught. A lot gets done with a little.
One such organization is the New Economy Project (NEP) located in New York City. NEP works with community groups to build a new economy that works for all, based on principles of cooperation, democracy, equity, racial justice, and ecological sustainability. Their focused campaigns are carried out in concert with community, labor, civil rights and social justice groups on initiatives such as:
- Public Bank NYC, a municipal public bank campaign rooted in economic and racial justice. Through public banking, NYC can divest from Wall Street banks, reinvest public deposits to support equitable and cooperative development.
- Advancing Community Land Trusts, through co-leadership of the NYC Community Land Initiative (NYCCLI) and one-on-one work with community groups seeking to organize community land trusts.
- Advancing NYS Community Equity Agenda, calling for transformation of the fundamentally unjust social, political and economic systems. The Equity Agenda puts racial and economic justice front and center and addresses long-standing inequities that play out at neighborhood and regional levels.
- Growing NYC’s Cooperative Economy through coalition-building and policy change that supports and brings together community land trusts; worker, housing, financial and food co-ops; and other models of cooperative, community-led development.
GIS and Mapping
Behind all of the mapping at the New Economy Project is Ben Hagen who currently serves as Senior Research and Communications Associate. “As much of our work focuses financial services, a considerable amount of our data comes from the Federal Deposit Insurance Corporation (FDIC)” Ben notes, “and more specifically from the Summary of Deposits section.” Ben does all of his mapping and data analysis with ArcMap having learned the craft as part of his graduate work in Urban Planning at New York University. Other data sources frequently used by NEP include the U.S.Census Bureau, New York State Department of Financial Services, New York State Office of Court Administration, and NYC OpenData.
NEP uses use ESRI’s World Geocoding Service to support most of its address mapping though in the past had also used the city’s LION file. In addition to ArcGIS, the main other data-related software NEP uses is open source software R for cleaning data, especially when preparinfor for mapping. Hagen likes R software because it runs on text-based code and is great for replicating processes with minimal opportunities for introducing errors, as well as for easily sharing with others for a second look at methodology.
Samples of NEP mapping products include (click image for map download).
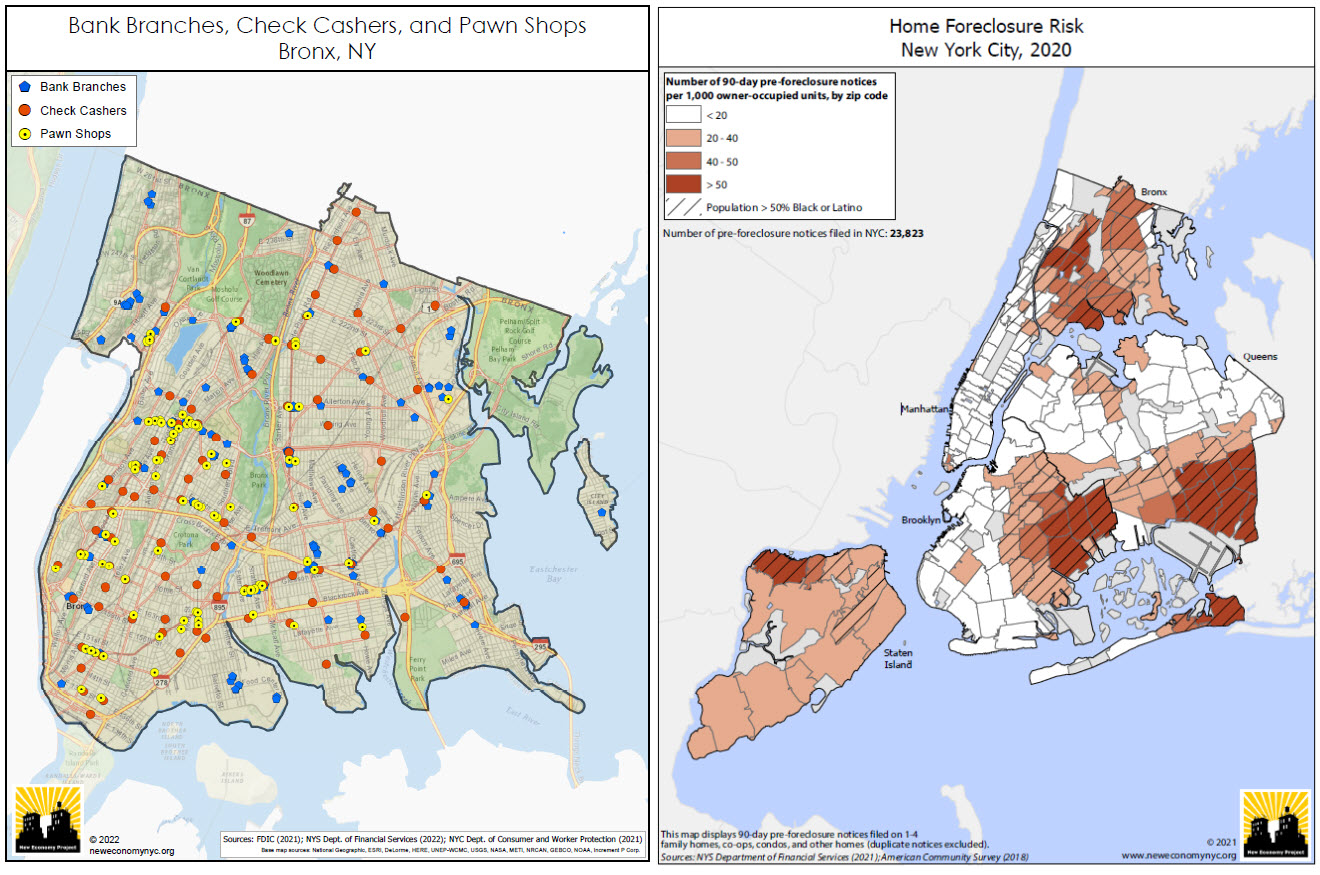
(Left Image): Bank branches are not distributed and made accessible evenly across the city. This map depict the relative absence of bank branches in the Bronx, and the resulting concentration of high-cost alternatives such as check cashers and pawn shops. This is a series of maps that NEP updates every year covering most (if not all) of the city’s neighborhoods. (Right Image): NEP creates maps showing the concentration of residential foreclosure risk in NYC communities of color. This uses data from the NYS Dept. of Financial Services, based on notices that mortgage servicers are required to send to delinquent borrowers 90 days before initiating a foreclosure action. While not all of these notices result in an eventual foreclosure, it provides a good indication of where the risk of home foreclosure is highest in the city.
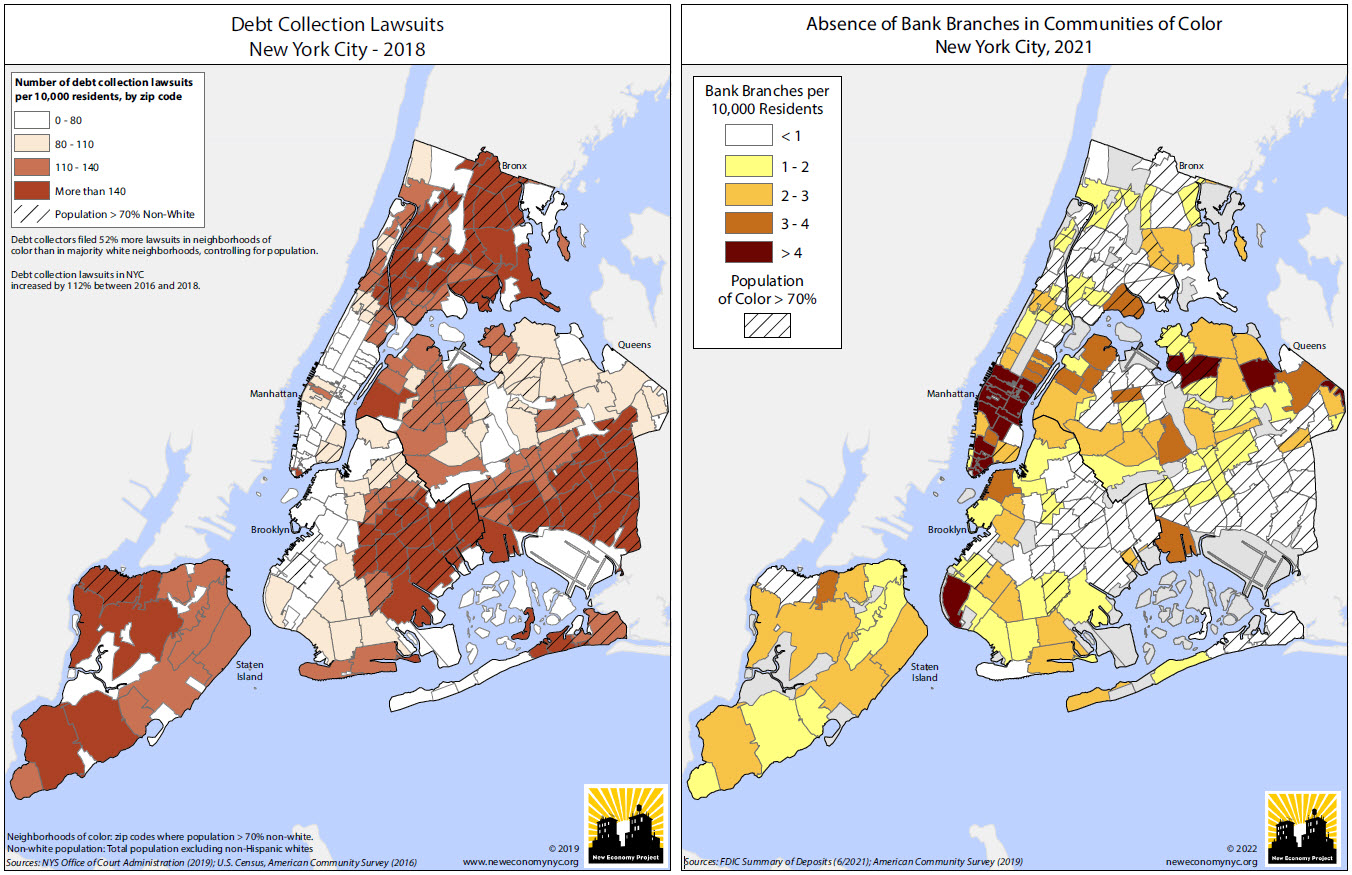
(Left Image): Using data from the NYS Office of Court Administration, this NEP map highlights the concentration of debt collection lawsuits in communities of color and is included in this report prepared for AARP New York. For additional maps, graphics and YouTube videos on this project visit this web page. (Right Image): Another map showing the relative absence of bank branches in NYC’s communities of color. Looking at this annually, one can see changes as gentrifying neighborhoods gain branches, but the overall pattern is a long-standing and remarkably stable one. There are actually six zip codes in the city, ranging in population from about 20,000 to 94,000 and all in communities of color, that have no bank branches at all.
Other examples of NEP research and mapping products can be viewed here.
Summary:
“The concept of “place” has always been at the core of how we approach our work” notes Hagen. “In NYC, people feel very connected to their neighborhoods, and are acutely aware of how much the communities they call home shape their day-to-day lives. There’s no better way than maps to relate to people’s experience of their physical environment, and to help contextualize those environments within the larger, systemic frameworks that we are so often fighting to change.
Clearly, GIS is both an important business and commuication tool for NEP.
Contact:
Ben Hagen
Senior Research and Communications Associate
New Economy Project
121 W. 27th Street #804 | NY, NY 10001
212.680.5100, ext. 221 | neweconomynyc.org


