Orbitist: Storytelling on the Western Front

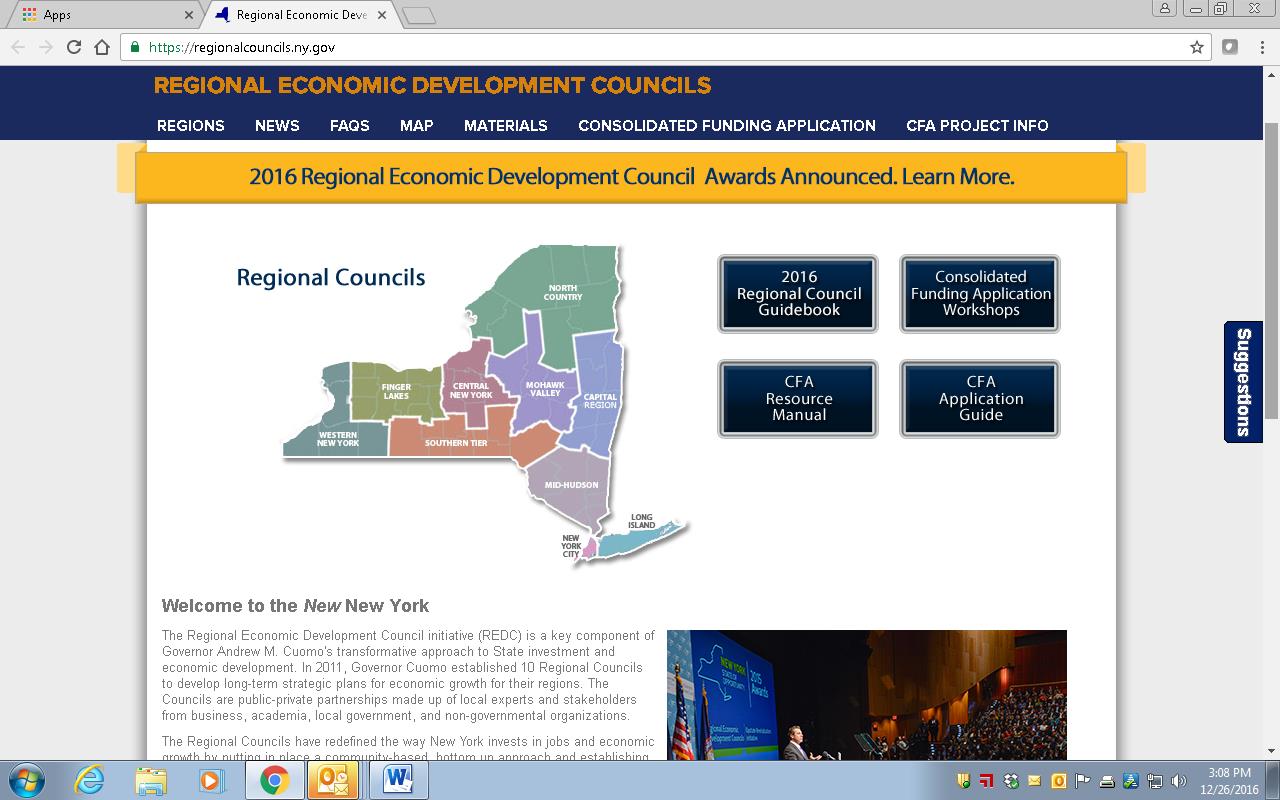
It’s always refreshing discovering new startups and firms mixing geospatial concepts with other technology and media platforms.  Not necessarily true geospatial firms which we’ve come to label as such, but clearly operating on the fringe and providing selected products and services mainstream geospatial consultants market and provide.  One such relatively new firm is Orbitist based out of Fredonia, New York.

Orbitist is led by Nick Gunner who has been filming and directing video productions since 2007 when he began pursuing his Bachelor of Science Degree in TV/Digital Film, Audio/Radio production, and Earth Science at the State University of New York at Fredonia. During that time, Nick started building content management systems and digital mapping technology which he continued while serving four years as the university’s New Media Manager.   On the side, he continued to pursue freelance work as a public radio producer, freelance documentary filmmaker, and web developer. In the Summer of 2015, Nick launched Orbitist LLC as part of the Fredonia Technology Incubator with the idea of using digital storytelling and technology to make important information as accessible as possible.

Initial Work

The Roger Tory Peterson Institute (RTPI) of Natural History was Orbitist’s first client.   In the Summer of 2015 they commissioned a short documentary on the Chadakoin River in Jamestown, as well as map three tours about various natural history topics.  Representative examples of RTPI products can be viewed on YouTube and the bottom three links on this Orbitist web page.  During this same time period – and ongoing today – Orbitist also performed work for the Chautauqua County Visitors Bureau.

Other recent products and services include:

A Story Map documenting the Winter 1929 Tewksbury boat and bridge crash on the Buffalo River resulting in the flooding of a 18 neighborhood blocks in South Buffalo.

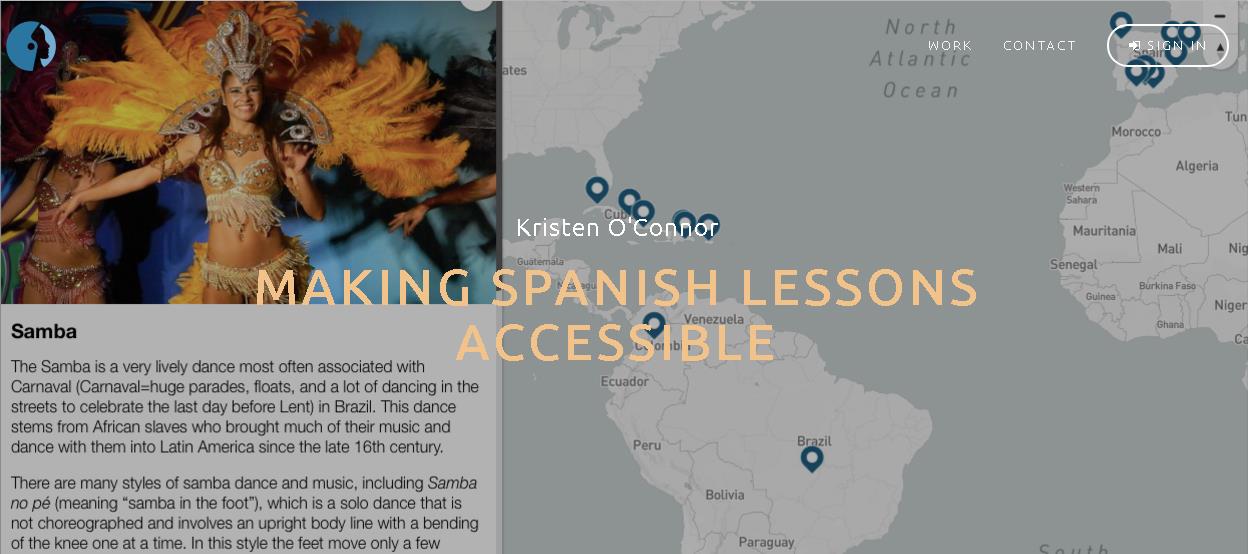
This Story Map uses a variety of multimedia which pinpoints cultural and historical features from different Spanish-speaking countries, including architectural feats, traditional dances, and tipping customs, among others. Each map utilizes Spanish phrases with English translations to bridge the gap between languages.

Software Suite

Relying on the experience he gained building systems for the last 10 years, software products used at Orbitist reflects Nick’s commitment to combining content management with interactive mapping – much of which is accomplished by integrating and combining leading Open Source components.   Currently the Orbitist mapping platform is a simple content management system which associates posts (internally called “points”) with latitude/longitude values.  The Orbitist team often uses Mapbox GL as a primary front-end mapping library but behind that everything in their system is API-driven, meaning story maps are created top of products such as Leaflet and Google Maps.  They also use Carto as a stand-alone product for building real-time analytics maps.  All combined, the Orbitist “system” also manages images and a variety of data (icon type, time of day, external links, etc.) and provides access to YouTube, Vimeo, and even Facebook for video hosting. GitHub is leveraged to host static web projects. Continue reading

2017 GeoCon Wish List: Part 1

I first wanted to publish this article initially as a wish list to the GIS Santa Claus in early December, but the holidays came and went so I am now submitting it as a New Year’s wish list (Part 1) for the 2017 GeoCon  in Lake Placid.  There will  be other suggestions over the next several months and I’ll remain cognizant  what I wish for as I may be submitting an abstract to present myself.  Maybe.

So to start the discussion, here is an initial list of  ten geospatial mapping applications and program areas I’d like to send a speaker invite to for the 2017 GeoCon – and why.

NYS Office of the Attorney General:  New York Crime Gun Analysis https://targettrafficking.ag.ny.gov/tool/

While mapping continues to be one of the primary end products of GIS analysis, geospatial data is increasingly being used in a wide range of data visualization platforms such as Tableau.    I’d welcome the opportunity to attend a presentation by the Office of the Attorney on the Crime Gun Analysis report outlining data collection, data analysis, and the rendering of the data through maps, tables, and charts.  Not the normal GIS menu.

New York State Regional Economic Development Councils (REDC) http://regionalcouncils.ny.gov/

In context of geospatial, this program reference isn’t so much about “what it is”, as opposed to more about “what it isn’t”.  Or at least I think.  From my level, the REDC framework has always been somewhat of a mystery since current state administration created the 10 Regional Councils in 2011.  And even more confusing that the geography of the REDCs do not coincide with the statewide Regional Planning Commission boundaries. That said, there is an incredible amount of geospatial information and analysis in the Council’s underlying mission.  Everything happens somewhere.  And there is a ton of money coming through the Consolidated Funding Application (CFA) process which I believe the GIS community should be more engaged and recipients of to some degree. Uber opportunities for web mapping applications, Story Maps, and GIS-produced maps for publications though one would be hard pressed to see any real evidence of a professional GIS touch in any of the Council products and services.   I looked through four regional 2016 “progress” reports (Hudson Valley, Finger Lakes, Capital Region and Southern Tier and found very limited reference to GIS/geospatial technologies.   Some kind of presentation by one of the REDCs and/or regional GIS personnel involved in this program would be most informative for the statewide GIS community.  Otherwise I doubt we’re going to hear anything through the state GIS program office on this.

511NY
https://www.511ny.org/

This is more of a selfish request than anything because I really don’t fully understand the makings and how 511NY operates in context of GIS/geospatial data collection, sources, work flows, or even development of their applications including the online mapping stuff.  I do know it’s big, visible, seemingly growing in functionality, supported by a mess of New York State transportation agencies -even though it has its own .org web address.  It also creates a lot of data which would be useful to consume and use in local government web mapping applications.   I’d be the first one to sign up to hear how it all comes together, funding, sources of the data (including what is being taken from and/or generated at the local level), opportunities for collaboration with local GIS programs, and what’s next.  How long before we see an Uber icon on the 511NY homepage to help support trip planning?

Continue reading