2016 National Map (TNM) Products and Services for the Empire State

For almost ten years, The National Map viewer has served as one of the more prominent and visible products of the of the U.S. Geological Survey’s (USGS) National Geospatial Program (NGP).  It represents a significant collaborative effort between the USGS and other Federal, State, and local partners in disseminating  nationwide geospatial data, and where available, content from state and local sources as well.

The National Map is easily accessible for display through a web viewer and boasts a rich catalog of map services which can be consumed by and augments a wide range of browser viewing clients.  It now includes the “new” viewer (the original TNM viewer will be retired this year) which provides users with access to geospatial datasets, geographic names, the Historical Topographic Map Collection (HTMC), and the increasingly popular post-2009 US Topo quadrangle product – all for easy access and download.    US Topo maps are modeled on the familiar 7.5-minute quadrangle maps of the period 1947-1992, but are mass-produced from national GIS databases on a three-year cycle.

Selected TNM viewer functions which can be used by the New York State geospatial community will be highlighted in  the  following  sections  including an update on two of NGP’s  most current and visible  projects –  the 3D Elevation Program (3DEP) and National Hydrography Dataset (NHD).  Both of which are made available in the TNM viewer.  If you’re not familiar with the National Map viewer, an easy way to get started is by using newly released USGS TNM tutorials.

3D Elevation Program (3DEP) Continue reading

10 Questions:  Star Carter

Star Carter is a GIS Analyst with the Development Authority of the North Country (DANC) located in Watertown, New York. Her life and career path read somewhat like a bucket list covering work as an oiled wildlife responder, aseptic laboratory tech, wrangler on a Wyoming horse ranch, federal law enforcement officer, ophthalmic assistant, naturalist tour guide and now knee deep in the geospatial world.

I started a conversation with Star at the 2015 NYGeoCon talking about work and ended up finding out a lot about how one originally from Hawaii ends up living in the snow belt of New York State…..

eSpatiallynewyork:  How long have you been with the Development Authority of the North Country (DANC)? What brought you here? Where did you go to school?

Star:  I was hired at the Authority in 2011 as a temporary GIS technician.  Thanks to a mixture of good timing and hard work, I’m now the GIS Analyst in a team of three GIS professionals at the Authority.  I’m from Hawaii, but I met my husband in Washington, DC.  He is from Watertown, and after a few years in DC, we moved to the North Country.  I have a BS in Animal Science from the University of Hawaii and a Post-Baccalaureate Certificate in GIS from Penn State.  I found GIS while working at a land trust after moving to Watertown. I was hooked from my first map project.  I enrolled in the online GIS program at Penn State and soon after landed my position at the Authority.

eSpatiallynewyork:  Tell us a couple of your most favorite examples of how GIS is used at DANC?

Star:  GIS has become a tool used by all of the Authority divisions, so I have many projects that keep me busy.  The Telecom Division is our largest internal GIS user, with more than 1,400 miles of fiber optic cable mapped in GIS.  The regional landfill and our regional water and wastewater lines are also mapped and updated regularly.  My team is increasingly involved in other less obvious GIS-related projects.  We are supporting two local government consolidation and dissolution studies right now.  When a Village is considering dissolving, or a Town is looking at consolidation with another Town, GIS is the spatial information Holy Grail.  For example, it is used to identify municipal infrastructure systems which need to be turned over to another entity, calculate the total number acres in the municipality, or in determining fire district boundaries.  GIS can help answer many of the tough questions that will inform voters who are making the ultimate decision.

eSpatiallynewyork: DANC represents a regional approach to GIS development.  What makes it successful?  Do you think it can be applied elsewhere across the state?  If so, why? 

Star:  DANC’s mission as a public authority is to provide technical services and infrastructure to enhance economic opportunities in the North Country region.  We exist to make local municipalities’ jobs easier, and GIS is a fast growing part of that challenge.  Many smaller municipalities want GIS, but their limited budgets, staff, equipment, and capacity are barriers to acquiring it in a traditional desktop setup.  The Authority’s shared services GIS model bridges those barriers and allows these communities to enjoy all the benefits of GIS without having to invest in the software and staff to run it.  The Authority has offered GIS hosting services on our web-based GIS application since 2011 (new.dancgis.org).  By June 2016, we will host GIS data for 56 municipal customers in four Counties.  People can access data from any computer or mobile device with an internet connection – that’s all it takes.  Suddenly, all of the infrastructure is at their fingertips and they have tools to interact with it.

I believe the DANC model can be replicated in other areas of the State.  I don’t think every municipality needs its own map viewer. So much money and time is spent on redundant viewers and software that could be better spent developing richer data.  In my experience, consolidating map viewers doesn’t mean that less GIS work is being done – it gives GIS staff more time and funds to work on the data.

eSpatiallynewyork:  Biggest professional accomplishment to date?

Star:  I’m very proud of my participation in the growth of GIS in the North Country and my work on the Authority’s Internet Mapping Application (IMA).  However, two summers ago, I mapped a utility pole line that went up the side of Whiteface Mountain.  Climbing to the top with 15 pounds of computer and GPS equipment was pretty cool and the view at the top was amazing.  I’ve since climbed 2 other mountains in the name of GIS field work – my goal is 46 peaks all on official GIS business!

eSpatiallynewyork:   From your perspective how important is the private sector (business and industry) in building GIS across the state? 

Star:  I collaborate with many private sector engineering firms and other businesses for my projects.  I’ve noticed a positive shift towards GIS technology, where previously the predominate software for engineers I was working with was CAD and they wanted little to do with GIS.  The two technologies can play together very well, and I hope that trend will continue.  The private sector often has the funds/ability/staff to create great data, and there is so much data out there being stored in CAD that would be wonderful to have in GIS.  Someone just needs to do the conversion, which can be time consuming.

eSpatiallynewyork:  What do you think of GISP certification?

Star:  It is something that I’d like to acquire, but so far it has not been a priority.  In my position at the Authority, the GISP is not required for advancement; experience and job performance are more valuable.

eSpatiallynewyork:  Anybody talking “Open Data” in the North Country?

Star:  “Open Data” has become a trigger word for me – bring out the soap box!  All data developed by the Authority is publically available.  We encourage all of our customers to make data public, but it is their choice – about half of them do.

eSpatiallynewyork:  What’s the next big geospatial “thing” for DANC?

We just completed an upgrade to the IMA to make it compatible with mobile devices and more functional.  Like most everyone else in the State, we are looking for user-friendly mobile apps for data collection, both for internal use and for our GIS hosting customers.

eSpatiallynewyork:  If you had an extra $50K in your budget, what would you spend it on?

Star:  I’d spend it on more training opportunities for our GIS staff.  GIS evolves so quickly and it’s too easy to get stuck in your current work flow.  We’re so busy that it’s difficult to take the time to learn about new technology and software, but I think formal training and exposure to new ideas at conferences is important.  And I’d spend it on more equipment – everyone knows that GPS units are like shoes: you need one in every color and style (oooh, this one works under tree cover!).

eSpatiallynewyork: What was the last presentation you made at a GIS conference or meeting?

Star:  I presented at the St. Lawrence County Local Government Conference in 2015.  DANC prepared an all-day track of sessions specifically about GIS – including an Intro to GIS, hands-on training with GPS equipment, and case studies showing how municipalities are using GIS.  I really enjoyed teaching.

eSpatiallynewyork:  So you are up in the pulpit and preaching to the NYS GIS community.  What would the sermon be entitled? 

Star:  “Sharing is Caring for GIS”.  I think the future of GIS includes better data sharing, the application of more shared resources, and more streamlined and standard processes. There are already great strides in this direction. We recently discovered all the amazing data easily accessible from the APA.  I would like to see us implementing more programs that are organized by regions, with GIS staff pushing local data up to shared resources that can broadcast the data to everyone who needs it.

eSpatiallynewyork:  What would you be doing if you weren’t working with DANC?

Star:  I would be back in Wyoming on the horse ranch; mending fences, oiling saddles, and riding through the mountains.

eSpatiallynewyork:  You gotta love snow to live in the North Country.  Cross country or downhill skier? 

Star:  Ha!  Being a surfer girl from Hawaii, the snow is the most difficult part of living here. I survive thanks to an understanding husband who lets me set the thermostat. I like to downhill ski, but last winter we skied Whiteface, which really pushed me to the limits of my skills.  It was terrifying, but fun, in that “I’m glad I did it but I’ll never do it again” kind of way.

NYS Local Government GIS Common Core: Part 1

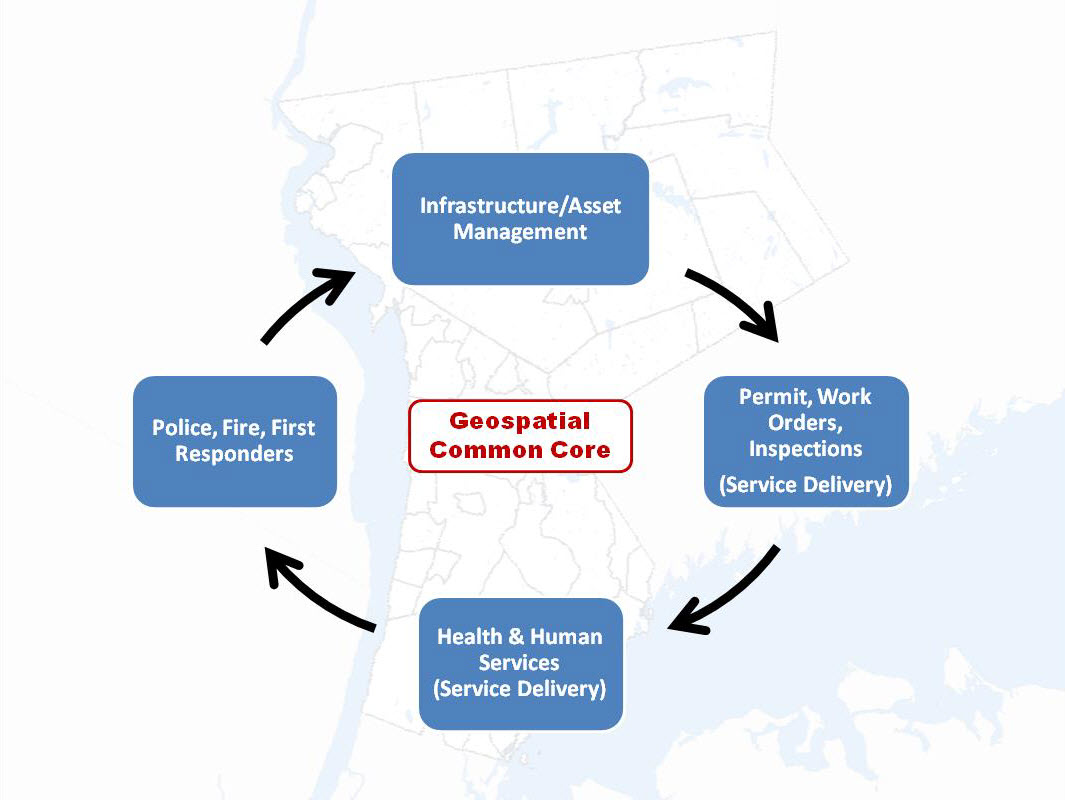
At the 2015 NYGeoCon in Albany, I presented a paper focusing on several GIS applications which often support and justify GIS/geospatial development at the local level.  I refer to these applications and program areas as the “GIS Common Core” and it was my intent to use the presentation as a starting point to expand the discussion further as part of this blog.

While some of the GIS Common Core program areas are not new to the discussion, several factors have contributed to elevating these day-to-day GIS functional areas to the mainstay of local government geospatial efforts.  Though these factors and opportunities vary greatly across the state, some of the more obvious reasons why “GIS Common Core” applications are becoming the foundation of local government programs include:

  • Improved large-scale spatial data integration across key business applications (assessment-inspections-permitting-public safety-utilities)
  • Better address standardization as a result of E911 implementation
  • Significant improvements on the integration between GIS and AutoCAD technologies
  • Establishing capacity to fulfill ongoing/permanent regulatory and reporting requirements (MS4)
  • Broad deployment of software programs in which using/collecting/maintaining X,Y data is implicit and available by default; GIS/geospatial is often no longer considered an “optional” feature
  • Leveraging flexible, easy-to-use browser-based applications which are accessible in a wide range of environments, particularly in the growing government mobile work force.  A work force which expects maps anywhere anytime.
GIS Common Core application areas in local government

“GIS Common Core” application areas in New York State local governments

Continue reading

Geospatial Business Spotlight: Mohawk Valley GIS

Company Name:                Mohawk Valley GIS

Website:                               www.mohawkvalleygis.com

Established:                          2003

THE COMPANY

Linda Rockwood founded Mohawk Valley GIS in 2003, after her family relocated to Herkimer County, New York.   Previously, she owned North Country Technology Integration in New Hampshire, working primarily with school teachers to integrate technology and particularly GPS and GIS into the K-12 curriculum.

Initially, Linda had planned to continue offering the same type of services in New York, but found more opportunities early on providing GIS system development, data creation and training to municipalities, and designing custom print maps for organizations.

Mohawk Valley GIS moved to historic Bagg’s Square in downtown Utica in 2014 and has grown to include three full-time staff in addition to Linda, who continues to keep her GIS skills current along with coordinating all business development associated with the firm.    Interns from nearby SUNY Polytechnic Institute  and Syracuse University help when everyone starts bouncing off the walls.  The business received NY Women Business Enterprise (WBE) certification in 2013.

PRODUCTS AND SERVICES

The company has expanded to offer a complete suite of technology services including custom interactive online maps and mobile applications to help promote tourism and recreation, as well as to helping businesses, organizations and local governments towards updating websites to be mobile responsive.

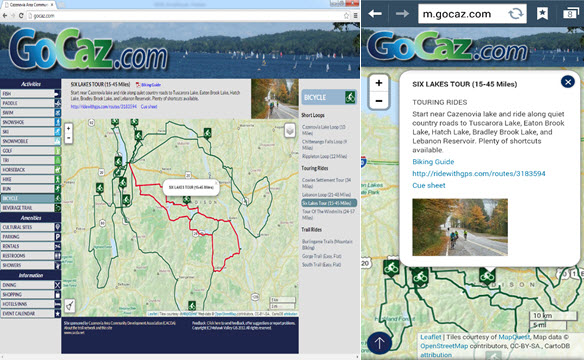
By example, GoCaz.com is an interactive web map promoting four season recreation opportunities throughout the Cazenovia area in the Finger Lakes Region.  This particular project is an example of an adaptive, rather than a responsive, mobile application.  The software checks to see what device is accessing the map, then adapts by “offering” the correct version, either large screen or small device screen, as shown below.

The GoCaz website is device independent - enabling users to access the application from different platforms.

The GoCaz website is device independent – enabling users to access the application from different platforms. The browser version screen is on the left and smartphone version on the right.

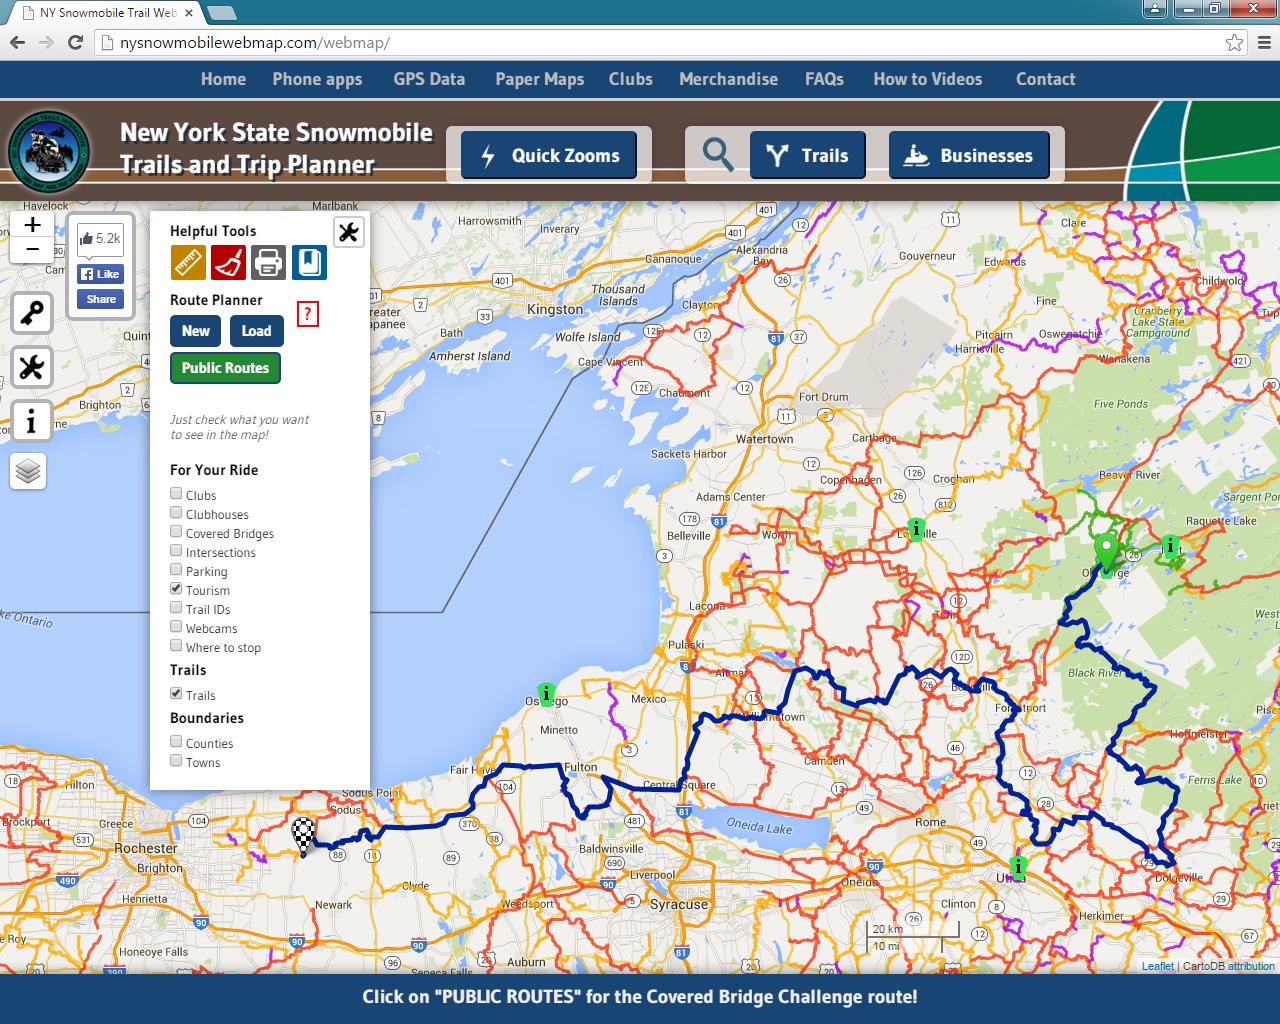
Mohawk Valley GIS has also been running two promotional, recreation e-commerce sites for the past six years: the winter-oriented NY Snowmobile Trails  and the summer-oriented ADK Trail Map.   The Snowmobile Map application features an interactive map with a route planner, no-reception-needed trail apps with turn-by-turn navigation, and GPS map offerings including Garmin .img file format overlay maps and regional .GPX track files and waypoints.  The application was built in partnership with over 100 snowmobile clubs throughout New York State and was just awarded a NYS GIS Association Applications Award at NYGeoCon 2015.  Many similar functions are available in the ADK Trail Map.  Both projects feature responsive interactive maps, which respond to the device screen size by repositioning elements or eliminating some functionality.

n addition to a massive catalog of snowmobile trails, the application provides access to information on lodging, restaurants, and related travel services

In addition to containing a massive catalog of statewide snowmobile trails, the application also provides access to information on lodging, restaurants, and related travel services.

The route planner and turn-by-turn navigation functionality are built using a pathfinding algorithm which required converting the shapefile representation of the trails to a graph data structure. All geospatial application code in the web map is programmed using Leaflet, an Open Source javascript library.

Core Mohawk Valley GIS services  include GPS data collection, geocoding and digitizing, custom map creation, GIS implementation and training, and GIS data analysis, particularly with regard to big data analysis for predictive analytics and visualization.

Other recent or currently underway Mohawk Valley GIS projects include:

  • Municipality mobile app for Town of Webb/Old Forge, reception required, runs on all mobile devices/browsers, designed primarily for codes enforcement department
  • Municipality mobile app for Warren County, no reception needed, for first responders, focusing on building and structure characteristics
  • Custom paper map design for Vermont Association of Snow Travelers
  • Responsive website for the Herkimer County Chamber of Commerce
  • A unique (at clients request) website, American Electrical Enterprises, which uses a high tech data and chart visualization library
  • Three “big data analysis projects”, all under Non-Disclosure Agreements (NDA), which include  strong geospatial components related to predictive analytics, marketing, and real time data interpretation

To find out more about Mohawk Valley GIS geospatial services and products, visit their website.

CONTACT

Linda Rockwood, Owner

linda@mohawkvalleygis.com

114 Genesee Street, 3rd floor

Utica, NY  13502

315-624-9545

www.mohawkvalleygis.com


10 (Almost) Questions: Todd Fabozzi

Todd Fabozzi is an urbanist, writer, teacher and drummer. During his twenty-two-year career as a regional planner he has been an advocate for cities and sustainable design. He has lectured extensively on suburban sprawl and its consequences and has been involved in numerous urban planning, climate action planning, and watershed protection studies. Todd is an expert on the use of Geographic Information Systems and has taught a course on GIS at UAlbany for the past thirteen years. Todd has also published two books of poems and anti-poems. He lives in the city of Saratoga Springs, NY.

I caught up with Todd at NYGeoCon for a short discussion on life and GIS….

eSpatiallynewyork:  How long have you been with the Capital District Regional Planning Commission (CDRPC)?

Todd:  I’ve been a professional urbanist for the past twenty-two years, twenty of which have been with CDRPC.

eSpatiallynewyork:  What’s one of the best examples of how GIS is used in your organization?

Todd:  I was charged with building the Commission’s GIS back in 1996. One of the first products from that effort was a regional atlas, which we published in oversized hard copy format (this was still pretty much pre-internet). The maps portrayed a whole variety of characteristics at the regional scale, giving the public a bird’s eye view of the spatial patterns of the Capital District for the first time. In addition to applying GIS in most of our program areas, I continue to create, update and publish regional maps (see www.cdrpc.org). I think understanding regional demographic, environmental and land use patterns is central to regional planning and GIS is the best tool for doing so.

eSpatiallynewyork: What professional associations or groups are you affiliated with?

Todd: Over the years I’ve tried out the American Planning Association, the Association of American Geographers, Progressive Planners Network, Congress for New Urbanism, and the NYS GIS Association. I also served for nine years on the NYS GeoSpatial Advisory Council. While for the most part I support the work of these groups, I’m currently unaffiliated (though with CNU and NYSGISA, it’s simply because I haven’t gotten around to renewing). I have to say though that in general I’m not a joiner, perhaps the anarchist in me keeps me at arm’s length from groups and group think.

eSpatiallynewyork:  If you had an extra $50K in your budget, what would you do with it?

Todd:  If it was a yearly allocation I would establish two part-time paid internship positions. CDRPC has been working on a climate and energy issues over the past few years and there are some interesting ways that GIS can be applied. So for example, a good intern project might be to identify (by analyzing the utility zones, solar orientation, area requirements, land uses and zoning laws) the places where community distributed solar might be feasible (community distributed solar allows one to receive solar energy from an offsite location).

eSpatiallynewyork:  Biggest professional accomplishment?

Todd:  Using GIS, imagery analysis and photography to document and portray sprawl and urban decline in the Capital District and through over two hundred presentations inciting a regional conversation on these issues back when it was politically and professionally risky to do so. This was the same presentation I made at the first NYS GeoSpatial Summit in 2006. http://www.nysgis.net/nygeosummit/year/2006/speakers.htm

eSpatiallynewyork:  What do you think of GISP certification?

Todd:  I don’t. I’m not concerned with merit badges. I’d rather let mapping do the talking.

eSpatiallynewyork:  Open Source or ESRI?

Todd:  We’re an ESRI shop but I’m open to whatever works best in a given situation…and the lower the cost the better.

eSpatiallynewyork:   If you could change one thing here in New York that you feel would make GIS more widely used, or more appreciated and understood – what would that be?

Todd:  Start teaching kids how to use GIS as part of the middle and high school curriculum.

eSpatiallynewyork:  What advice would you give to the next generation of individuals starting a career in GIS here in New York State?

Todd:  I’ve been teaching an Intro to GIS course at UAlbany for the past thirteen years and I think I counted seven different people at the most recent NYGeoCon that had taken my course and were now working professionally in NYS using GIS, which is satisfying. I reinforce to my students that GIS is a tool for something else, so get knowledgeable about something else, and then use GIS to help.

eSpatiallynewyork:  Any thoughts on the future of government GIS in the State of New York?

Todd:  There’s not much that state and local governments do that doesn’t have a spatial component, so the more we integrate GIS into government operations the more efficient those operations will be. I’ve heard you sing the gospel of web services for data delivery and I get that and think that is largely the direction things will head. Web-accessible GIS for basic tasks will also continue to proliferate, though there will still be a role for the desktop user with the full suite of tools at their disposal. I saw a presentation at the recent NYGeoCon about the City of Rochester’s various GIS applications that I found quite inspiring and think they’re setting an example of how GIS can be used in local government.

eSpatiallynewyork:  What would you be doing if you weren’t working with CDRPC?

Todd:  Assuming I was retired and didn’t have to earn a living I’d be playing my drums, writing, and traveling.

eSpatiallynewyork:  Your band is in the studio working on its 11th album – what can you tell us about it? 

Todd: Well, as some of my planning and GIS colleagues know, I’m also a professional drummer, and over the past eighteen years I’ve been the conga player for a twelve-piece original salsa band called Alex Torres and His Latin Orchestra. It’s a fun alternative to the office. We get to make people smile and dance, which isn’t something urban planning usually accomplishes. We did a ten-day tour of Shanghai, China this past March, which was a high point for us. And as you noted, we are currently in the studio working on our 11th album. We’ve been in the early rounds of the Latin Grammy’s with a few of our past records. Maybe this will be the one in which we nail it? For anyone interested in the band see: www.alextorres.com.

RESTful Services in the Adirondacks

While on vacation this past August in Lake Placid, I had a chance to meet up with one of my most respected and longtime colleagues, John Barge at the Adirondack Park Agency (APA) in Ray Brook. Lake Placid and the surrounding areas have long been a favorite escape for me dating back to my initial visit during the 1980 Winter Olympics when I was a graduate student across Lake Champlain at the University of Vermont in Burlington.  Being in the area always gives me a chance to catch up with John and compare notes, talk about our careers and  geospatial technology,  and of course, how much gas we have left in our tanks.

John is a special breed having been associated with the GIS program at the APA since its inception back to the early 1980s covering everything from command line ARC/INFO to the current development of web based products and services within the ArcGIS Online environment.  (He actually got started by digitizing APA roads with the first commercial installation of ERDAS GIS software.)  And  along the way, maintaining a reputation as one of the state’s foremost cartographers as illustrated in his gallery of hardcopy maps available on the APA website. Continue reading

Rochester GIS Scholars

GIS Scholars is a Rochester community-based youth program, serving ages 14-21, which started in 2012 at a small neighborhood agency.  Its origin can be traced back to as early as 1988,  when under the support of Joseph Becker,  who at the time was  employed with  the City of Rochester Bureau of Planning,  started a program which provided local youth the opportunity to learn and work with GIS technology by establishing training and employment opportunities.

Since 2014, the GIS Scholars program has collaborated with the Rochester City School District’s Schools Without Walls (SWW) to begin to integrate geospatial learning into overall educational offerings.   In addition to providing office and administrative support, SWW continues to occupy an important role in the Scholars initiative towards helping identify students as potential candidates for the GIS program.  While the relationship with SWW continues, Monroe Community College (MCC) has more recently become a major sponsor of the Scholars program by donating office, administrative, and computing space at their downtown Rochester Damon City Center facility. Additional volunteers, financial donations, as well equipment and software donations from companies such as ESRI, continue to support the underlying purpose of the program.  One Scholar has already completed the Digital World course and two have started the Business GIS course thanks to a donation to the MCC Foundation. Continue reading

Geospatial Business Spotlight: Spatial Analytix

Company Name:        Spatial Analytix

Website:                      http://www.spatialanalytixllc.com/

Established:                2015

The Company                                                       

Spatial Analytix is currently under the leadership of Ben Houston (CEO) and Matt Mercurio (GTO).  Together, both bring a wealth of experience in GIS and mapping to the growing Unmanned Aerial Vehicle (UAV) mapping market in New York State and beyond.

Most recently, Matt was GIS Manager in Allegheny County, PA and before that Project Manager at the Institute for the Application of Geospatial Technology (IAGT) in Auburn, NY. He also continues to be a principle and founder at Civic Mapper (www.civicmapper.com). Ben has spent the past six years as founder and officer at GroundPoint Technologies (www.groundpointllc.com) and prior to this worked with Matt and other colleagues at IAGT in both NASA and New York State Department of Environmental Conservation (NYSDEC) funded geospatial programs.

Spatial Analytix was formed in early 2015 to support a growing need in the UAV data processing market.   The current emphasis in the UAV market is on platforms, hardware, software and cloud based solutions, not the data. Spatial Analytix believes that the next few years will be characterized by market confusion over data quality and deliverables as even experienced geospatial professionals sort through the fog. By bringing a focus on data quality and useful deliverables, Spatial Analytix moves UAV data collections beyond being just imagery projects to producing high quality, plug and play geospatial data.

Geospatial Services   

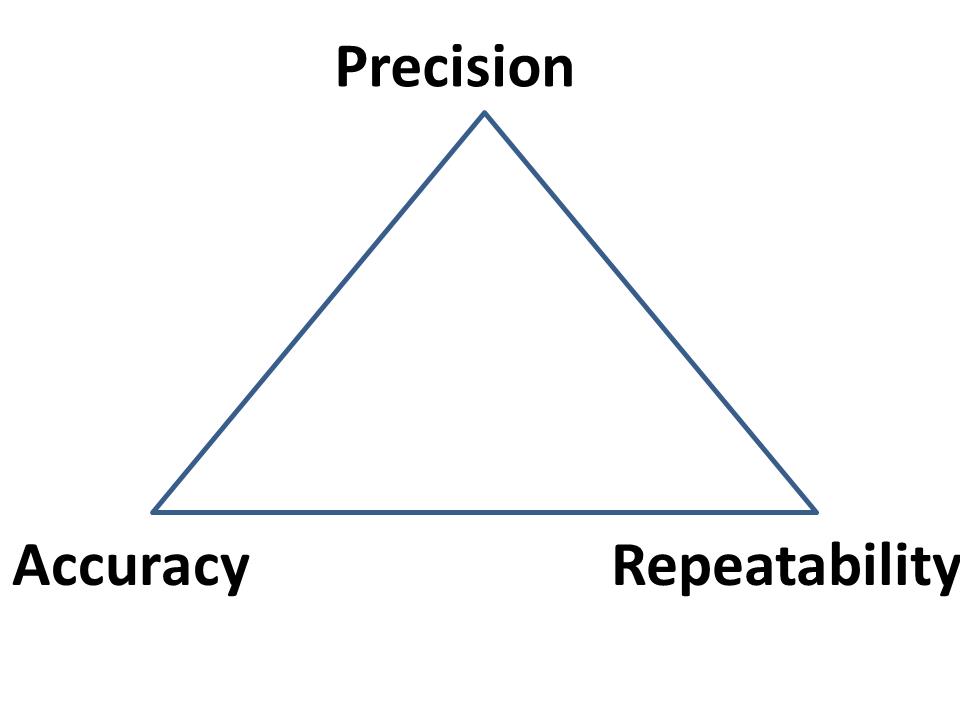
Spatial Analytix focuses on geospatial data in terms of the data quality triangle:

SA1While much of the current discussion in the UAV market focuses on the wow factor of precision, Spatial Analytix also considers temporal components along with verifiable accuracy in the data deliverables to ensure customers get what they want, when they want it. It’s the three elements together that bring real value to the data.

Typical outputs from automated processing (i.e., web based solutions) normally include point clouds, terrain models, and image mosaics (often labeled with the misnomer of “orthomosaics”). Such deliverables are usually acceptable for surveillance and monitoring uses, but for true GIS and engineering mapping applications, automated processing solutions leave a big data quality gap. Artifacts, noise and flight line overlap issues can clutter the point cloud and skew surface models, making for inaccurate contours and messy mosaics. Automated orthophotography can show up with smearing and ghosts, and usually do not include optimal image and cut line selection. Although available off-the-shelf geoprocessing tools in this space are becoming more powerful and functional each day, Spatial Analytix combines the right mix of quality tools, technical knowledge, and artisanal experience to get projects to come out right. The first time.

Clients can access raw data and processed deliverables through standard file systems, or as a URL which can be delivered across an enterprise for data visualization and exploration. No longer do the deliverables need to be sent to a GIS or CAD operator to put on screen for a supervisor or program manager. Live, web based delivery of hosted data is now standard. Platforms range from Google Maps to ArcGIS Online to Pictometry Connect. When compared to traditional photogrammetric and aerial survey products, Spatial Analytix deliverables are designed to be not only equivalent…but better.

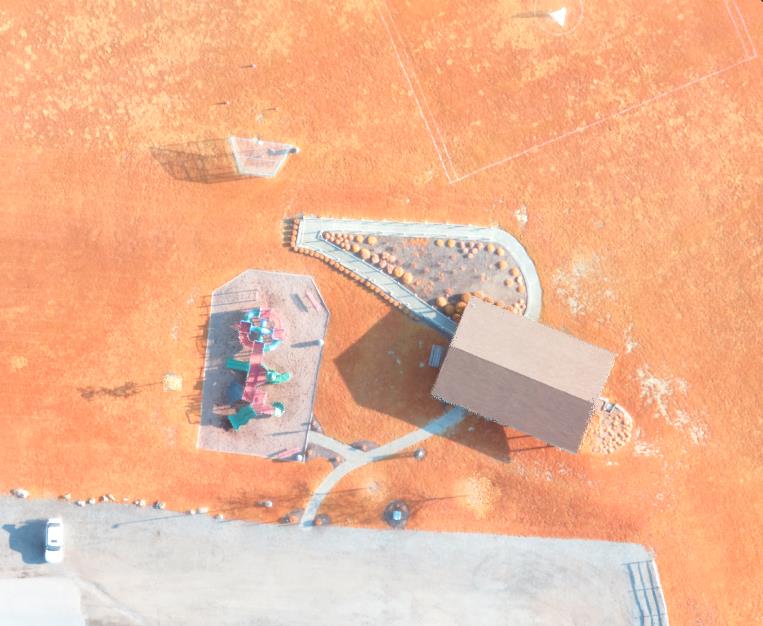
Ortho-Image

Ortho-Image

Spatial Analytix is developing a network of regional UAV data collectors offering standard services including:

  • Point Clouds (LAS format)
  • DTMs (full surface)
  • DEMs (bare earth surface)
  • Contours
  • Breaklines
  • Planimetrics
  • Image mosaics/orthomosaics
  • Volumetrics
  • Drainage
  • Vegetation/Landcover/Impervious surface mapping
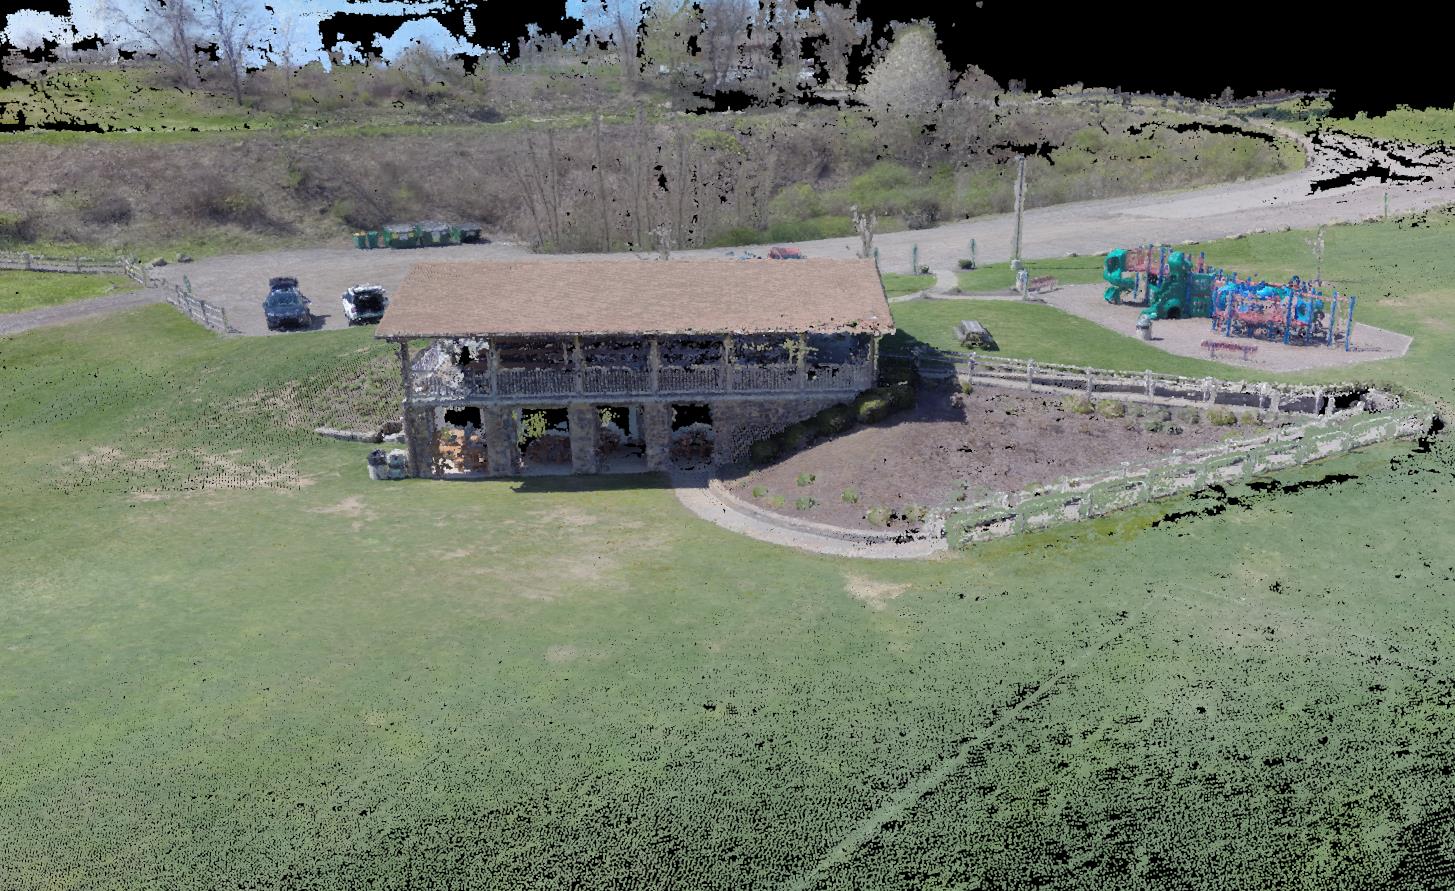
Colorized point cloud

Colorized point cloud

In the near future, Spatial Analytix product enhancements will include:

  • Oblique imagery integration (Pictometry Connect integration)
  • GeoVideo
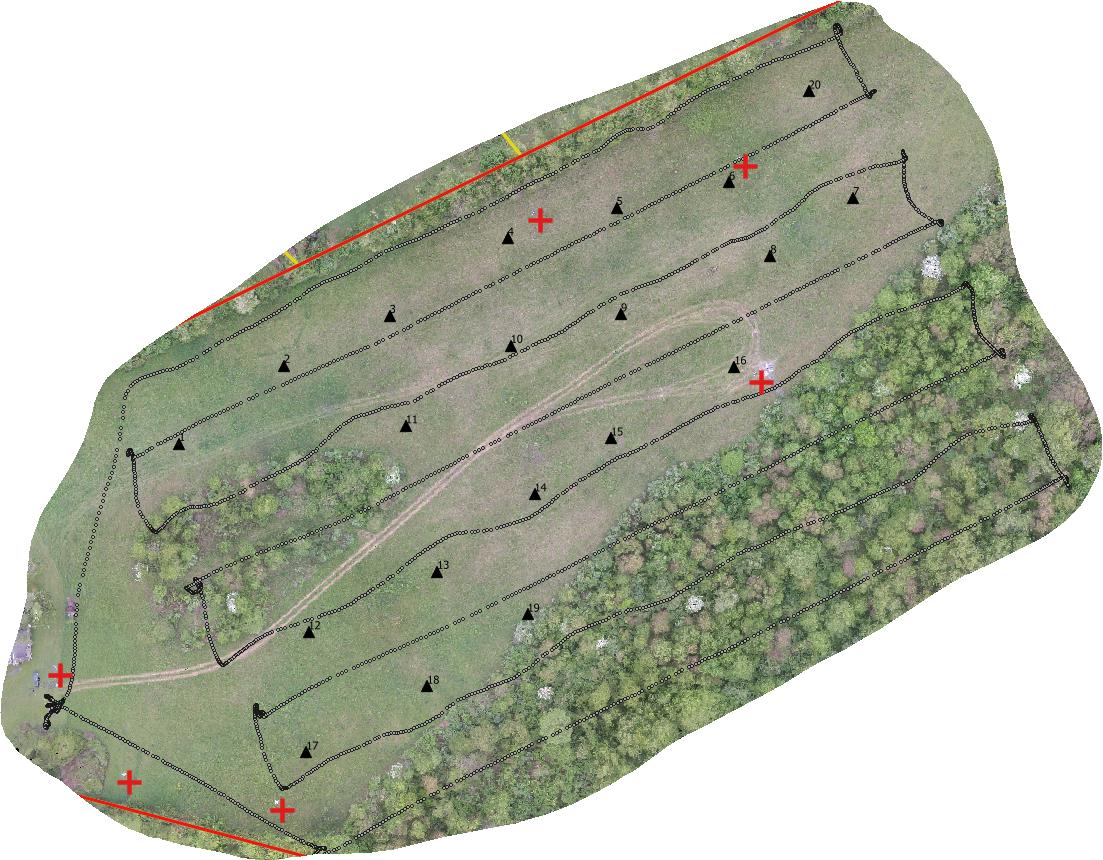
Typical UAV Flight Line Configuration Developing 3D Model

Typical UAV Flight Line Configuration Developing 3D Model


Spatial Analytix offers Virtual Geospatial Technology Office (vGTO) services to partner companies looking to leverage UAV and geospatial technologies by providing authoritative consulting support on such things as optimal flight planning and data processing, enterprise data management, and web based solutions. Whatever the UAV geospatial data deliverable is –  imagery, elevation, vector, or raster –  Spatial Analytix is confident that users have never seen data like this before.

Contact:   

Ben Houston, ben.houston@spatialanalytixllc.com

Matt Mercurio, matt.mercurio@spatialanalytixllc.com

Website: spatialanalytixllc.com

Facebook: /spatialanalytix

Twitter: @spatialanalytix

(412) 368-6015

GTO © Professional Services

SA7


2015 NYS GIS Legislative & GAC Summertime Blues

While a good chunk of the GIS community was recently at the big group hug in San Diego at the annual ESRI UC (btw – kudos to both City of Rochester and NYC Department of Sanitation for Special Achievements in GIS (SAG) Awards),  the summer government-based geospatial landscape here in the Empire State couldn’t be any different.  Government GIS –  as in municipal, county, regional and state programs – continue to creep along.    Government GIS program administrators and project leaders, and speaking here about local government GIS projects, maintaining the same ol’ same ol’ waiting patiently for a game changing statewide GIS program/project which will magically institutionalize and expand their geospatial structure.  Though in reality, local government GIS leaders continuing to endure a statewide GIS enabling program that plods along at the pace similar to an endless loop of Brian Eno’s Music for Airports.   Sure, a conference here, a webinar there, a new skin on pieces of the ancient NYS GIS Clearinghouse – all for meaningful cause on some level –  but at the end of the day, or really the end of another legislative year, a statewide program that does not produce any specific legislation action which results in earmarked funding or enabling support o help build GIS capacity in local, county, and regional governments.   Yes, those legislative appropriations which are necessary to build and sustain geospatial at the local level.

The Governor’s January 21, 2015 State of the State talking points provided an element of short term optimism identifying several priority areas including infrastructure/transportation, economic development/tourism, Regional Economic Development Councils, and public safety, some of which are at the foundation of established geospatial applications.  Unfortunately, as has been the case in years pass, there has been limited discussion or action since the January presentation among the statewide GIS leadership on how to leverage the Governor’s priorities on behalf of the geospatial community.  The one exception of course being public safety which will continue to dictate the direction of much of the so-called statewide GIS “coordination” discussion as long as the GIS Program Office is buried deep inside of the ITS Public Safety Cluster.  Of course not to question the importance of public safety applications in the broader GIS context,  so noted and recognized, but until an independent GIS office is created – and its absolutely not going to happen in the current political climate – public safety related geospatial themes will continue to take center stage in the statewide GIS coordination discussion.

Therefore, as I have done in previous years, I took a few moments to scan the legislative search engines to see if any new legislation may have been introduced by members of the NYS Legislature during the 2015 session which would include either direct or indirect funding to support statewide GIS/geospatial program development.   For those who are interested, I came up with results almost identical to the search results twelve months ago.  One can find selected pieces of legislation containing a  “mapping” component  in the areas of Alzheimer’s research, autism, and breast cancer research.  With the 2015 Legislative session now behind us, here’s a comprehensive summary.

So what’s the point?  The point is that the NYS GIS Association has grown immensely over the past decade and is now involved in many areas of the profession across the state. As noted in previous posts, one area in which the Association is still in its infancy is in building and creating a presence in the New York State legislative arena and creating its own legislative agenda.  And the lack of any geospatial-related legislation introduced by the NYS statewide legislature over the past several years  speaks to the lack of the Association’s presence in this space.  And such “legislative” support does not necessarily have to be in just the development of earmarked funding.  For example, it could also include legislative assistance – and expanding the discussion – on helping leverage existing appropriations in agencies such as the NYS Environmental Facilities Corporation (NYSEFC) which administers both the Clean Water and Drinking Water State Evolving funds.  In early July of this year, NYSEFC issued an announcement of a $50 million dollar grant program making funding available for local drinking water and wastewater improvements.  Yes, there are many earmarks and stipulations in the NYSEFC grant, but illustratively, its potential as a funding source to expand and highlight geospatial technologies at the local level as part of rebuilding the decaying public infrastructure cannot be ignored.

The Association’s legislative presence needs to be autonomous and completely independent – particularly from the Geospatial Advisory Council (GAC) which earlier in the year, as outlined in its new, wildly fascinating organizational chart, attempted to neuter the Association to the role of providing “professional development” while meanwhile taking on the role itself as to  “advising decision makers”.   Somehow determining along the way that the expertise and composition of the GAC membership was more qualified and better positioned than the entire Association membership to interact with decision makers.  If decision makers means advising their immediate supervisors, then maybe so.  But certainly not elected officials and politicians – the place where the “advice” and well scripted dialog needs to be directed.   Money here says the day GAC members who are government employees, to say the least of a politically appointed state government GIO, start independently interacting with decision makers and politicians in any meaningful and outward/visible way will also be their last day of employment.  This is work for industry-focused professional nonprofit Associations administered by real Executive Directors.  Not government employees.

To be truly independent and representative of the statewide geospatial membership, and particularly to the local government constituency, the Association needs to come out from under the shadow and footprint of state government-heavy committees/programs and engage with legislative sponsors on its own terms. (btw – GAC perfectly illustrated the Association’s need to flee the so-called new coordination framework in the new organizational chart of GIS coordination in NY State – with the dominant shaded state government rectangular box at the top of the chart.)   My guess is that the GAC leadership didn’t use a Hillary Clinton-type advance focus group test to see if anyone in the statewide GIS community really understood the chart  or for that matter what GAC is really supposed to do. Though some blame should be placed the Association leadership for even letting GAC publish the new organizational chart showing it (the Association) in some subservient capacity to the self-declared state government triumvirate and GAC, if even only in context of an advisory role.

The Association should also stop serving as a mule in providing GAC with an annual candidate list of potential members whose mere presence at the table implies endorsement of GAC’s activities.  Remove itself, along with local government individuals, from the quarterly parade to Albany to listen to state government departmental GIS applications, work plans, and projects and priorities of state government programs. While the dialog at GAC may be useful and productive in context of state government program updates and activities, its mostly for the benefit of the choir of state employees at the meeting and those making the presentations themselves.    Take a look at the minutes from the June 2015 GAC meeting and digest all of the riveting conversation concerning the needs and future activities of non-state sectors of GAC i.e., utilities, academia, nonprofits, and of course local government, and decide for yourself.  But maybe it was because it was a “state” sector designated meeting?  And other sectors will get their chance at future GAC quarterly meetings to dominate the conversation?  Yeah, probably.  Exactly why I formed the Association over a decade ago – to help lead the discussion and focus of statewide GIS development in a different direction and away from established Albany-centric GIS programs and personalities.  And the business sector?  BUSINESS.  Fugetaboutit.  Probably the most important factor which is going to shape the NYS geospatial landscape in the next decade doesn’t even really participate in the discussion.  And yes, there is a reason why business doesn’t run in the GAC circle.   And ironically, the only place the geospatial business community is going to participate and contribute is within the Association structure.

It’s time for the Association’s leadership to recognize and embrace the potential, and for that matter, its obligation, towards building an independent legislative agenda and professional appearance on the New York State political stage.  Operating and orchestrating on its own.  Working with other appropriate industry groups and committees where input and collaboration is requested and warranted as needed, but beholden to none and/or other hidden agendas.  The Association must establish itself to set the agenda of  statewide geospatial priorities. Not GAC and most definitely not state government employees or agencies.

That time for action is now, or the hopes of a meaningful 2016 geospatial legislation report reflecting the growth and expansion of the GIS profession will be a carbon copy of 2015.  And the beat will go on and on and on.   Just like Music for Airports.

The Blue Highways of GIS: Brooklyn, New York

Among the brownstones and sycamore trees on Carroll Street in Brooklyn, New York is the office of HabitatMap.  Founded in 2007, HabitatMap is an established metro-New York City non-profit environmental health justice organization whose goal is to raise awareness about the impact the environment has on human health.

HabitatMap was created as a nonprofit by activists focusing on the impact of hazardous facilities and sites on the well-being of residents in areas adjacent Newtown Creek in Brooklyn.    Today, HabitatMap’s products and services, including online mapping and social networking platforms, provide a framework for hundreds of community groups across the country to maximize the impact of community voices on government and industry, as well as strengthening ties between organizations and activists. The Founder and Executive Director of HabitatMap is Michael Heimbinder.

Utilizing Habitat’s shared advocacy and mapping platform individual and organizations can:

  • Alert the public to environmental health hazards
  • Hold polluters accountable for their environmental impacts
  • Highlight urban infrastructures that promote healthy living
  • Identify future opportunities for sustainable urban development
  • Promote policies that enhance equitable access to urban resources

Just a small sample of community-based organizations in the metropolitan area which use HabitatMap includes the Upper West Side Streets Renaissance Organization of Waterfront Neighborhoods,  Sustainable South BronxNeighbors Allied for Good Growth,   Brooklyn Compost Collective, the Bronx River Alliance, and the United Puerto Rican Organization of Sunset Park.   The HabitatMap website is accessed and used worldwide.

Similar to other smaller organizations with limited infrastructure and technical staff, HabitatMap integrates Google Maps to support it’s map viewer as well as a customized toolkit to edit and add “markers”.  Google products are also used as a means to publish content from their AirCasting platform.

The HabitatMap homepage at http://www.habitatmap.org

The HabitatMap homepage at http://www.habitatmap.org

HabitatMap Interactive Website

Once a personal profile is created, participants can start making maps on HabitatMap.org, mapping (aka “Add a Marker“) items of interest either by geocoding or clicking on a specific location on the map viewer  – which is based on Google Maps.  For example, I quickly created an account and mapped the location of a community facility in my hometown which is in need of minor repairs and perhaps retrofitted to provide space for community groups in a section of our town with limited such facilities.  As tags are associated with each marker location,  users can search the HabitatMap database for specific projects or areas of interest by using keywords such as water quality, recycling, fracking, community gardens, or greenways.  Keyword matches are then rendered on the viewing screen.

Community groups and individuals across New York State, particularl in the NYC metropolitan region, contribute to the HabitatMap by adding “markers” to identify a wide range of community-based issues and projects.

Community groups and individuals across New York State, particularly in the NYC metropolitan region, contribute to the HabitatMap by adding “markers” to identify a wide range of community-based issues and projects.

The Forums tab enables registered participants to start a discussion among other like-minded HabitatMap participants in categories such as Community Health, Water & Air Quality, Energy, Transportation, and Mapping.  Participants click on the forum category that best matches their intended topic of conversation and click “Post New Topic”.  The Blog tab is largely dedicated to the HabitatMap funded and developed Airbeam monitor which measures fine particulate matter (PM2.5), temperature, and relative humidity   Being used by community groups and activists across the country, the AirBeam connects to the AirCasting smartphone app via Bluetooth to map, graph, and crowdsource exposure to fine particulate matter in real time.

The Forums page enables participants to contribute and engage in dialog with others in topical areas such as Community Health, Mapping, Water and Air Quality, and much more.

The Forums page enables participants to contribute and engage in dialog with others in topical areas such as Community Health, Mapping, Water and Air Quality, and much more.

An excellent example of HabitatMap’s primary online mapping product can be seen as part of the Creek Speak map which provides access to stories of people and places near Newtown Creek. In addition to mapping the locations of local issues and events, the HabitatMap interactive map enables users to also include and associate URLs, graphics, and similar files with each mapped location.  Similar to other community organizations which partner with HabitatMap, the   Creek Speak Project map’s purpose is to highlight and document the knowledge of individuals who are “inside narrators” of day-to-day life in the Newtown Creek community.

Founded in the Newtown Creek areas of Brooklyn, New York, there have been many contributions to the online HabitatMap from individuals and organizations located nearby.

Founded in the Newtown Creek areas of Brooklyn, New York, there have been many contributions to the online HabitatMap from individuals and organizations located nearby.

.Other groups use the HabitatMap interactive map to identify locations in their community that either enhances the quality of life such as parks, scenic vistas, farmers markets, civic programs, or public parks, or those might  cause for concern, such as a graffiti, unsafe properties, traffic/pedestrian issues, or illegal dumping or discharges.  Users can also create individual maps highlighting a specific area of interest, embed maps on a personal or agency website or blog, invite fellow activists to contribute to maps, and discuss issues and recruit collaborators in the online forums.

Mapping & Educational Programs

One area which best exemplifies HabitatMap’s use of mapping is through its educational outreach programs.  Central to this effort is  MapThink, an educational toolkit series developed by HabitatMap which introduces maps-based research methods to high school students and community based organizations so that they can become active participants in their community and advocate.  The MapThink Toolkit series focuses on creating planning and advocacy maps using their online tools: HabitatMap.org and AirCasting.org.

Illustrative projects in this regard include youth program workshops in Brooklyn and San Francisco during 2014.  In San Francisco, HabitatMap worked with 60 seniors from the Galileo Academy of Science & Technology, a public high school that provides students with career pathways in biotechnology, environmental science, health, hospitality and tourism, computer science, and creative media technology.  In Brooklyn, HabitatMap worked with UPROSE which is a grass roots, multi-ethnic, intergenerational community-based organization dedicated to environmental and social justice. UPROSE Youth Justice members were introduced to the AirCasting product which was used to map the air quality problems in their neighborhoods, which is host to multiple power plants and waste transfer stations, dozens of auto shops, and bisected by the Gowanus Expressway.

Another HabitatMap mapping effort was conducted by the students at the Green School in East Williamsburg Brooklyn.   Their project, entitled “Drip, Drop, the Water Don’t Stop”, focused on the New York City water distribution system.  Using Habitat’s online mapping and the “Go With the Flow” toolkit, students developed maps based on research of the NYC water storage, filtration, delivery, and disposal infrastructures.  You can learn more by clicking through the project map, looking at photos, and reading student learning reflections.

The Green School’s research project of the New York City drinking water system as rendered on the HabitatMap interactive map.

The Green School’s research project of the New York City drinking water system as rendered on the HabitatMap interactive map.

This summer, HabitatMap is working with the North Brooklyn Boat Club and the New England Interstate Water Pollution Control Commission mapping and collecting water samples in Newtown Creek with the new HabitatMap WaterSense monitor, which measures dissolved oxygen, conductivity, and temperature.  The instrument connects to the AirCasting app via Bluetooth to record, map, and graph the data in real time.  Made possible through funding from the Lily Auchincloss Foundation, the project was initiated to address water quality concerns in Newtown Creek, a Federal Superfund site that is inundated by over a billion gallons of raw sewage annually, the result of combined sewer overflows.

HabitatMap:  Looking Forward

While boasting a diverse collection of partners and collaborators including Google Earth Outreach, New York Community Trust, Mozilla Hive NYC, Environmental Protection Agency (EPA), Carnegie Mellon CREATE lab, and the New York State Pollution Prevention Institute, among others, the likes of NYS Dept. of Environmental Conservation, Michael Heimbinde remains the only full-time staff at HabitatMap and envision’s a bright future for the nonprofit.  He notes:

“We’re excited to continue growing the AirCasting community. Our ambitions for AirCasting, and it’s true potential, lie in 1) creating ultra-dense networks of AirCasters that network together multiple schools and community based organizations in a single neighborhood and 2) scaling nationally and internationally. HabitatMap, in partnership with Sonoma Technology, NYU School of Medicine, NYU Wagner, and the Newtown Creek Alliance have crafted a proposal for a community based participatory research project that would enable us to create an ultra-dense network of AirCasters in Greenpoint, Brooklyn, bring together the technical experts needed to address improving air quality in a neighborhood overburdened with pollution sources, and establish a model for expanding nationally and internationally.”

Tim Dye, Senior VP at Sonoma Technology, adds, “Our collaboration with Michael Heimbinder and HabitatMap on the development of the AirBeam sensor has been very rewarding. Together, we launched the Kids Making Sense program, which combines education and technology to empower students to drive positive change in their communities, in the U.S. and abroad.”

One community group and one map at a time.  Communicating community geospatial data that matters from Brooklyn, New York.  HabitatMap.

Along the Blue Highways of GIS.

Thanks for reading and see you down the road.