Geospatial Public Health Research in the Empire State

It was at the 2015 NYS GeoCon Conference in Albany that I saw only a portion of Dr. Tabassum Insaf’s presentation entitled “Lessons Learned in Small Area Spatial Analyses of Health Outcomes” which started an interest in the state of applied GIS/geospatial activity in medicine and health care across the Empire State.  Having yet to approach the topic as part of eSpatiallyNewYork and finding an almost complete absence of health sciences content at the exact same state GIS conference this past fall in Lake Placid, I decided to circle back to Dr. Insaf to see if I could begin to scratch the surface on the use of geospatial in the NYS  health sciences research communities.

The Albany Connection

After initiating my correspondence with Dr. Insaf, the use of geospatial technologies in academic health care research across the Empire State became apparent..  Given the presence of NYS Dept. of Health in Albany, research in this space at the SUNY Albany School of Public Health is an obvious location.  Further review of the subject matter identified similar research programs at other academic institutions including Columbia University, New York University, and CUNY.

Like several other New York State Department of Health (NYSDOH) Research Scientists, Dr. Insaf holds an appointment at the School of Public Health.  At NYSDOH, Dr. Insaf is the Acting Research Director at the Bureau of Environmental and Occupational Epidemiology.  Her research interests are in understanding the role of environmental, social and behavioral factors in health disparities. Her work encompasses longitudinal and multilevel data analysis, Geographic Information Systems (GIS) technology and spatial epidemiologic methods.

With regard to the shortage of health sciences presentations at New York State GIS conferences, Dr. Insaf suggests the issue may be threefold:  (1) While the use of geospatial technology is common in their work, results in this space are often not presented or used as maps or other visual aids. (2)  Health data is often confidential and locations cannot  be published, and  (3) there may be more due to a lack of awareness in the health community that there may be interest and audience for this type of work in the GIS community.

Illustrative research efforts of Dr. Insaf include:

Social Determinants of Health for Low Birth Weight (LBW)

This research utilizes a variety of NYS public health records with the intent of better understanding and identifying potential social determinants of low birth rates focusing on data from selected census tracts in the metropolitan areas of Buffalo, Rochester, Albany, and Westchester/Long Island.   Applying geoprocessing tools and analysis, research findings suggest that census tract-area proportions of LBW was highest in areas with larger Hispanic or Black populations and high smoking preferences.  Spatial Regression analysis was used to  predict prevalence of LBW based on these major social determinants to identify areas of high risk of LBW.
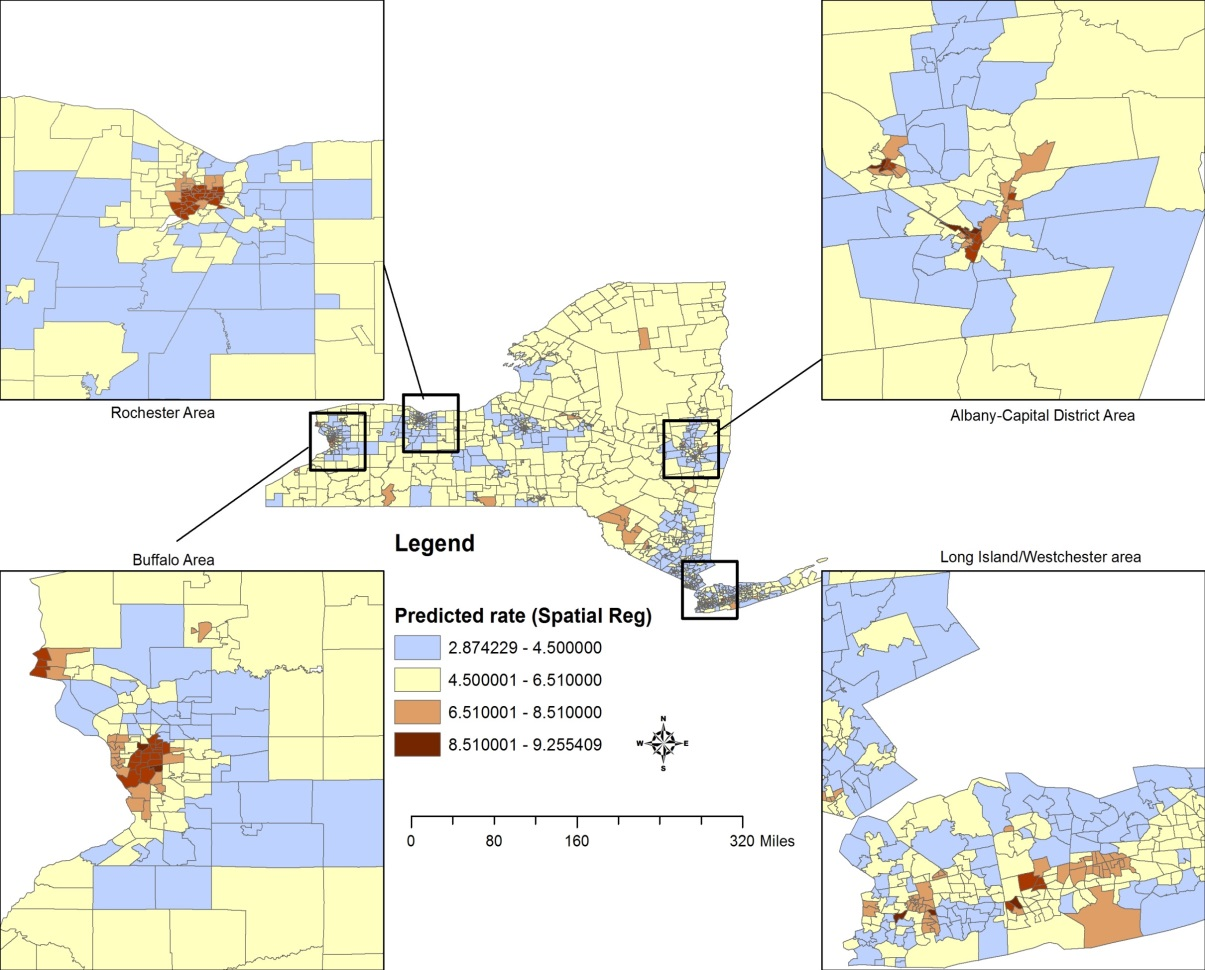
Predicted rates (%) for low birth weight prevalence based on a spatial error model that incorporates social determinants as race/ethnicity, prenatal care, smoking prevalence and maternal education.

It’s worth noting that her work in this space included collaborating work with Tom Talbot, now retired, who was an early champion of GIS technology in NYSDOH.

Health Impacts from Increased Temperatures Due to Climate Change

More recently Dr. Insaf has been working with several state agencies (bringing together New York State Department of Health, Florida Department of Health and New York City Department of Health) to develop indicators of localized climate trends, review and develop public health relevant heat warning messaging and develop local assessments of vulnerability to extreme heat for specific communities using remote sensing data from NASA satellites.

The team has worked with multiple stakeholders and collaborators including the CDC Environmental Public Health Tracking Network, State Climatologists, National Weather Service offices, NYS Department of Environmental Conservation, Office of Emergency Preparedness and local county health departments to develop climate information relevant to their mandates and jurisdictions.  Researchers  spatially linked satellite derived modeled data for air temperatures and heat index at a 12KM resolution with geocoded health outcome datasets (Hospitalization and Emergency Department visits for heat stress, renal disease and cardiovascular disease).  The team then estimates the risk of adverse health outcome for each 5-degree change in temperature and have also developed heat health profiles combining heat, health and vulnerability indicators for each county. The county profiles will be available soon as downloadable pdfs at the NYS Department of Health Climate, Weather and Health website.

The initial assessment of Climate in NYS that was the springboard for this more recent work is published here.  In an analysis of the U.S. Historical and Climatology network dataset for the 60 year period of 1948-2008 it was found that the most representative extreme weather indicators in NYS for warm weather are growing season length and warm nights. The most representative indicators during cold weather are a decline in cool days and ice days.  Most other temperature indicators are also consistent with the warming trend.    The precipitation indicators in the study report all point towards increasingly wet conditions over time.  The most representative indicators were total precipitation and the simple daily index.  Data also suggests the Great Lakes, Northern Plateau, Champlain Valley and Coastal New York regions may be particularly sensitive to changes in extreme climate events.
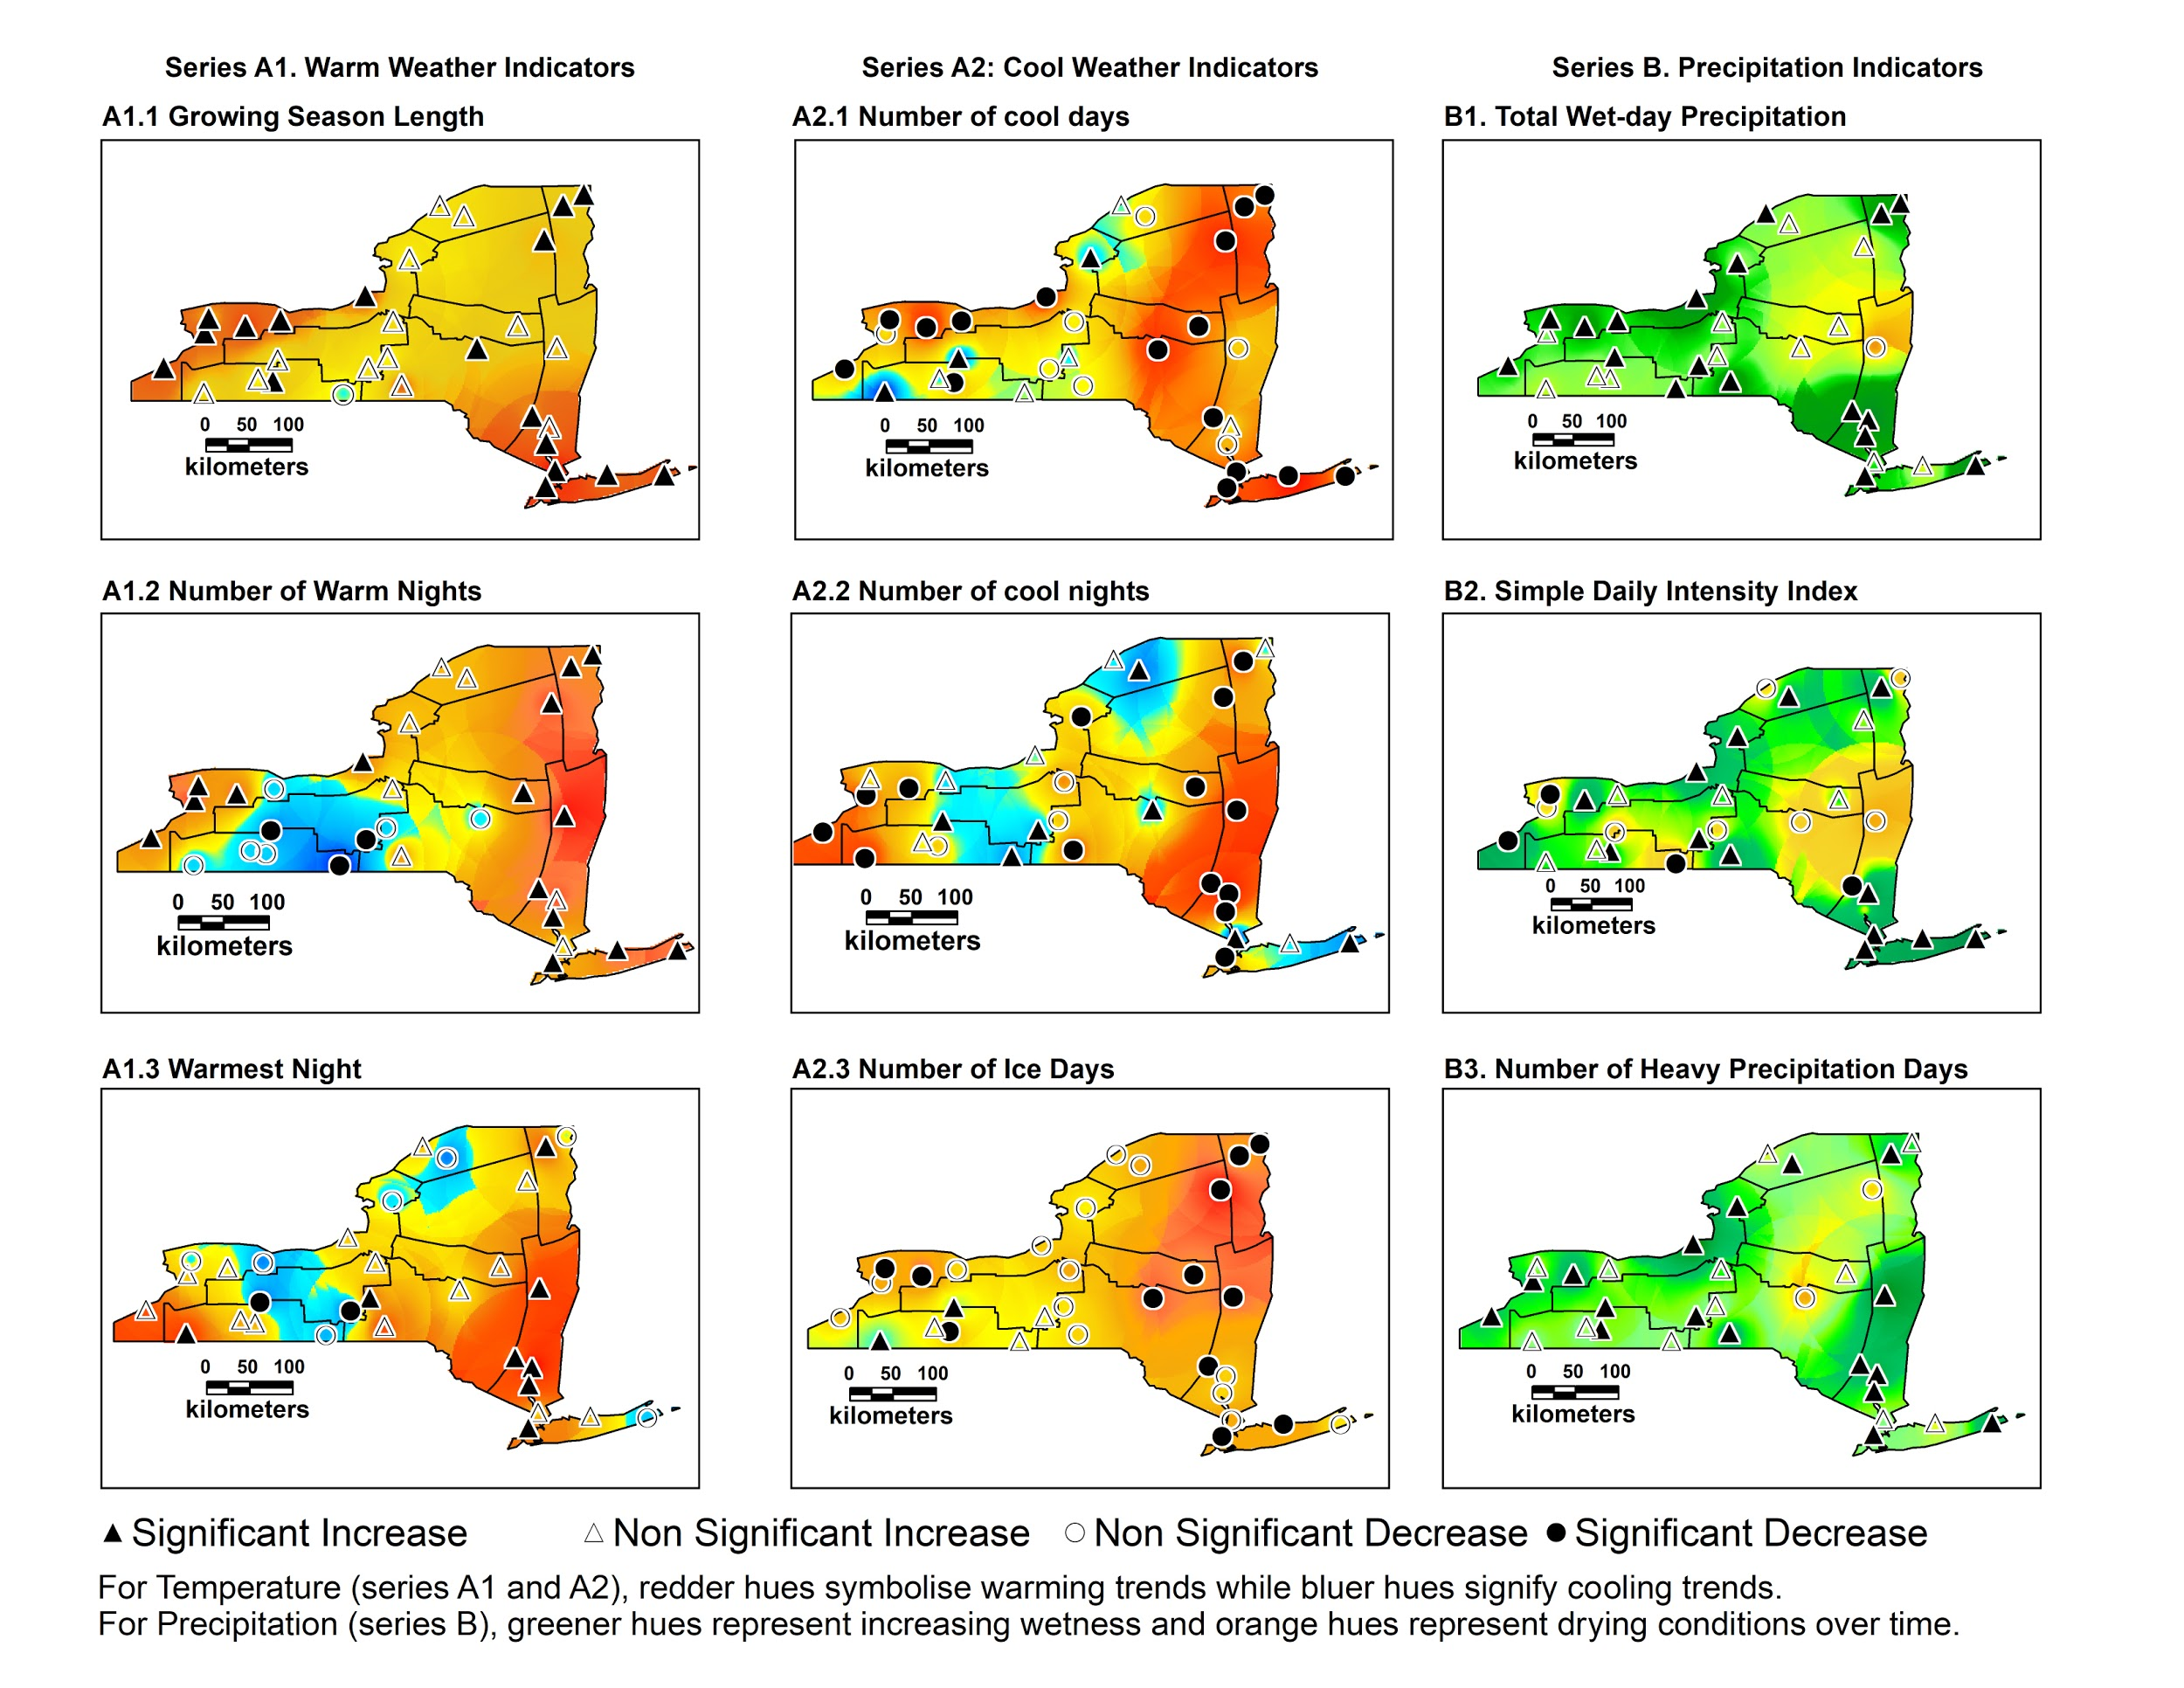
The map shows the predicted rates (in %) for low birth weight prevalence based on a spatial error model that incorporates such social determinants as race/ethnicity, prenatal care, smoking prevalence and maternal education.

Her team is currently using a spatially contiguous satellite derived dataset to build upon this work and to estimate health risks of heat exposures in rural and urban areas of New York. She is working with the National Weather Service offices to inform guidance on heat warning issuance in the area based on local thresholds.  The ongoing work is sponsored through a NASA ROSES (Research Opportunities in Space and Earth Sciences) grant. A great poster presentation on this work can be found here.

Estimating Health Care Access Times

Dr. Insaf has been focusing research on data from a newly established congenital heart defects (CHD) surveillance program funded by the Center for Disease Control (CDC).  Analysis uses geocoded data from surveillance datasets to determine patient access times to Cardiac Surgical Care facilities using the Google driving distance/time Application Programming Interface (API).  These driving time estimates are then compared against travel times from the same address using public transit (where available in more urbanized areas).   It is widely accepted that differences in travel distance to appropriate care among individuals with birth defects can have a significant impact on healthcare utilization, and it has been suggested that geographic barriers may play a role in cessation of care among those with CHDs.
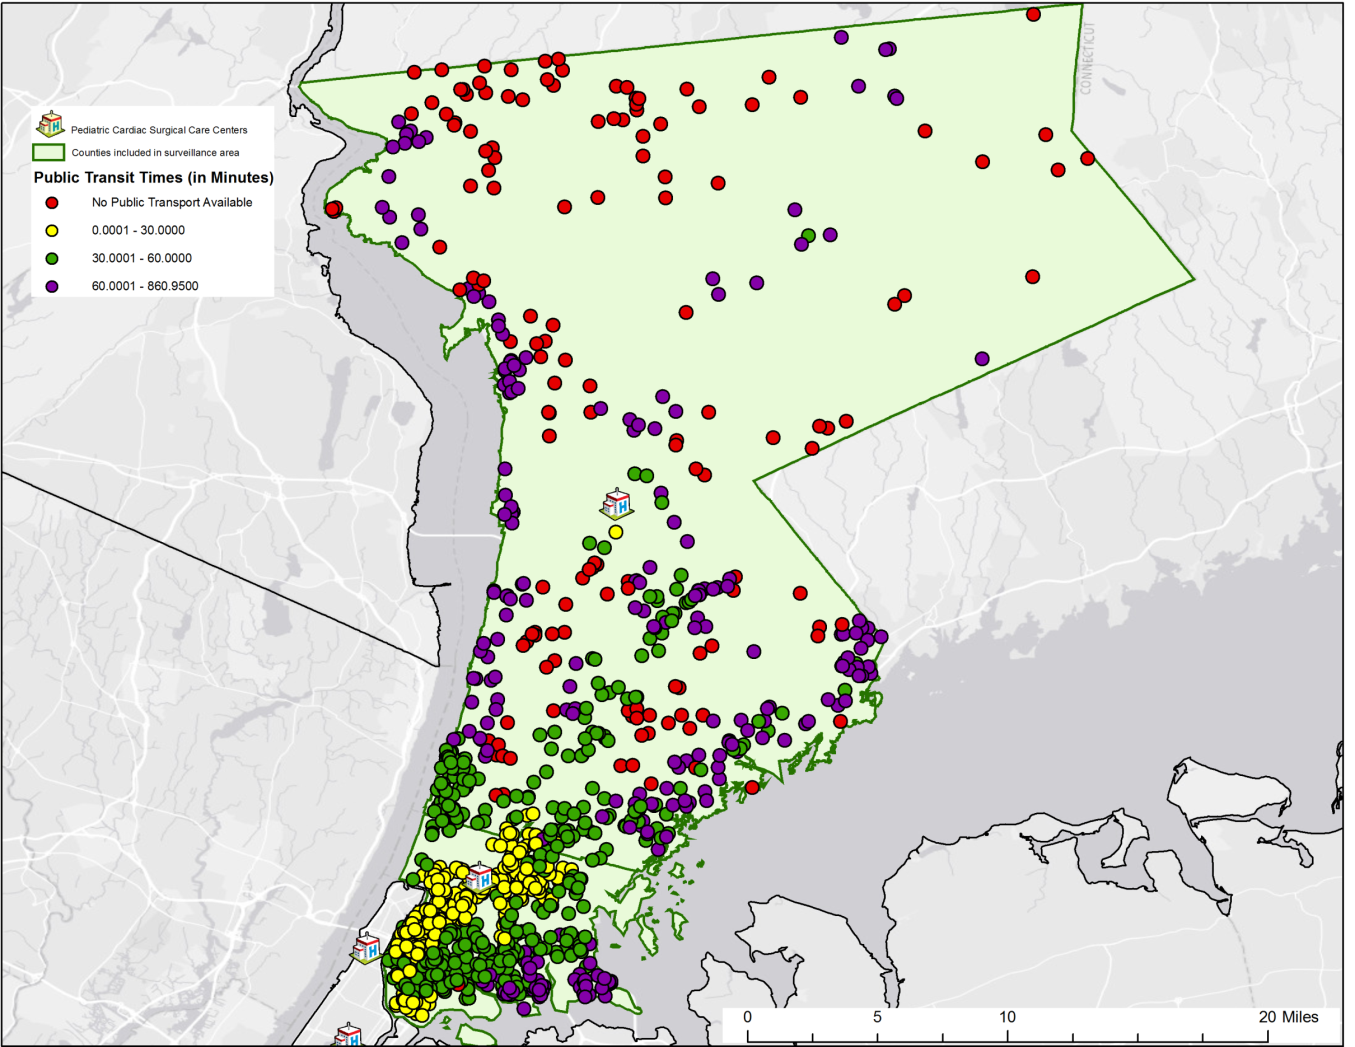
Calculated drive times in minutes for congenital heart defects patients to Cardiac Surgical Care facilities in Westchester County and the Bronx.

Other Representative Statewide Efforts

Dr. Glen Johnson, Associate Professor in the Department of Environmental, Occupational and Geospatial Health Sciences at the City University of New York School of Public Health, focuses geospatial aspects of health, with particular application to environmental and community-level social determinants of health outcomes. Research in the Bronx  includes examining the relationship between walkable access to healthy food sources (HFS) and the risk of anemia in pregnancy.   After geocoding patient residences, street network distances were obtained for the closest healthy food sources, which were identified from multiple databases.  For lower-income patients, as indicated by Medicaid or lack of health insurance, those who lived less than 0.25 miles from a healthy food source were less likely to be anemic when compared to those who lived farther away.  Patients with commercial insurance showed no effect.  These results continue to help to understand how a nutritionally-mediated condition such as anemia during pregnancy can be affected by one’s built environment, while also highlighting the importance of conditioning on socioeconomic status for these types of studies.
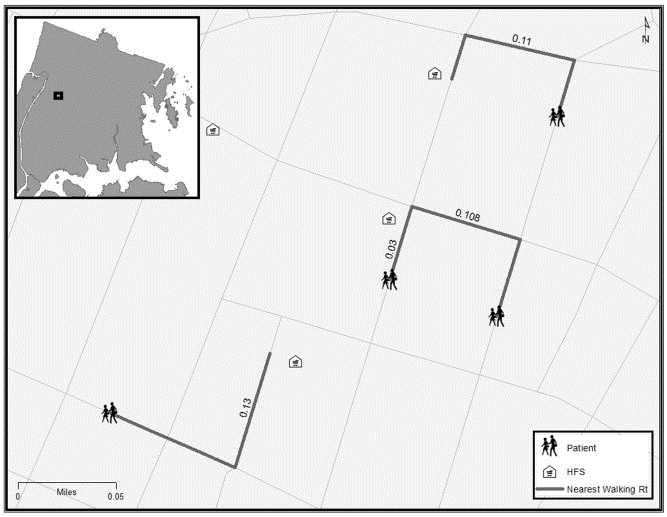
The primary variable of concern in the Bronx study: The street network walking distance to a Healthy Food Source (HFS) for a pregnant woman.

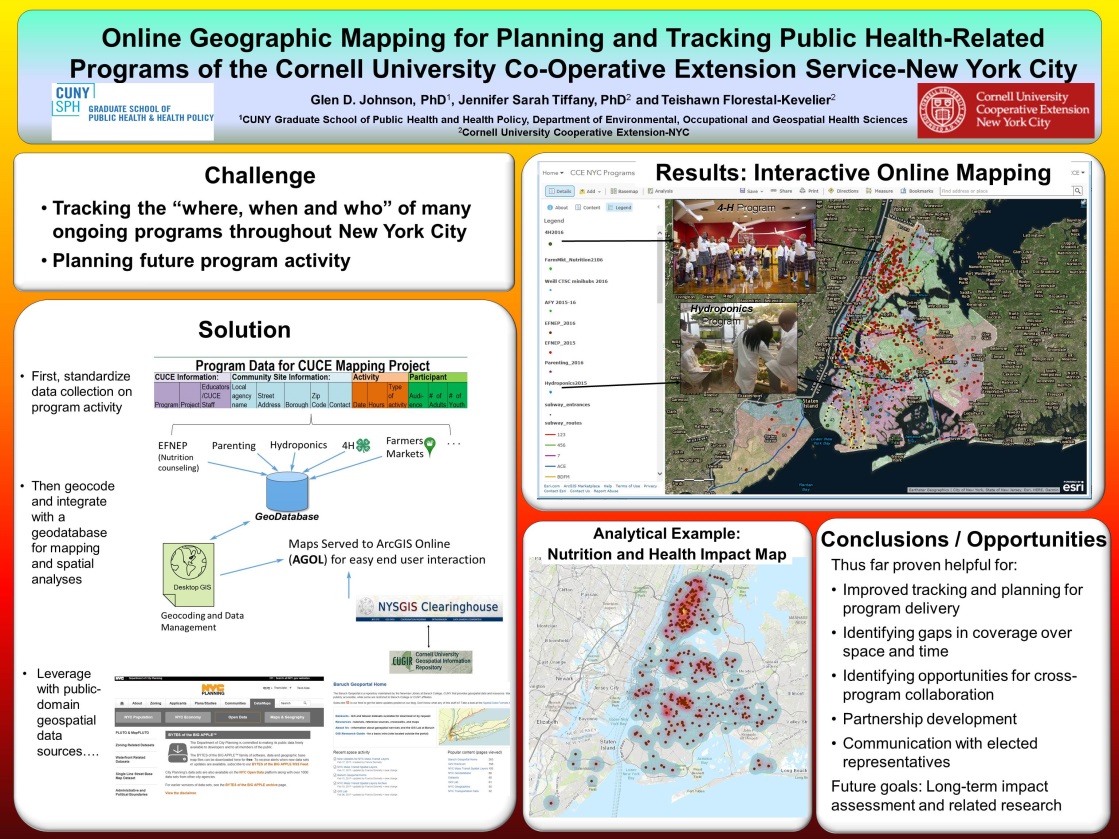
Most recently he has been working with the Cornell University Cooperative Extension (CUCE) who implement multiple programs aimed at improving overall population health in communities throughout NYC.  Examples range from community-based educational programs in nutrition and parenting to 4-H STEM programs for children.  Keeping track of the “where, when and who” of many ongoing programs in the largest city in North America is challenging. Online GIS mapping has provided a partial solution to this management challenge.  The poster below was presented at the New York State Health Foundation conference last December.
Johnson’s work also appears as  “A Community Needs Index for Adolescent Pregnancy Prevention Program Planning: Application of Spatial Generalized Linear Mixed Models” in . Maternal and Child Health Journal.  He is a former biostatistician for the New York State Department of Health and a faculty member of the University at Albany School of Public Health.

Also at  CUNY  Dept. of Environmental, Occupational, and Geospatial Health Sciences is Dr.Andrew Maroko, Associate Professor. Past research involves the use of geospatial tools focusing on the health outcomes of (unhealthful) food-and-beverage advertising in subway stations  This research focused on the correlations between ad exposures and sugary-drink consumption, fruit-and-vegetable intake, and diabetes, hypertension, and high cholesterol rates. Subway-station ads for “less-healthful” items were located disproportionately in areas home to vulnerable populations facing diet and diet-related-health challenges. The fact that uneven ad placement did not relate to total rider counts suggests ads were not directed at the largest possible audiences but rather targeted to specific groups.
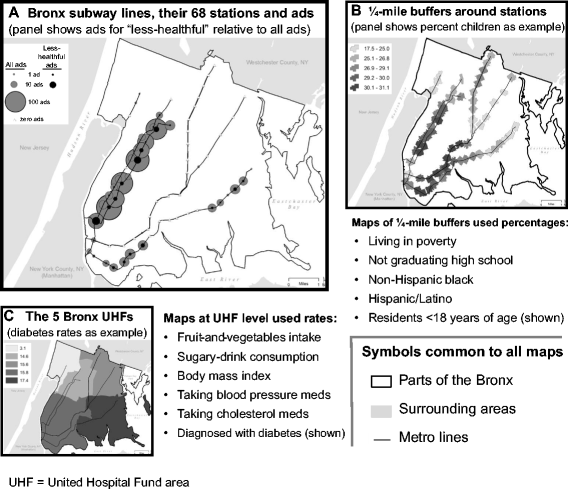
Ad placement did not relate to the number of riders entering at stations. Instead, exposure to food-or-beverage ads generally, and to “less-healthful” ads particularly (specifically ads in Spanish, directed at youth, and/or featuring minorities), was directly correlated with poverty, lower high-school graduation rates, higher percentages of Hispanics, and/or higher percentages of children in surrounding residential areas.

Other Maroko NYS geospatial-based research work includes “Integrating Social Determinants of Health With Treatment and Prevention: A New Tool to Assess Local Area Deprivation” and “Direct observation of neighborhood stressors and environmental justice in the South Bronx, New York City”.

Dr. Jessica Athens at New York University School of Medicine, Department of Public Health, is part of the Health Geographics Research Initiative (Health GIS).   One of her primary focuses at the present is City Health Dashboard presents data on health outcomes and the upstream determinants of health for 500 Cities across the U.S.  Her team produced a pilot version with four cities which can viewed at www.cityhealthdashboard.com. Starting on May 15, the site will include data for 500 cities will be available at the same URL.
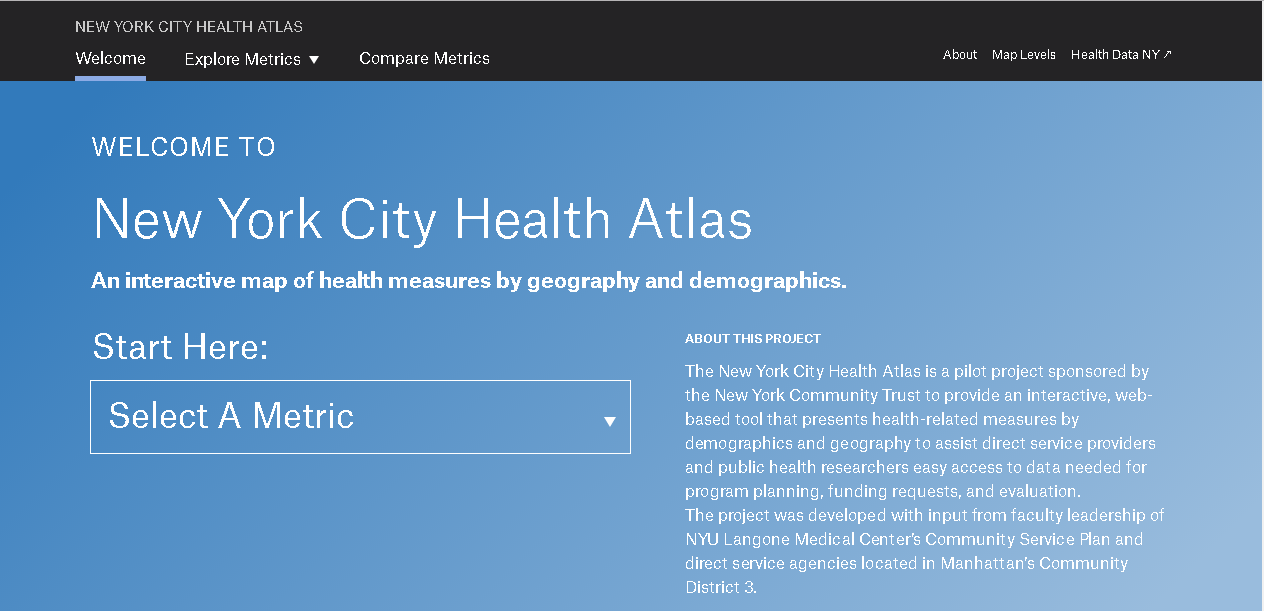
Dr. Athen’s other work includes the NYC Health Atlas which is sponsored by the New York Community Trust. The application provides direct service providers and public health researchers easy access to data needed for program planning, funding requests, and evaluation.

Also in the region at Columbia University, Department of Psychiatry, Division of Child and Adolescent Psychiatry, Drs. Christina Hoven, George Musa and Lupo Geronazzo-Alman are working on several projects using geospatial analyses to understand the effects of neighborhood quality, safety and socioeconomic status on psychopathology.

Summary

The combination of  world renown medical research facilities and the growing use geospatial technologies at  these organizations is an evolving environment the New York State GIS community should take advantage of and nurture.   As we find ourselves amidst major public health challenges impacting our communities from issues such as the growing influence of Climate Change, the spread of infectious diseases, and the ubiquitous opiod crisis among others, the use of geospatial tools in collaboration with the health care research community will bode well for increasing the visibility of the profession across the Empire State.

 

Geospatial Technologies at St. Lawrence University

The 2017 New York State GeoCon in Lake Placid provided the opportunity to for me to catch up with several statewide colleagues which will be reflected in at least a couple upcoming blog posts.  As part of these discussions, I ended up connecting with a familiar Empire State GIS person of interest:  Carol Cady – who serves as GIS Specialist/Map Librarian at St.Lawrence University (SLU) in Canton, New York.  Our discussion and follow-up communications certainly highlight a wide range of geospatial activities in the state’s North Country which the SLU GIS program is a significant contributor.

Carol directs the GIS project which is housed in the Libraries and Information Technology Division.  Unlike many of the New York State public university geospatial programs, the SLU program is not associated with a specific academic curriculum or major.  She and other GIS program staff provide instructional, technical and research geospatial support to the entire university community in the use of geospatial software and technology including Remote Sensing and Global Positioning Systems (GPS).

Carol arrived at SLU in 2002 to oversee and manage the GIS program.  Before her arrival, the SLU GIS program had been established in the early 90’s by Professor Bill Elberty who was a Geography Professor and for whom the current GIS lab is named after.  Professor Elberty taught GIS courses which provided the foundation for many current GIS professionals across New York State.  After Professor Elberty retired in 1999 the GIS program data and software was moved to the Science Library.

Prior to accepting the SLU position, Carol served as a GIS Analyst for Fort Drum Natural Resources Branch as a contractor. Carol’s background is in biology with a BS from UMass- Amherst and a Masters in Zoology at the University of Vermont.   She was introduced to GIS as land management tool while a seasonal wildlife technician for US Fish & Wildlife Service at Moosehorn Refuge in Calais, ME.   She then returned to UMass to learn more about GIS with coursework in the Wildlife Department.

GIS Facilities and Academic Offerings

The principal location for GIS and GPS instruction at SLU is the Elberty Laboratory for Spatial Analysis.  The lab includes 15 dedicated GIS workstations, printing and plotting devices, field tablets, and both Trimble and Garmin GPS units.  Increasingly, smartphones using the ESRI Collector and Survey 123 apps are being used in field data collection efforts.  Both Carol and GIS/GPS technician Dakota Casserly offer support to the SLU community in a variety of software packages including ArcGIS, QGIS, Google Earth, IMAGINE, IDRISI, and NASA’s WorldWind.

On a regular basis, Carol teaches both Intro to Geographic Information Systems (with lab) and Directed Studies in Geology GIS classes and occasionally Advanced GIS and Intro to Geospatial Technologies.  GIS concepts are incorporated in other courses in the areas of Conservation Biology, Global Studies, Environmental Psychology.

Carol is assisted by Dakota Casserly, St. Lawrence University GIS/GPS Technician who is involved in the program on many levels including designing and guiding projects with student GIS technicians and teaching introductory sessions or specialized topics like GPS and Network Analyst.  A project he has recently completed is the Laurentian Legacy project.

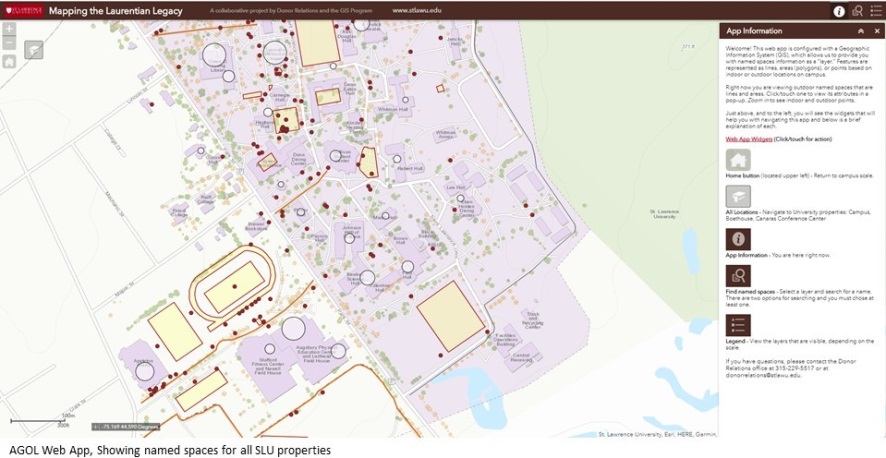
Mapping the Laurentian Legacy is a partner project between the University’s Donor Relations department and the GIS Program. The web app provides interactive and searchable access to the University’s named spaces database.

Projects and Activities:

The GIS program at SLU provides support to many local and regional geospatial efforts.  The program has a long  relationship with the St. Lawrence Land Trust having provided maps for base line and yearly evaluations of easements.  Recently, SLU GIS staff, along with Jess Rogers, Assistant Professor, Biology/Environmental Studies, SUNY Potsdam, and Alex French, Sustainability Coordinator, Clarkson University conducted a suitability analysis to find large privately owned forested properties which meet Land Trust criteria to put lands into a protected easement.  More recently, Carol’s Intro to GIS has been involved in a suitability analysis to identify non-forested properties in all of St. Lawrence County that may meet Land Trust easement criteria.  In 2013 Dakota’s predecessor, Jonathan Ignatowski, worked with the St.Lawrence County Health Department to identify houses built before the early 1970s and may contain lead paint.  This was part of a larger project to help with lead paint remediation for household owners.

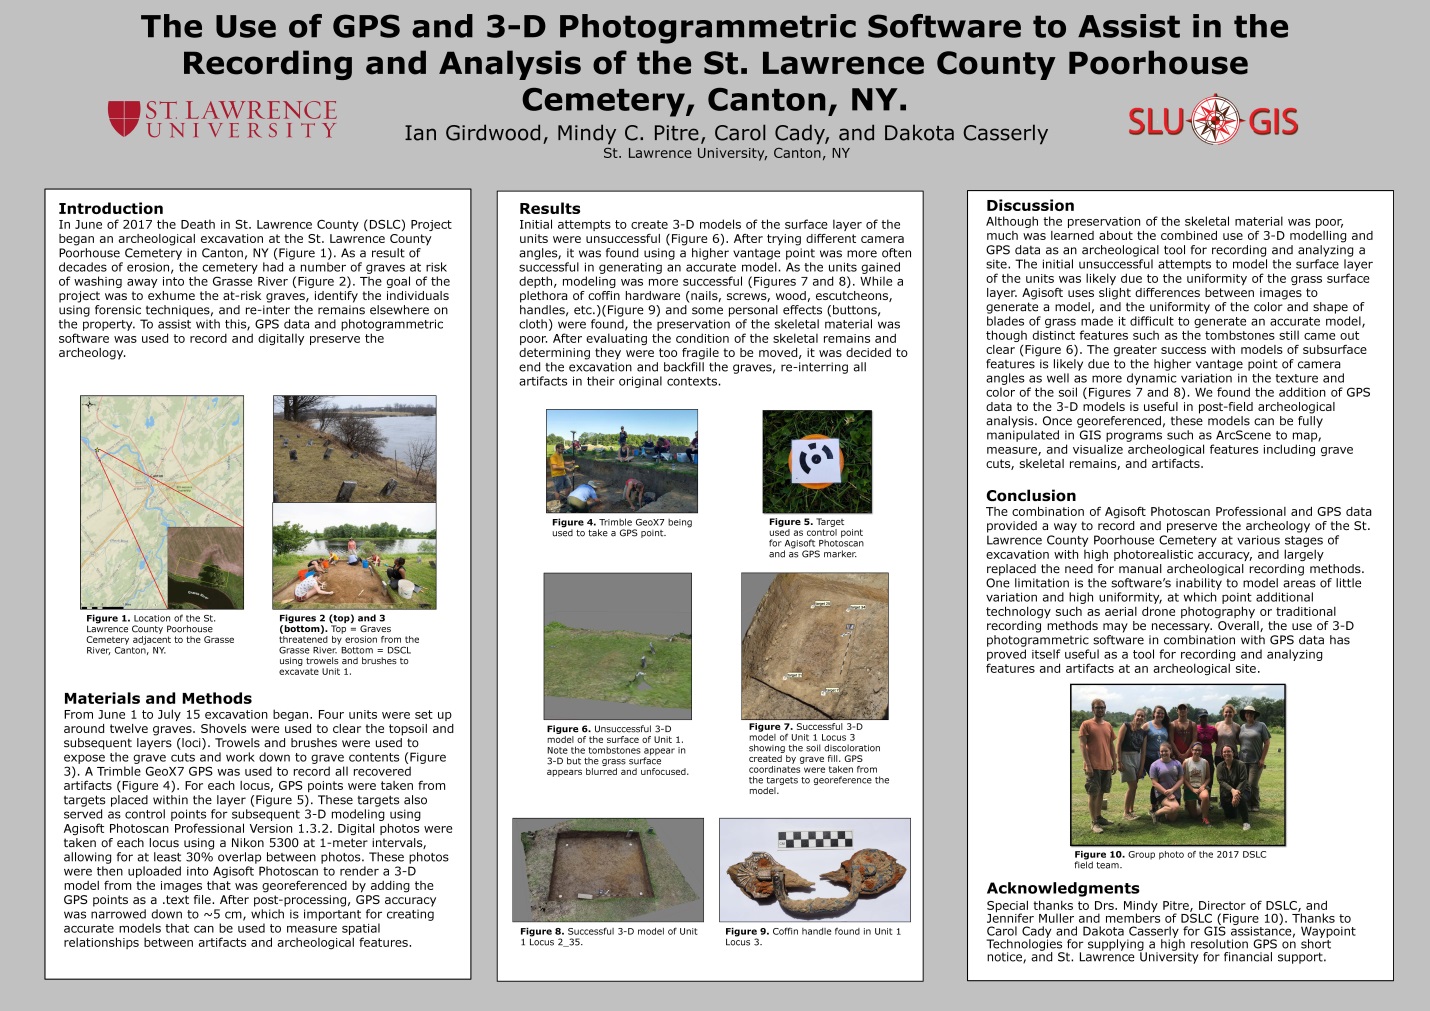
One SLU project which was of particular interest to me is the June 2017 Death in St. Lawrence County (DSLC) Project that began an archeological excavation at the St. Lawrence County Poorhouse Cemetery in Canton, NY.  As a result of decades of erosion, the cemetery had a number of graves at risk of washing away into the Grasse River.  While the original goal of the project was to identify and exhume at-risk graves, identify the individuals using forensic techniques, and re-inter the remains elsewhere on the property. Unfortunately, Mindy C. Pitre, an assistant anthropology professor at St. Lawrence University, who was overseeing the project said she and her team of students discovered that very little remained of the bones at the gravesites they dug closest to the Grasse River.  As a result, the bone could not be examined and information such as gender and age could not be determined, she said. The deteriorated bone fragments were returned to where they were found and reburied.  It was felt that continuing any further would have done more harm than good by removing it, so the project was stopped.  Nonetheless, the project did include the use of state-of-the-art geospatial tools including high resolution GPS data and 3-D photogrammetric software to record and digitally preserve the archeology. This project was presented as a poster at the Lake Placid conference.

Additional examples of student projects focusing on American Kestral nesting sites, Brook Trout spawning sites, wind turbine placement relative to hawk migrations, and the effects of St. Lawrence County land use changes on grassland bird habitat can be found on the SLU GIS landing page.

Working Partners:

Collaborating organizations in the North Country recognize SLU’s GIS contribution in regional geospatial efforts.  Notes Jason Pfotenhauer, Deputy Director. St. Lawrence County Planning Office:

“The St. Lawrence County Planning Office has had a long relationship with the GIS lab at St. Lawrence University having worked with Carol Cady for many years, as well as several of her mapping technicians.  We traveled to numerous State GIS conferences and NYS geo-spatial summits together and have had approximately 10 SLU students work with our office in various capacities.  Two recent larger scale county projects were the result of Carol’s willingness to supervise graduating seniors with strong GIS skills.  For the first, Carol took the initiative to pursue Walker Fellowship funding so that Sean Gannon could receive a paid internship and create the initial dataset for the County’s Agricultural Atlas.  The second project involved the collection of raw U.S. Census data to depict housing and socioeconomic data at the census tract level (which is not readily available on existing regional, state or federal websites).  Dylan Arpey undertook this initiative to help inform the County’s Assessment of Fair Housing.

The GIS lab staff have also provided us with valuable technical assistance that improved our capabilities in preparing maps for county constituents.  Most recently Dakota Casserly and Carol provided a tutorial on how to geoprocess tiffs in order to create digital models of hard copy flood plain maps.”

Star Carter, GIS Supervisor, Development Authority of the North Country (DANC) adds:

“The St. Lawrence County university/college GIS people are all fantastic and very worthy of recognition!  I work with the SLU crew a few times a year to get data or share data for infrastructure in the Village of Canton.  It’s a good relationship.  DANC has hired graduates and summer interns from both SLU and SUNY Potsdam.  A former DANC GIS Specialist graduated from SLU and is now in grad school in Colorado; and a current DANC GIS Technician graduated from SUNY Potsdam.  All of these graduates came out of their programs with enough GIS skills and practical experience to hit the ground running and be valuable employees right away.  So, from the hiring perspective of a local employer, having these GIS programs available at local universities is very important to keeping me supplied with a competent workforce”.

Summary

The St. Lawrence University GIS program illustrates the growing presence – and importance – of the New York statewide network of university programs which support regional and local GIS initiatives.   In absence of paid consultant assistance, University programs can often provide a certain level of geospatial support to governments and organizations with limited funding or geospatial capacity.  While several Empire State college programs offer both B.S. and advanced degrees in geospatial technologies, non-degree academic programs such as SLU offer high quality geospatial academic training, combined with applied field experience that adequately prepares students for a variety of geospatial workforce occupations.

For more information on the St. Lawrence University GIS Program, contact Carol Cady at ccady@stlawu.edu.


SAVI Builds a Metro NYC Presence

The last couple years I’ve been watching the growth of GeoNYC Meetup group and continue to be amazed at the far-reaching representation of individuals and companies now involved in the broad field we call “geospatial”.  One person shops, start-ups, open source/open data techies, apartment and loft based companies, strong business and private sector representation, community based mappers, and everything in-between.  A much different composition and representation than that of the other existing statewide geospatial/GIS communities and organizations that I and other colleagues of my GIS generation came through.   To date I have published three previous blog posts focusing on other contacts made through GeoNYC:  Mapzen, Mapillary and NiJel.

Spatial Analysis and Visualization Initiative (SAVI)

Also establishing a niche in the expanding geospatial space are community facing programs associated with and supported in academia environments.  One such program, which I was also introduced to through GeoNYC, is the  Spatial Analysis and Visualization Initiative (SAVI).  It was launched in 2013 and is at Pratt Institute.  SAVI is a GIS-based research lab and service center that focuses on mapping, data analysis, and visual storytelling, providing students, faculty, and community groups with the resources they need to communicate information in compelling ways. The first and only New York City college-based GIS lab open to community organizations and civic groups, SAVI offers computer access, technical assistance, professional training, workshops, and research that empower local organizations to create their own visions to improve the quality of life for their clients and constituents. At Pratt, SAVI supports students and faculty whose work reaches beyond the Institute’s campus to engage and benefit New York City.

Leading the SAVI program is Jessie Braden, who was appointed Director in the Fall of 2013.  Prior to SAVI, Braden spent three years at the Pratt Center for Community Development, a non-profit affiliated with Pratt Institute that provides technical services to community organizations.  She has also been an adjunct professor of GIS in Columbia University’s Graduate School of Architecture, Planning and Preservation Program since 2010.  Braden initially started SAVI with Pratt Programs for Sustainable Planning and Development (PSPD) Professor Juan Camilo Osorio as a volunteer side project in 2011 with the guidance of then Department Chair John Shapiro.  In addition to PSPD, Pratt Center and the Graduate Communications Design Department offered their official support, allowing the lab to come to fruition and solidifying SAVI’s focus on communities AND design.  Pratt Center also secured a $670,000 grant from NYC City Council to renovate a physical space on Pratt’s campus so SAVI can serve community organizations and students.  During the time the program was being institutionalized at Pratt, Osorio took a full-time position as Director of Research at the New York City Environmental Justice Alliance. Though not involved in day to day operations, Osorio remains a trusted advisor to SAVI.

SAVI consolidates the Institute’s GIS resources with an eye to social benefit. This means putting data analysis in the hands of community activists, students, and faculty. It also means making the products of GIS expertise visually legible and compelling so that the stories they tell will have as much impact as possible.

“At the end of the day, visual representation is as important as the quality of data analysis,” Braden observes. “Our vision for SAVI is to produce outstanding multidisciplinary projects  with the highest-caliber visual display— making the invisible visible, both inside and outside Pratt’s gates.”  Its Jessie’s belief, which I share,  that a well designed map should be able to stand on its own.  Such a product enables the reader to conduct the “spatial analysis” based on the distribution and rendering of the map data itself – with only minimal accompanying narrative to explain or describe the map.

Braden points to specific mapping projects which exemplify the SAVI cause:
Continue reading