Geospatial Business Spotlight: Systems Development Group (SDG)

Systems Development Group (SDG)  provides real property, imaging and GIS-centric software and professional services to government, education and private sector companies. The Company provides clients with the appropriate technologies to cost effectively improve tax payer services while reducing operational costs. Clients achieve operational efficiencies with SDG’s blend of expertise in assessment, imaging, GIS and software administration tools and professional services.  SDG currently collaborates with state, county and local government agencies.

Location:             44 Trenton Road, Utica, New York 13502.

Website:             www.sdgnys.com

Email:                   info@sdgnys.com

Phone:                 (315) 798-1328

Employees:        8

Established:       1991

Flagship Product: Image Mate Online (IMO) Real Property Web Portal

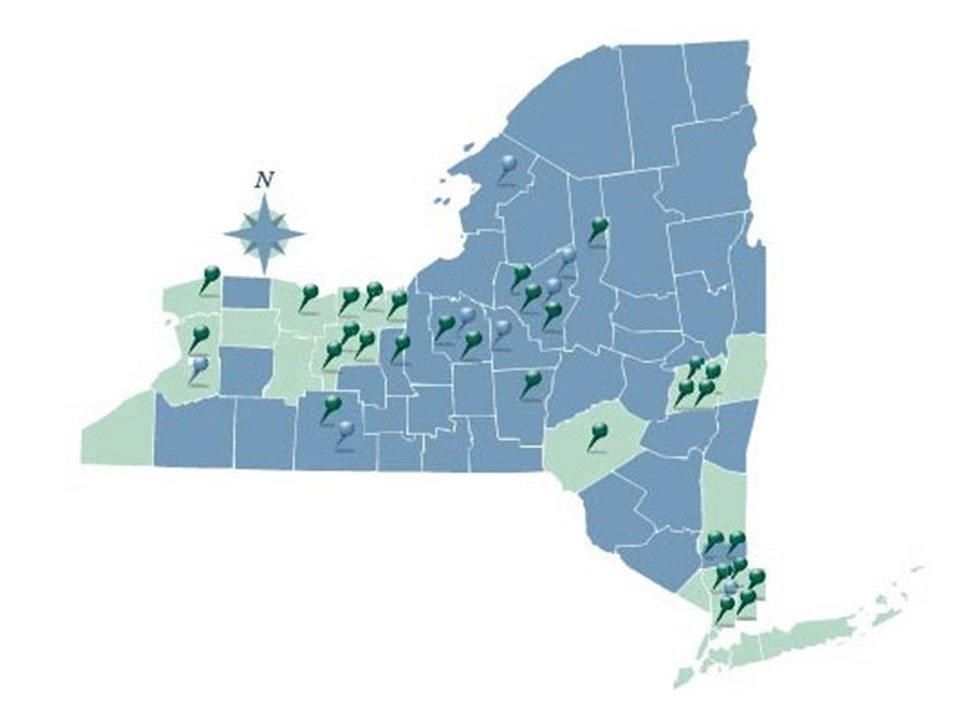
The New York State SDG IMO coverage area. Full County services are rendered in blue.  Individual City or Town services are denoted by pushpins.

Brief History

In the New York State Real Property System ( RPS V3) 1990’s era, NYS challenged SDG by noting it was technologically impossible to display photos during a live RPS V3 session.   SDG knew otherwise from similar projects performed for their parent company (Lanier Business Systems). Code being used to add imaging support to hospital applications was leveraged to build an initial application saving the Towns of Whitestown and New Hartford over $50,000 of previously ear-marked monies for Tyler-CLT Landisc street level imaging projects.

As SDG systems engineers and developers grew more familiar with assessment administration, opportunities arose to assist assessors with the development of line of business valuation software utilities including the Assessment Sales Analysis Program (ASAP)  search engine. A combination of these software tools contributed to the successful NYS Office of Real Property Tax Services (ORPTS)  RPSV4  launch.

RPSV4 was originally developed as a client server – “thick” desktop application. However, within a few short years, the internet and web application (browser) paradigm entered the software mainstream. The web quickly became a natural conduit to share real property information with the public and between Government departments and agencies. The next “organic” step forward for SDG was the development of a web portal for real property and assessment information – Image Mate Online (IMO).

IMO quickly gained popularity with NYS Counties and local municipalities throughout the early 2000’s. The State Real Property Tax Administration Technology Improvement Grant Program (RPTATIP) Grant program in 2006 and 2007 helped open the door for many additional County Real Property and Assessment Departments to deploy IMO portals. A large percentage of RPTATIP grant projects included IMO due largely to:

    • Return on Investment (ROI) – The City of Yonkers experienced a 70% reduction in Assessment Office foot and telephone traffic within their first year of IMO operations.
    • Extensibility – Ease of building upon the IMO portal to create “one stop shops” for comprehensive parcel related information.
    • Tight bindings with New York State Real Property and Assessment rules and best practices.
    • Strategic  partnerships, projects and connectivity with “best in class” players including Pictometry, Apex, ESRI, Google, VHB, TerraGo and Sewall
    • Performance and scalability – The Onondaga   IMO site performs over 2 million parcel searches a year. At 20% the size, nearby Seneca County – over 80,000 searches annually.
    • Outpost extends IMO and live RPS data collection services to the field as a low-cost tablet mobile sister service.
    • Continue reading

Deep GIS: Mapping What You Touch In the Subways

I’ve recently been communicating with Ebrahim Afshinnekoo who is Project Director for the PathoMap project based at the Weill Cornell Medicine Mason Laboratory in New York City.  Launched in the summer 2013, PathoMap was the first project of its kind, with the intent to comprehensively map and investigate the presence of bacteria and DNA on the surfaces of large urban, metropolitan environments such as New York City. And of course what better venue to collect bacteria samples in NYC than the subway system – the large subterranean behemoth home to 5.5 million riders on an average weekday.

I was drawn to the project in that it involves several common geospatial components the traditional GIS community is routinely involved with such as  data collection/data validation, data analysis, mobile apps, web mapping and visualization. To date, discussion on this geospatial research effort has focused mainly within the Cell Systems (scholarly journal) community, though with little exposure within the traditional NYS GIS community. While both the Wall Street Journal and the New York Times published articles on PathoMap in 2015 we’ve seen little work of this nature at statewide conferences or how it can promote similar geospatial analysis across the Empire State. With this in mind, eSpatiallyNewYork initiated this blog entry with the purpose of exposing the PathoMap project, and its subsequent global expansion (MetaSUB) to the larger statewide GIS community.

Data Collection

The molecular profiling initiative launched in the summer of 2013 with the help of undergraduates from Cornell University and Macaulay Honors College – which were soon to be given the appropriate moniker “Swab Squad”.  To create a city-wide profile, the research team first built an Android/iOS  mobile application in collaboration with GIS Cloud to enable real-time entry and loading of sample metadata directly into a database (Figure 1).

Figure 1: Data collection from the project included the “swabbing” of sites and subsequent analysis and data entry of the findings into a mobile app which are dynamically uploaded to the Cloud GIS database. Source: Afshinnekoo et al., 2015

Continue reading

Geospatial Business Spotlight: Tyler Technologies

Company Name:  Tyler Technologies

Business Unit:    ERP & Schools Division, Transportation Solutions (formerly Versatrans)

Website:               www.tylertech.com

Established:        1966

THE COMPANY

Tyler Technologies, Inc., is a leading provider of end-to-end information management solutions and services for local governments. Tyler partners with clients to empower the public sector — cities, counties, schools and other government entities — to become more efficient, more accessible and more responsive to the needs of citizens. Its mission-critical applications provide the public sector with the ability to streamline and automate operations, resulting in improved productivity, reduced costs and continual process improvement. Tyler’s client base includes more than 14,000 local government offices in all 50 states, Canada, the Caribbean, the United Kingdom and other international locations. Forbes has named Tyler one of “America’s Best Small Companies” eight times, and the company has been included six times on the Barron’s 400 Index, a measure of the most promising companies in America. Tyler provides a broad line of software products in seven main solution areas: appraisal and tax; courts and justice; ERP financial; planning, regulatory and maintenance; public safety; records and documents; and K-12 schools. Tyler has over 400 customers in the State of New York. Customers include large counties such as Nassau, Suffolk and Westchester as well as municipalities such as City of Buffalo, Rochester and Yonkers.

Versatrans started as a transportation planning consulting firm in 1965 and began developing software in 1980. For more than 35 years, Versatrans has developed the leading technology for school professionals to deliver the best service to their districts. In 2008, Versatrans became part of Tyler Technologies, which today employs more than 3,600 professionals. Since that time, the Versatrans® product line has been maintained and supported, and the number of development resources assigned to the product line have nearly doubled. Tyler’s transportation solutions are the software of choice among more than 1,600 school districts and pupil transportation service providers in the United States and Canada. In the State of New York, Tyler transportation solutions are used in over 280 school districts including large school districts such as Buffalo Public Schools, Williamsville Central School District and North Syracuse Central School District, but also in small school districts such as Fort Plain Central School District, Candor Central School District and Broadalbin-Perth Central School District.

PRODUCTS AND SERVICES

Tyler’s transportation solutions are built to factor together district policies and student information with hazard restrictions and realistic bus speeds. This provides safe and accurate bus stop locations and optimal routes that save money. By geocoding with the latest GIS technology using county maps, and taking into account cross restrictions, hazard zones, predator locations and more, the software picks up students from their exact location and assigns them to the safest stop. The Tyler team is composed of industry transportation professionals such as former directors, trainers, routing experts and drivers which, combined with experienced software engineers, apply their expertise and latest technology to transportation solution products, implementation and support.

Tyler’s transportation solutions include Traversa®, the Versatrans suite and Tyler Drive™.

Traversa

Traversa is Tyler’s integrated, comprehensive transportation management system. Traditionally, transportation software has been offered piecemeal, with different interfaces, different data sources and different requirements for training and installation. Traversa offers a seamless user experience for:

  • Bus routing
  • Activity trips
  • Work order tracking
  • Fleet maintenance
  • Automated vehicle location (AVL)/GPS tracking

In addition to the areas mentioned above, Traversa’s core functionality includes entity management (students, vehicles, employees, etc.), messaging and alerts, planning and reporting. Traversa is a cloud-based service supported by Tyler experts and hosted in Tyler’s SSAE16-certified data center. Tyler’s GIS services department converts a client’s data and helps verify client maps. Tyler’s transportation team provides training and data security and – when needed – disaster recovery.
 

TylerTech1

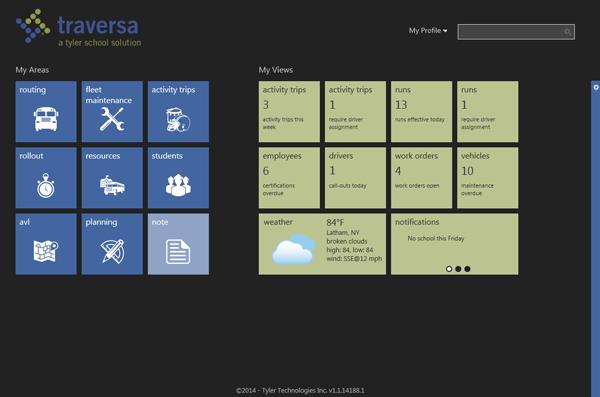
Traversa Dashboard allows school district transportation personnel to see a comprehensive view of everything they need for routing, planning and fleet maintenance.

Traversa’s technology stack incorporates portions of ESRI’s mapping software and can also interface with third-party data providers to show real-time traffic conditions, construction projects, city planning, evacuation routes, weather and more. A user can select a bus stop and zoom in to inspect the streetscape for possible safety issues. Traversa even helps a user respond to change. If a bridge washes out, he or she can quickly find an alternate path and print the new directions for drivers to use.
TylerTech2

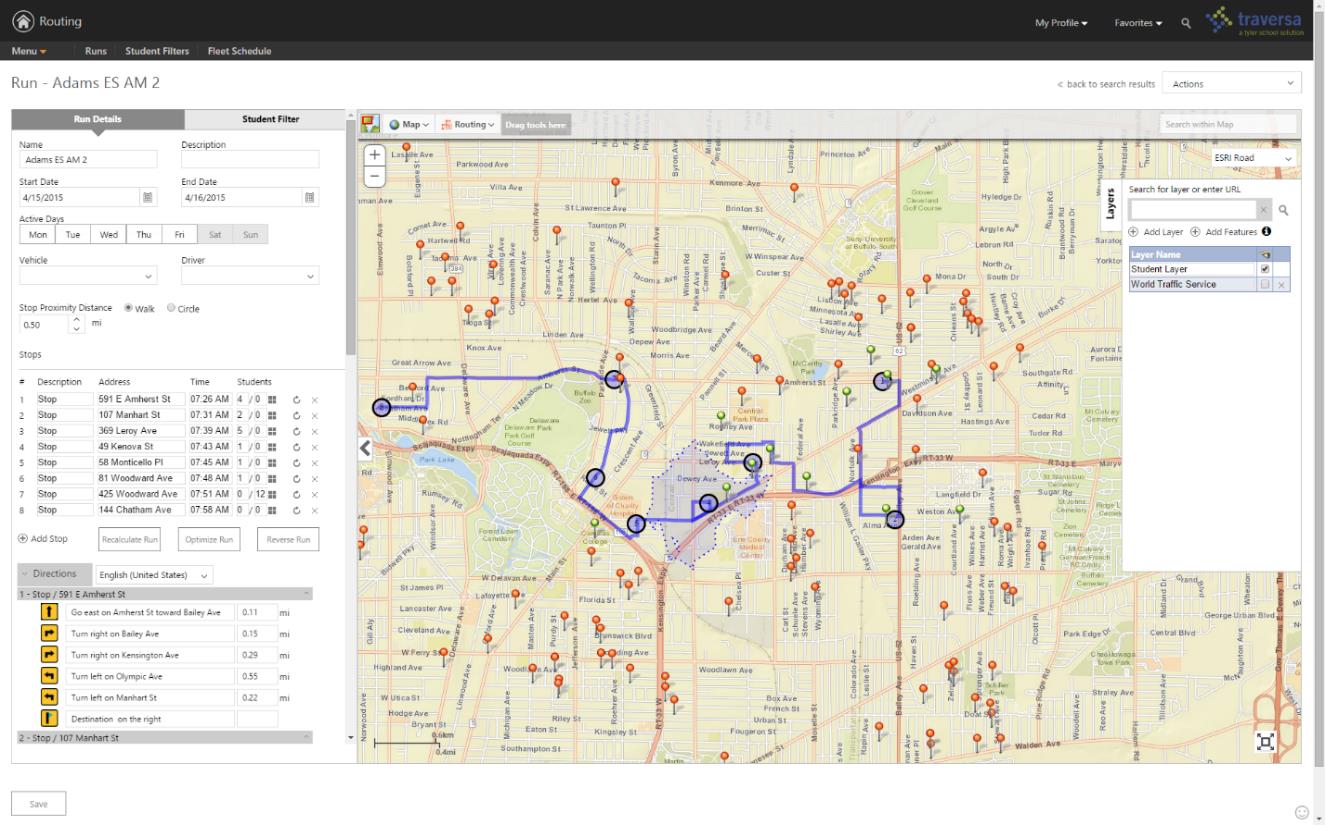
Traversa Routing allows a school transportation router to build daily runs, assign students to stops, generate driver directions, assign vehicles/drivers and more.

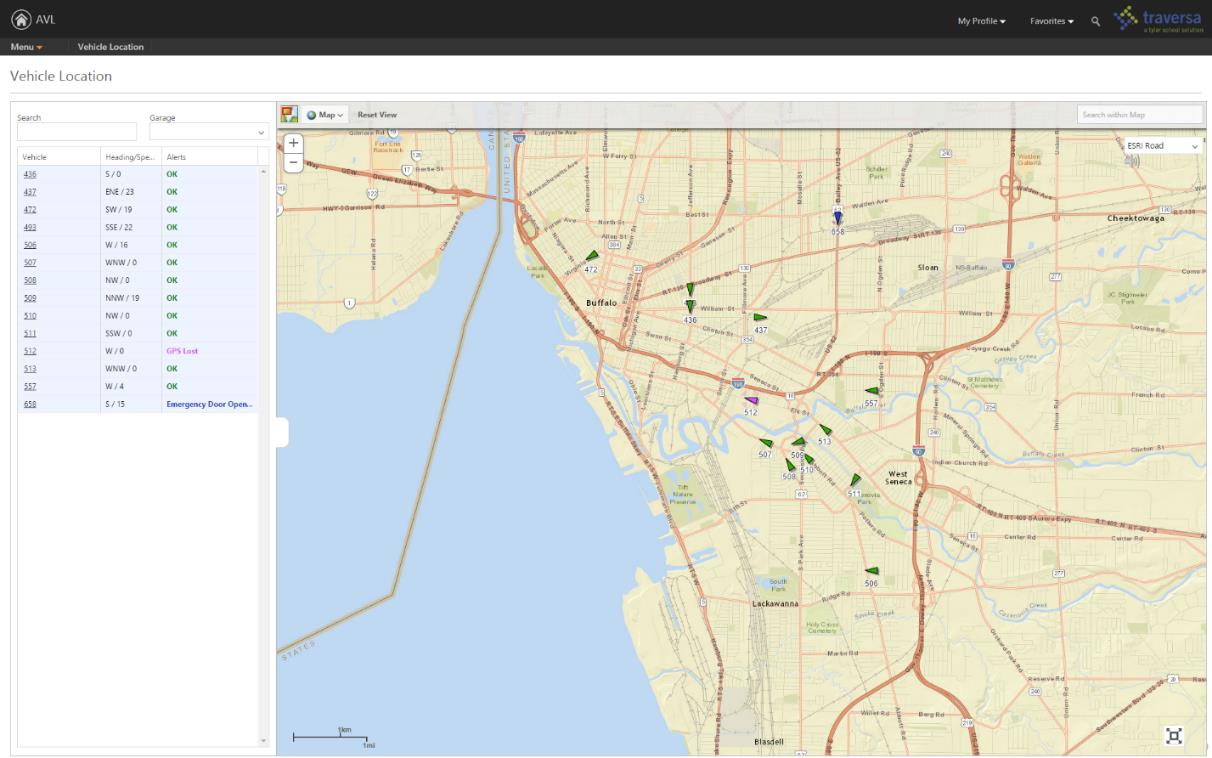
Traversa AVL brings all vehicles to one screen for the dispatcher to monitor them in real-time. Users can filter for a specific vehicle, date or time and follow the path of that vehicle. They can also assign geofences for alerts and much more.
TylerTech3

Traversa AVL allows users to view current and historical data related to the location, speed, and direction (N, E, S, W) of the entire fleet of GPS equipped vehicles.

To learn more about Traversa, follow this product overview video.

Tyler Drive

Tyler Drive is an innovative, mobile device designed for the school bus driver.  Mounted on the school bus console, Tyler Drive’s 4G service and cloud-based software closes the gaps in school bus transportation.  It stems the losses caused by outdated timekeeping software and substitute drivers navigating unfamiliar routes. Tyler Drive keeps school buses on course and generates the documentation for reporting and reimbursement.

Tyler6

Tyler Drive Dashboard presents drivers with a comprehensive view of everything they need for their shift.

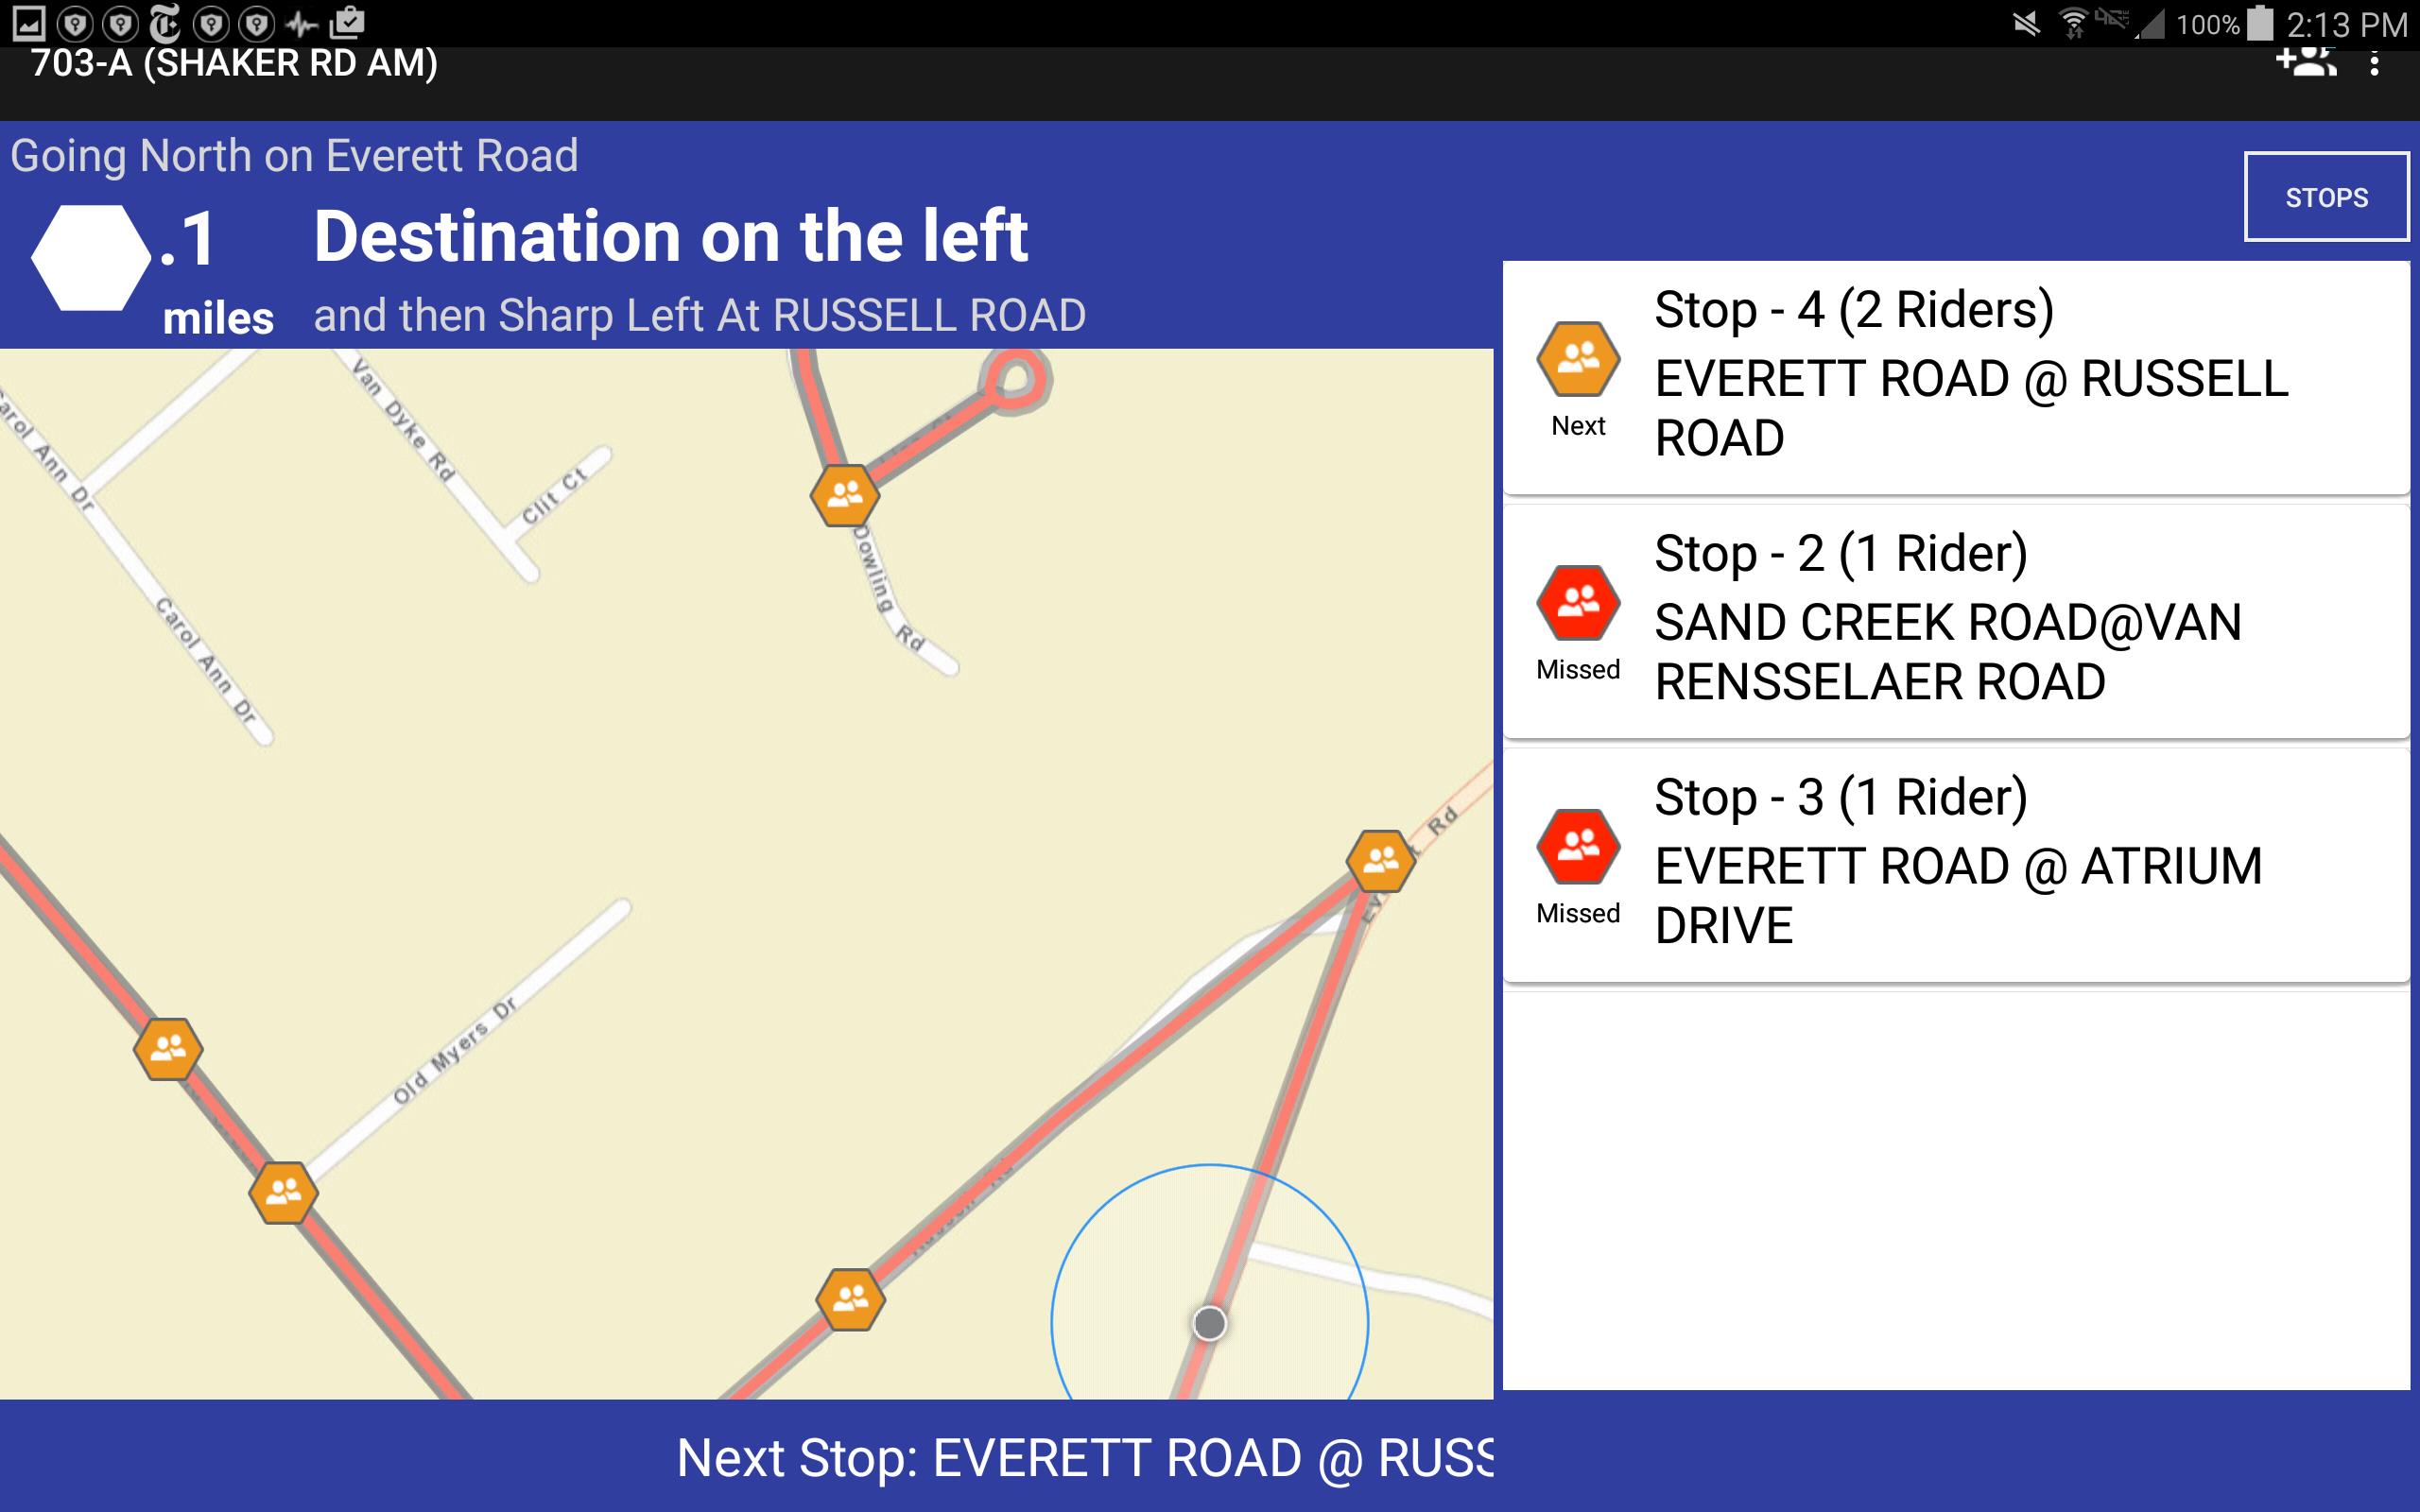
Through integration with Tyler’s student transportation routing and planning solutions, Tyler Drive is able to provide the most comprehensive and reliable route navigation available. Tyler Drive navigation map highlights the planned route with detailed directions to the next stop. If a road is closed, Tyler Drive can redirect the bus to the planned stop. Driver is presented with turn-by-turn directions and a list of students to pick up or drop off as the bus approaches a stop. If the school bus goes off the planned route Tyler Drive re-routes through the shortest path to the next stop in sequence.
TylerTech5

Tyler Drive live navigation assist the bus driver in getting to all the planned stops, picking up students and dropping them off.

Versatrans Suite

Versatrans is a complete school transportation software suite designed to help school districts efficiently and cost-effectively manage day-to-day transportation needs, transporting students to and from their educational programs on time and on budget.

  • Routing & Planning is a multi-user transportation management system that can effectively handle multiple destinations within the District’s demographics.
  • Versatrans Onscreen® is a GPS fleet tracking solution.
  • Versatrans My Stop™ is a mobile application for parents, guardians and students to know exactly where their bus is and what time it will show up at their stop — all from a smartphone or similar mobile device.
  • Versatrans Fleetvision® is a maintenance software to manage district fleet. It can auto-generate work orders, track inventory and organize employee certifications.
  • Versatrans Triptracker® is web-based field trip software, automates otherwise cumbersome processes like driver selection and personnel approval.
  • Tyler Telematic GPS™ is a hardware solution for school buses providing a complete view of vehicle, driver and engine. Tyler Telematic GPS includes: software expandability, driver scorecard, accident reporting, engine data, real-time alerting and more.

Implementation Services

Tyler’s implementation services include training on software functionality and full map preparation, including entering all district schools with grades, other buildings, walk zones, safe zones, bus stops, bell times and more. Tyler gives many options to keep customer maps current, and when the product receives electronic updates from the original map source, functionality is not affected. Tyler’s maps have the ability to utilize GPS information, draw streets simply and accurately, modify street names, and adjust run times to factors like time of day and school bus speeds. The process is automated to provide both efficiency and safety.

Geotab GPS

Tyler has a long standing relationship with Geotab Inc.; the leader in telematic solutions for heavy-duty vehicles. Tyler has been an authorized reseller for the Geotab hardware since 2010 and its close partnership with Geotab over the years has led to Tyler having the distinction as the only partner to have integrated Geotab data within the K-12 marketplace.

Esri Gold Partner

Tyler is an Esri Gold Tier partner, which enabled Tyler to be an industry-leading provider of geospatial solutions and services. As a Gold Tier partner, Esri recognizes Tyler’s commitment to providing enhanced technical and sales support, collaborative engagement and a national and multinational focus. Multiple Tyler solutions use Esri technology, including suites in school transportation, appraisal and tax, planning, permitting and public safety. Tyler has been an Esri partner for more than a decade.  Tyler’s new K-12 transportation solution, Traversa, is based on Esri technology.

 To find more about Tyler Technologies and their office in Latham, New York, visit their website.

CONTACT

Ted Thien
Sr. Vice President and General Manager, Versatrans
Tyler Technologies, Inc.
23 British American Blvd
Latham, New York 12110
Phone: 800.433.5530 ext. 131840
Email: ted.thien@tylertech.com

Geospatial Business Spotlight: Mapillary

Company Name:                 Mapillary

Website:                              http://www.mapillary.com/

Established:                       2013

THE COMPANY

Mapillary is a new and different approach to Street View. Using computer vision, Mapillary stitches together photos taken with any device to create street-level imagery for extracting geospatial data. By empowering anyone anywhere to easily create street-level imagery, Mapillary aims to create a photo representation of the world. To date, Mapillary’s community has contributed 63 million photos spanning over 900,000 miles across all seven continents.

Mapillary was founded in 2013 by Jan Erik Solem, Johan Gyllenspetz, Yubin Kuang, and Peter Neubauer, who share a vision for putting mapmaking into the hands of people everywhere. Solem, who serves as CEO, previously founded Polar Rose, a facial recognition software that was bought by Apple in 2010.  The company is headquartered in Malmö, Sweden, and has fifteen full-time employees located around the world.   Mapillary’s New York office is based In Brooklyn, NY.

PRODUCTS AND SERVICES

Mapillary allows community members to create and explore a crowd-sourced, street-level view of the world through its app, which is available for web, iOS, Android, and Windows Phone. Users can upload photos from their smartphones or other digital cameras and Mapillary then combines the images together geotagging each using GPS metadata. The resulting 3D reconstruction is created using computer vision and the company’s own open source “Structure from Motion” algorithm. Mapping isn’t limited to streets—the community has captured hiking trails, favorite bike routes, and even a stretch of Antarctica. Mapillary integrates with any mapping platform through simple APIs.

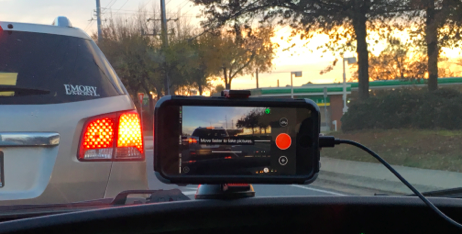
Street-level photos can be captured using Mapillary's iPhone app

Street-level photos can be captured using Mapillary’s iPhone app

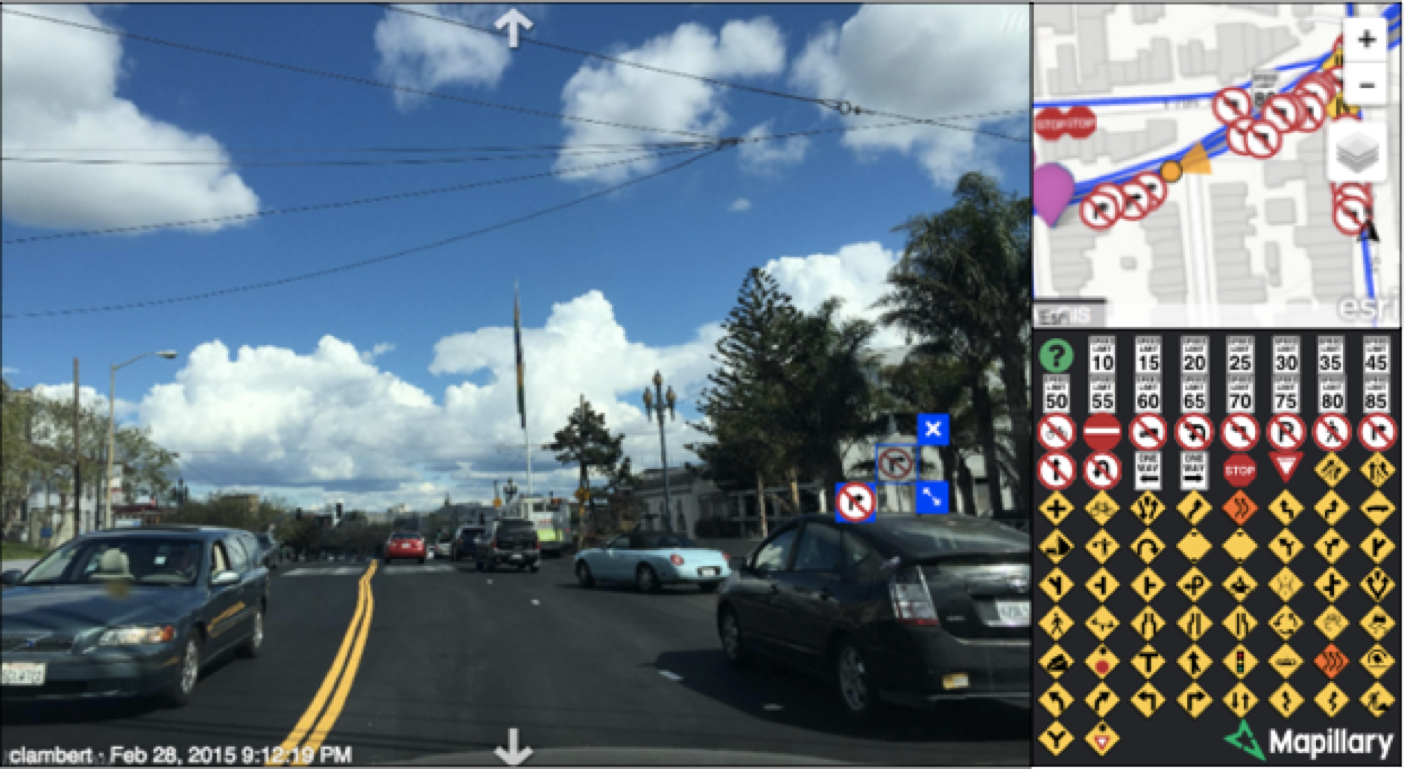
In addition to creating photo-maps, Mapillary also utilizes computer vision techniques to extract useful data from uploaded images. For instance, the software can recognize symbols on street signs in photos taken in the U.S. or Europe. This capability grew out of the app’s need to blur faces and license plates for privacy purposes, and is now used by groups like city governments for urban planning, land surveys and asset inventory. Using Mapillary with Esri’s ArcGIS platform has helped cities streamline infrastructure updates, from speed limit changes to road surface quality checks.

Mapillary uses computer vision to automatically detect traffic signs and extract geospatial data

Mapillary uses computer vision to automatically detect traffic signs and extract geospatial data

Humanitarian organizations also use Mapillary to further their initiatives. In Haiti, the American Red Cross and Humanitarian OpenStreetMap partnered with Mapillary to help record previously unmapped areas to aid disaster response efforts. Mapillary has also been used by the World Bank and other groups in Dar Es Salaam, Tanzania, to record infrastructure in flood-prone areas of the city to help plan improvements. The app is ideally suited for these sorts of tasks because it doesn’t require any special equipment beyond a basic smartphone.

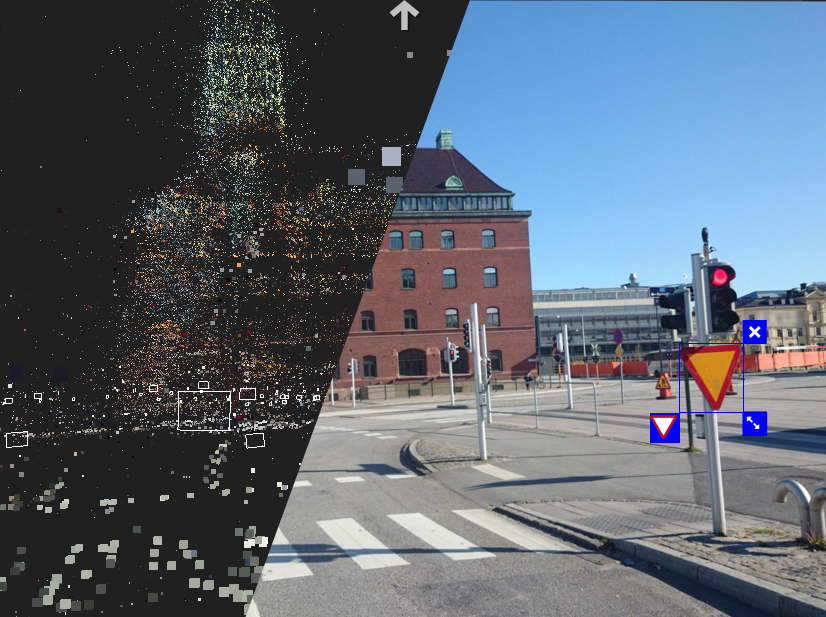
Street level imagery is reconstructed by creating point clouds from photos.

Street level imagery is reconstructed by creating point clouds from photos.

Mapillary is free to use for individuals and for non-profit or educational purposes. For commercial solutions, ranging from embedding a photo-map into a webpage to extracting specific data from images, Mapillary has several pricing plans available.

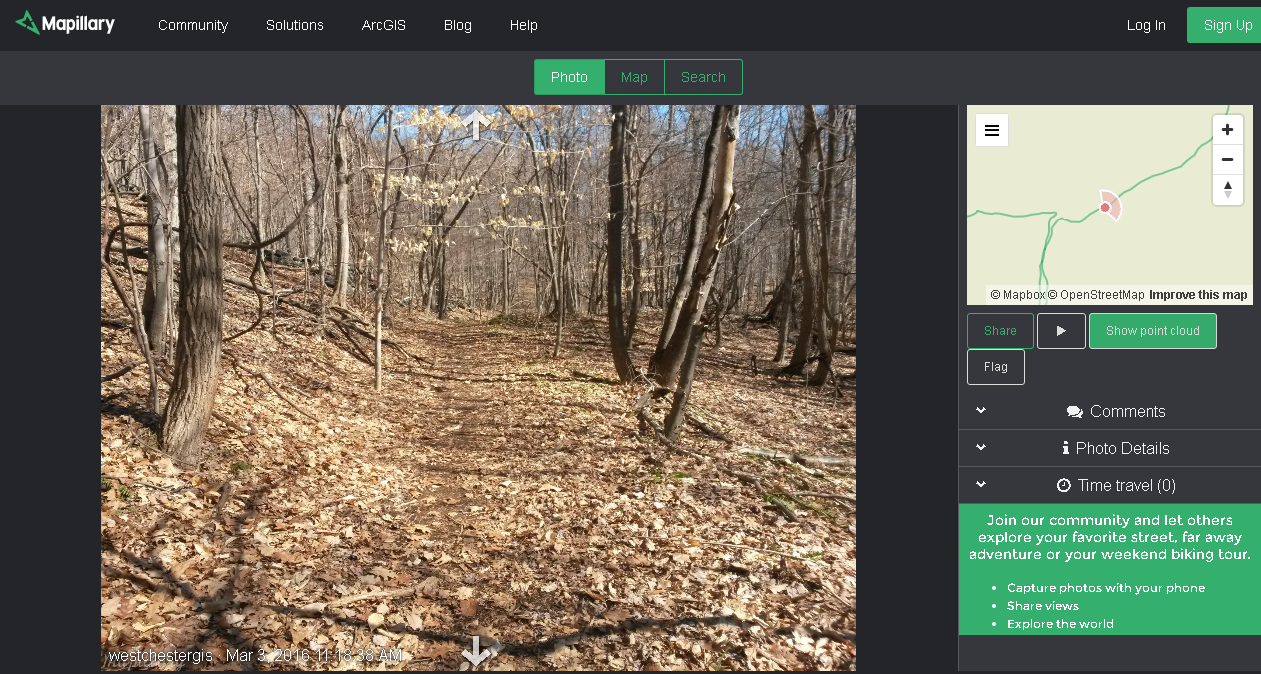
Westchester County GIS is using the Mapillary app to inventory hiking trails in County parks

Westchester County GIS is using the Mapillary app to inventory  hiking trails in Westchester County parks

To find out more about Mapillary, visit their website.

CONTACT: 

hello@mapillary.com
Bredgatan 4, 211 30 Malmo, Sweden
www.mapillary.com

10 Questions: Dale Morris

Dale Morris is one of New York State’s most recognized and senior GIS statesmen.  With a distinguished civil service career spanning 38 years, he has contributed significantly to the NYS GIS community in many capacities to say the least of directing one of the most established GIS programs in the state at Erie County – and its far reaching influence in western New York.  Ten questions seemed like a slight to an individual with such a body of professional work, so the eSpatiallyNewYork editorial team gave him permission to push it to 15 questions. Or something like that.  Enjoy.

eSpatiallynewyork:  How long have you been with Erie County?

Morris:  I’ve been in the Department of Environment and Planning since 1981. Prior to this I worked as a Planner for the Town of Amherst, NY and before that the Erie and Niagara Counties Regional Planning Board. I graduated from Cornell University with a Master’s Degree in Regional Planning in 1977.

eSpatiallynewyork:  When did you start doing GIS work?

Morris:   Working initially as a Planner for Erie County presented  many opportunities for making and using maps. In the 1980s we were still using Mylar, zipatone, and Leroy Lettering Sets for making maps, which is tedious, time consuming, and not easy to change. I began to investigate the world of digital mapping, which was still in its beginnings as a desktop product. I started with the DOS version of MapInfo. I recall how amazed we all were that we could do something as simple as draw the County and municipal boundaries on-screen. Looking back on it now it all seems so rudimentary!  Regardless of how basic it was, my Division became known for our ability to make computer drawn maps. At that time there wasn’t much concern about the database behind the maps- it was enough to be able to draw and edit maps digitally rather than by hand.

As desktop mapping grew in popularity through the 1990s a number of County departments began independently looking into it. This usually resulted in them calling me to ask for advice or data. Of course, this also meant that everyone was using different systems, and at that time it made exchanging data between systems very difficult or impossible. It was a classic case of disjointed silos of data and applications.

A change in County administration in the late 1990s brought new management in our department, and I was challenged to prepare a white paper for moving the County further forward into the digital mapping world. I proposed creating a new County Division that would be empowered to centralize decisions relating to geospatial technology (by then we could use terms like “geospatial” without getting blank stares!). The Office of Geographic Information Services (OGIS) was born in 2001, and I have been the Director since then. So for me personally, my career started with both feet in the urban planning field, then a gradual shift to one foot in planning and one in digital mapping, and then finally both feet in GIS. I do very little “typical” planning anymore, even though OGIS is part of the Planning Division.

While OGIS is an Office within the Department of Environment and Planning, only a portion of our work is related to this department. We work very closely with our IT shop to maintain and operate the County’s GIS technology infrastructure, and with other departments and outside agencies who either use our enterprise GIS technology or who need direct assistance with their mapping needs.

eSpatiallynewyork:  What’s the relationship between your office and Niagara County?

Morris:  We have a formal Intermunicipal Agreement (IMA) with Niagara County for GIS Services. The agreement is for a five year period and we are well into the second of these five-year agreements. Erie County hosts Niagara County’s geospatial data and provides on-line mapping services to Niagara County. The two counties are connected by a high-speed microwave link, which operates very well. In essence, Niagara County is simply like any other Erie County department that taps into the Erie County enterprise GIS network. In addition to providing Niagara County this service for a fee, the IMA provides a framework for backup of GIS data between the two counties, and as well defines a GIS “mutual aid” protocol for sharing of GIS resources and staff in the event of an emergency.
Continue reading

Queensbury Geospatial: A Model for NYS Town Government GIS

Northbound New York State Northway Exit 20 leads to the Town of Queensbury which is the seat of Warren County.  With a 2010 population of 27,901 the town covers nearly 65-square miles including shoreline along Lake George and lands within the Adirondack Park.  Further into town, several of the usual NYS town government program offices are located at 742 Bay Road including staff and resources which support the town’s geographic information system (GIS).

GIS Background

Prior to 2002, Queensbury officials had worked with consultants to establish initial GIS capacity including the creation of ArcIMS applications and investing in multiple ESRI desktop licenses.  In 2002, the town’s GIS initiative changed significantly with the hiring of George Hilton.  Hired as a GIS Specialist and planner, George was brought onboard to build and advance the town’s  GIS program.

Prior to arriving in Queensbury, George had honed his GIS skills while a student at Central Connecticut State University and later in government positions  in the Denver and Kansas City areas as well as three years with Westchester County.  Now, 15-years after his arrival, George oversees a program which can be considered an exemplary NYS municipal government GIS program.

Current Queensbury Geospatial Products and Infrastructure        

George designs, codes and maintains the Town’s Interactive Mapper (Firefox and IE only) and a host of other ArcGIS.com map viewers including Fire and EMS, Planning and Zoning, and Phase II Stormwater Infrastructure.    He also supports emerging mobile mapping and data collection efforts which includes Trimble GPS units with Trimble Positions to collect data and update feature services and Geodatabases in the field.  The town also collects data (hydrant inspections, site inspections) with ArcGIS Collector using feature services and make maps available through ArcGIS Online.

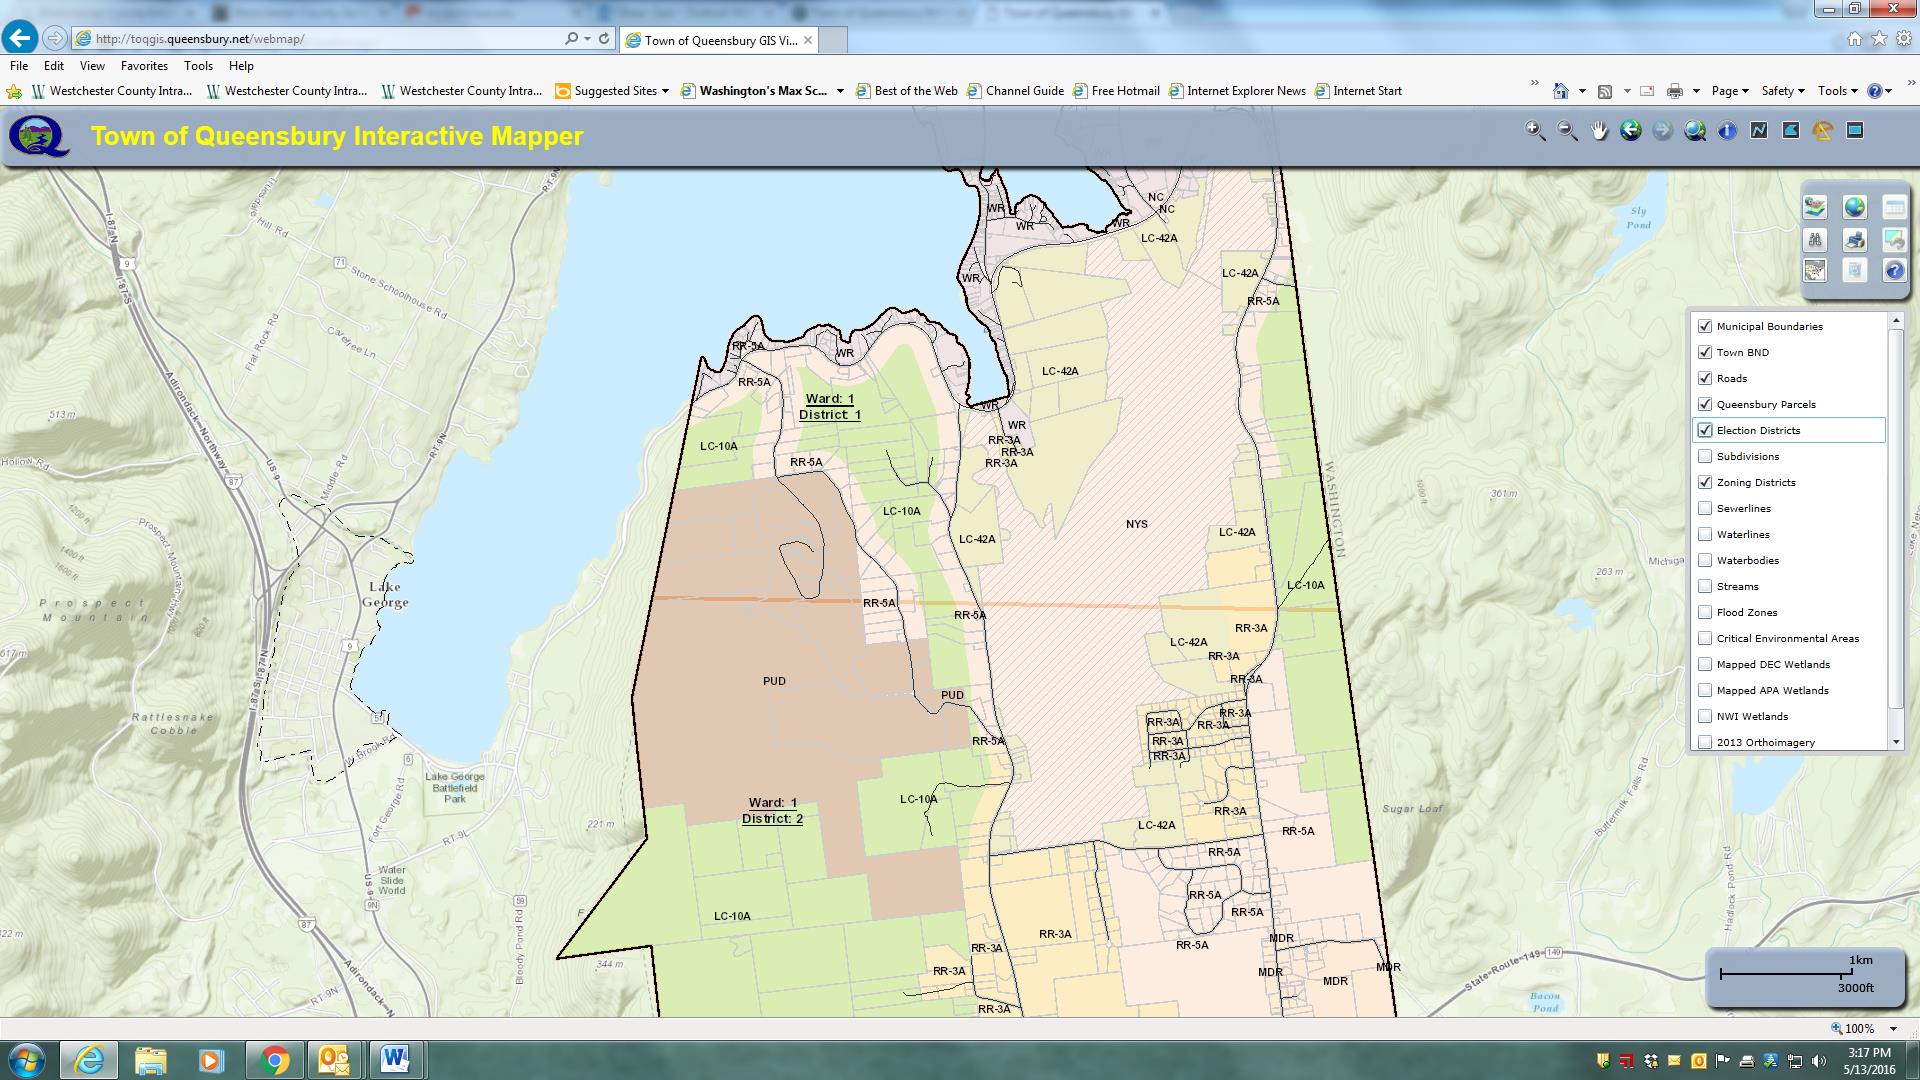
The Town of Queensbury Interactive Mapper includes many locally developed datasets as well as data from other authoritative sources including Warren County, NewYork State and the Adirondack Park Agency.

The Town of Queensbury Interactive Mapper includes many locally developed datasets as well as data from other authoritative sources including Warren County, NewYork State and the Adirondack Park Agency.

Other software components – much of which has been self-taught – George uses inlcludes Sybase (RPS) and SQL Server with ArcSDE as well as ArcGIS Server, ArcSDE, ArcGIS (Advanced), and Spatial Analyst.  The town is currently at ArcGIS Server 10.22 and are testing 10.4 with plans to upgrade very soon.  He also works with QGIS and Global Mapper from time to time.  Global Mapper has been particularly helpful in importing updated USGS topo quads (DRGs) in GeoPDF format into our GIS.

The Queensbury GIS program has grown from primarily providing support to the Planning Department to becoming a very important resource for many departments across town government.  Both the Town Board and Town Supervisor are very supportive of GIS and recognize how much of an important tool GIS has become to the Town.

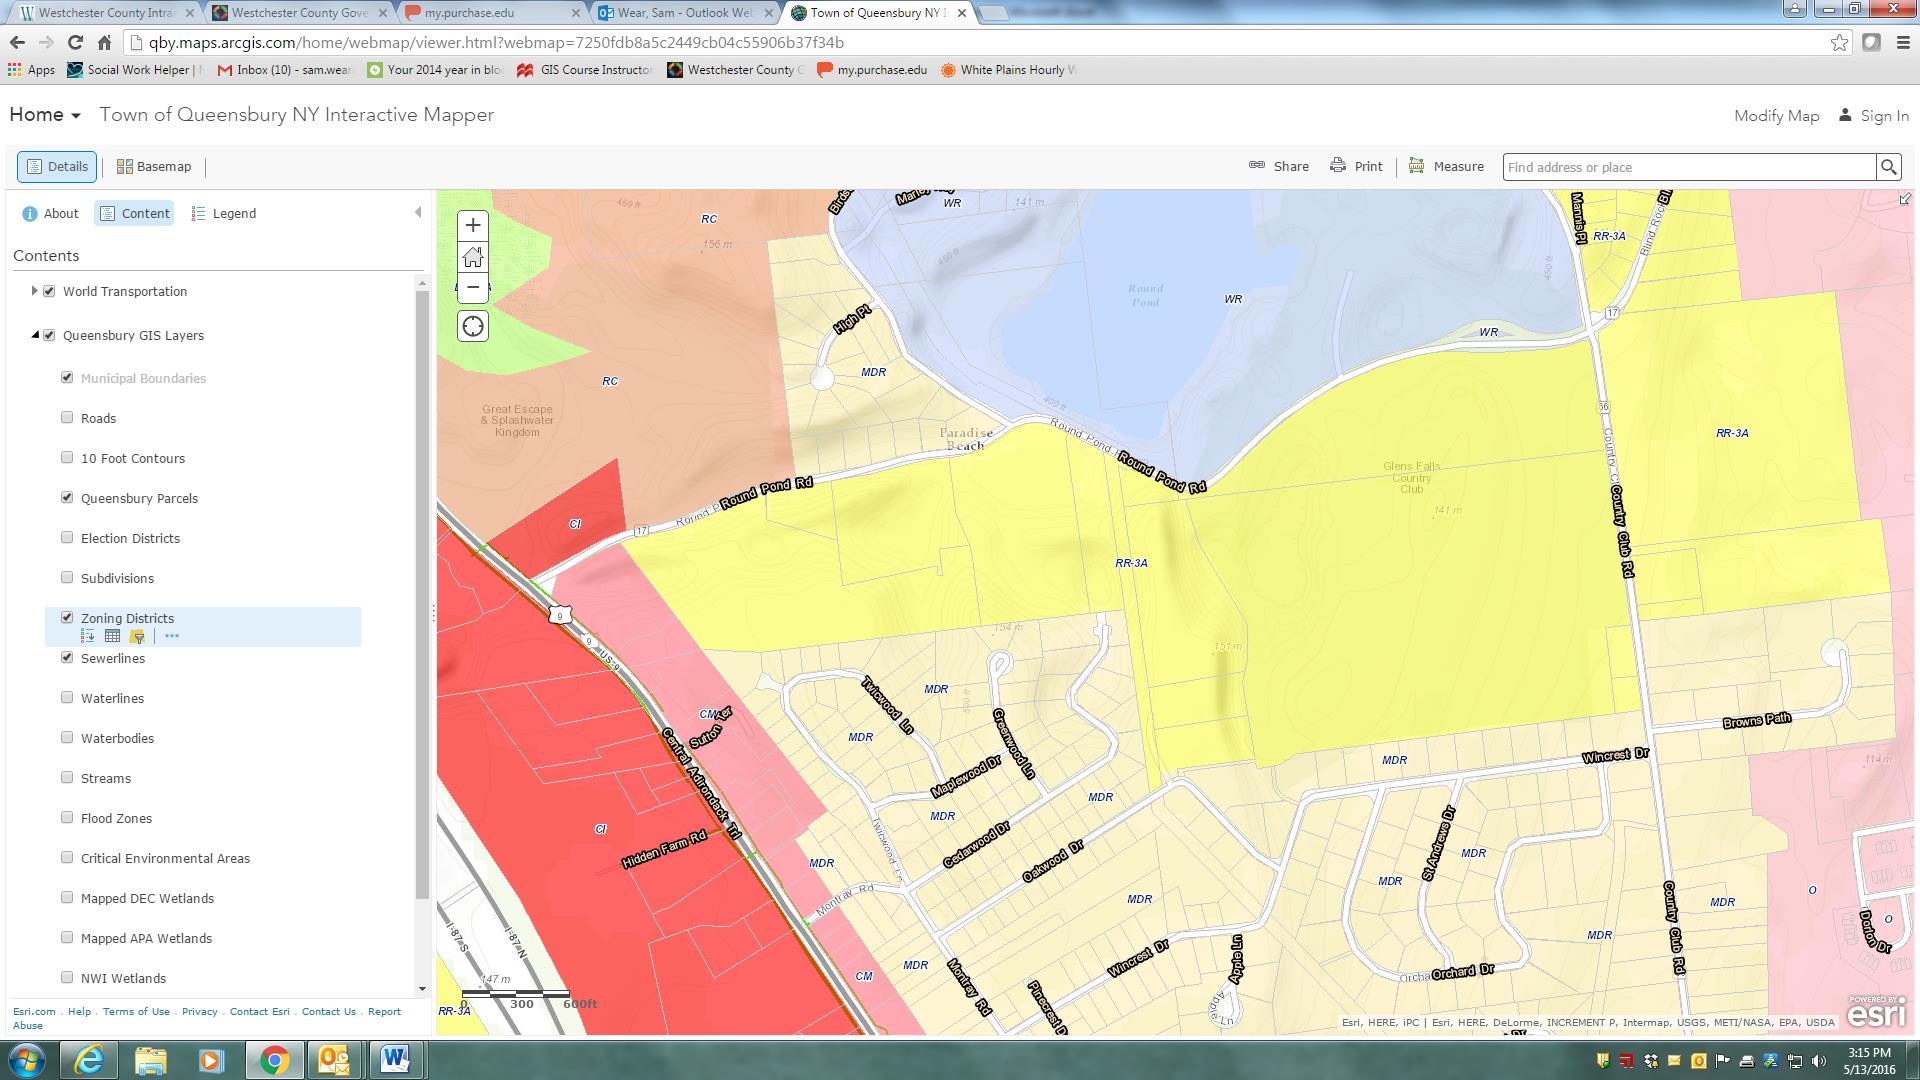
Parts of the Town of Queensbury is actually within the Adirondack Park and therefore subject to stringent land use regulations. This image highlights zoning districts on the southeastern shore of Lake George – within the park boundaries.

Parts of the Town of Queensbury is actually within the Adirondack Park and therefore subject to stringent land use regulations. This image highlights zoning districts on the southeastern shore of Lake George – within the park boundaries.

George maintains an excellent working relationship with Warren County GIS which is under the direction of Sara Frankenfeld where he obtains  parcel data.  The town creates town-wide datasets (zoning, subdivisions, hydrants, infrastructure, environmental, street centerlines, address points, etc) which are then shared back with the County. Referencing her ongoing GIS work with Queensbury, Sara explains:

“George is great to work with and especially in a rural environment where we don’t have any other full-time GIS staff within our respective local governments, it’s so helpful to have a colleague to bounce things off.  He’s a very good sounding board and when I’m considering starting a new project, I often call to get his thoughts.

 We’ve worked closely together on a number of projects.  We recently worked together to streamline the way e-911 addresses are assigned, and this has been a huge improvement to workflows in both of our offices, as well as in the Real Property office, the zoning/building inspectors departments, and the assessors’ offices

 Our current cooperative project is a NYS Archives LGRMIF grant funded project to make the SAM data, along with information about truss roofed structures (as required by a NYS law that went into effect 1/1/2015), and other relevant data such as hydrant locations, available to first responders via an Android/iOS app”.

George also works closely with several state agencies including the Adirondack Park Agency, NYS Parks and Historic Preservation, NYS Department of Environmental Conservation, and NYS Information Technology Services (ITS).  Queensbury Town Supervisor John Strough adds:

“Like today’s computers, I do not know how we lived without him. His GIS services have helped us map the town’s infrastructure structures, trail systems, historic places and many other location details that we absolutely need to comply with the needs of today’s municipal world. I am in his office requesting his services almost as often as am in my budget officer’s office, that’s how important GIS services have become to the town.

Broad User Base

The town enjoys a wide user base including ESRI desktop clients in Planning, Water and Sewer, Assessor, and Parks departments though George is commonly called upon to assist in more detailed data creation, analysis, and cartographic products throughout town government.  He also provides training for users in many local, regional and statewide agencies including the Warren County Soil and Water Conservation District, the Champlain Watershed Improvement Coalition of New York, and the NY State Conservation District Association at their statewide conference in Auburn and Syracuse.

Additionally, George provides maps and data analysis for many community groups, nonprofits, schools, as well as for other municipalities and quasi-governmental agencies in the area.   Queensbury if one of the few municipalities in the area with a GIS program and is often asked to provide support throughout the area.

Creating More Queensbury GIS Programs

While George brought years of GIS experience to the town when accepting  the job, his ability to advance the town’s GIS program has certainly been augmented by ongoing political and administrative support.  Such combination of experience, competitive salary, technical skills and political support is often hard to replicate –   or even find for that matter –  in small town governments across the Empire State.

The Town of Queensbury GIS program speaks to the importance of educating elected officials in the benefits and  importance of investing – both financially and institutionally –  in the role of geospatial technologies in small town governance.  While the Queensbury GIS solution might be considered a typical for similar-sized communities across the state, it nonetheless can be a model for the GIS community to aspire to and replicate.

Visit the Town of Queensbury website at http://www.queensbury.net or George Hilton directly at GeorgeH@queensbury.net.


NYS Local Government GIS Common Core: Part 1

At the 2015 NYGeoCon in Albany, I presented a paper focusing on several GIS applications which often support and justify GIS/geospatial development at the local level.  I refer to these applications and program areas as the “GIS Common Core” and it was my intent to use the presentation as a starting point to expand the discussion further as part of this blog.

While some of the GIS Common Core program areas are not new to the discussion, several factors have contributed to elevating these day-to-day GIS functional areas to the mainstay of local government geospatial efforts.  Though these factors and opportunities vary greatly across the state, some of the more obvious reasons why “GIS Common Core” applications are becoming the foundation of local government programs include:

  • Improved large-scale spatial data integration across key business applications (assessment-inspections-permitting-public safety-utilities)
  • Better address standardization as a result of E911 implementation
  • Significant improvements on the integration between GIS and AutoCAD technologies
  • Establishing capacity to fulfill ongoing/permanent regulatory and reporting requirements (MS4)
  • Broad deployment of software programs in which using/collecting/maintaining X,Y data is implicit and available by default; GIS/geospatial is often no longer considered an “optional” feature
  • Leveraging flexible, easy-to-use browser-based applications which are accessible in a wide range of environments, particularly in the growing government mobile work force.  A work force which expects maps anywhere anytime.
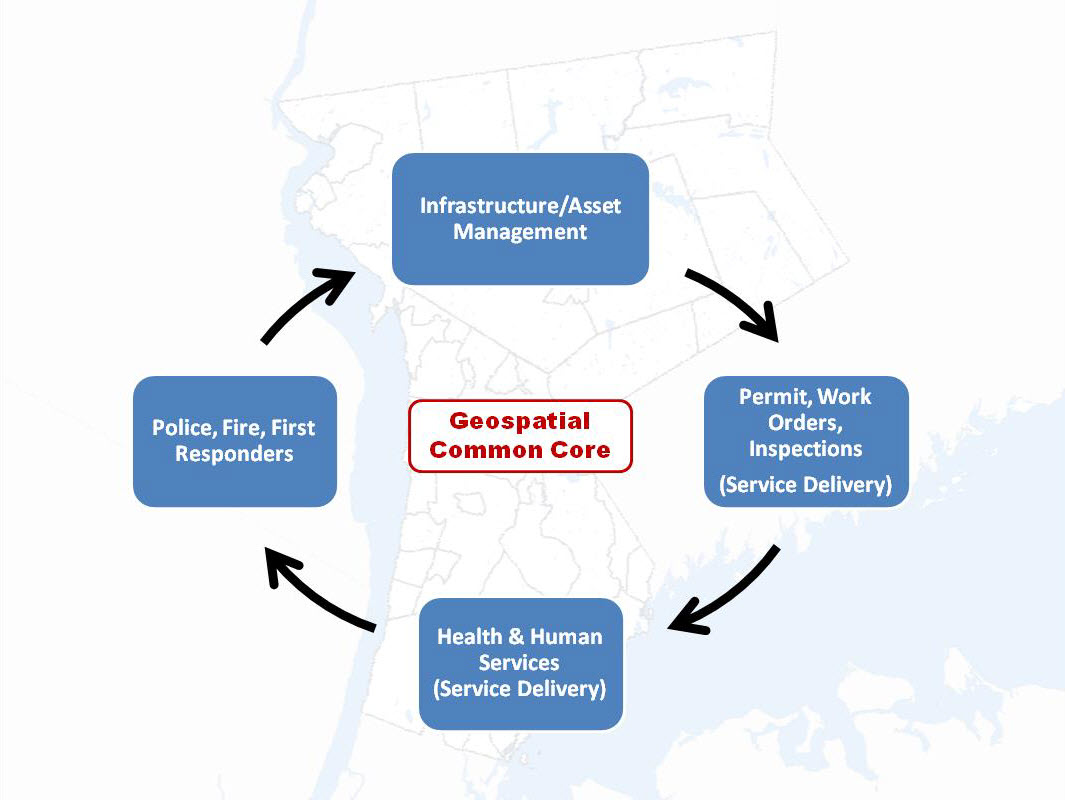
GIS Common Core application areas in local government

“GIS Common Core” application areas in New York State local governments

Continue reading

Relative vs. Absolute Accuracy Revisited

I recently attended a presentation by Dr. Wende Mix, Associate Professor, Geography and Planning Department at SUNY Buffalo State entitled “Field Data Collection Using Smart Phones, Tablets, and GPS Devices:  A Case Study Though the presentation focused on using mobile devices for field data collection, augmented with high resolution aerial imagery,   Dr. Mix inadvertently helped revisit a debate on the long standing geospatial issue of relative accuracy vs. absolute accuracy. While relative mapping accuracy issues are certainly pertinent as part of the emerging Volunteered Geographic Information (VGI) and crowd sourcing data collection movements, Dr. Mix’s presentation highlights street feature data collection which was once the mapping domain reserved only for surveying and engineering disciplines.

So how do mobile devices intersect with spatial accuracy?  If at all?   Tons of geospatial data being collected with mobile devices (particularly by the growing Smart Phone market), data of varying scales and accuracies by personnel with varying degrees of training and expertise.  But at the end of the day, with all the disparate data combined, the data mash-up stills supports most decision making needs.  Quite a difference from the efforts of New York State Association of Professional Land Surveyors (NYSAPLS) which for years lobbied that similar street feature mapping across the state could legally only be done by licensed surveyors.  So does spatial data accuracy matter anymore?

Of course it does, though an easier answer is that data is normally collected of sufficient accuracy to support specific business needs.    But perhaps the best way to illustrate how this new market of mobile devices plays into the relative accuracy vs. absolute accuracy discussion, one first needs to consider the body of geospatial data development since the late 1970s/early 1980s.

Early Data Development:  With many early government GIS programs getting started with public domain U.S. Geological Survey  1:100000 (+/- 166’)  Digital Line Graph (DLG) or 1:24000 (+/- 40’)  digital files, widespread use of the technology, particularly within the engineering communities and urban environments, was slow to take hold because the data was considered too generalized and “not accurate” enough. Beyond the human resources needed to manually digitize and convert hardcopy manuscripts, much of the first generation of geospatial data was cheap to acquire and develop.  The trade-off was that the geospatial data was of limited accuracy and content due largely to the generalized nature of the source documentation.

However, as data accuracy improved through photogrammetric projects creating many urban and metropolitan land bases at larger and more accurate scales (1”=200’  & 1”=100’), including a wide range of planimetric datasets such as building footprints, edge of pavement, hydrology, bridges and even stone walls – so did the associated data development costs.   However, the increased accuracy and completeness of the data resulted in a much broader acceptance and use within the engineering community.   And certainly some of this increased user acceptance was also a result of the growing inner-operability between GIS and AutoCAD software packages.  Improved  GPS technology (as well as with “Selective Availability” being discontinued in 2000) also gave government and industry additional tools to further push the limits of high accuracy feature mapping, though as a whole, industry mapping costs remained high.  And cadastral programs continued to mature making large scale digital tax map datasets available providing even more reference and content to both hardcopy and online mapping efforts.  Overall, particularly in the urban environment, higher accuracy datasets with features being mapped a higher degree of positional accuracy,  were slowly replacing the more generalized first generation land bases.

Referencing Data Collected in the Field:   With many urban and even rural land bases now created and available online as a service and augmented by a variety of high resolution aerial imagery services, a large portion of data collected by mobile devices can now be easily referenced and spatially edited to its right relative location. (And as an added benefit, normally at a lower data development cost.)  Most mobile devices now include cameras, so including a picture of the selected feature adds even greater context to its relative location.  Using desktop tools, fire hydrants can be moved to their right relative X,Y location in front of the proper house.  Catch basins can be spatially adjusted to register in their right relative locations on street corners, street signs in their right relative location in the right-of-way, or the locations of underground storage tanks or septic fields moved to their right relative location on the proper tax parcel.  Overall, an industry witnessing an increased body of geospatial data that is not absolute accurate, but relatively accurate and ultimately more useful to a larger community of users – including the public works and engineering disciplines.   (It is noted that some workflows and business models may limit or not include resources for the editing of data; thus requiring high accuracy data capture in the field).

Dr. Mix’s presentation unintentionally illustrated how far we’ve come in context of building and using relative accurate geospatial datasets.  The content of her presentation was both typical and timely as much of the work across the state with mobile devices is being used with public infrastructure and street feature mapping.  While non-survey grade GPS units initially introduced some of these very same issues, the new mobile devices, and in particular Smart Phones, are game changers in context of affordability and ease-of-use.   It is to be seen long term how Smart Phone data collection will impact the low-end GPS hardware market.  (Any Google search on “GPS vs. Smart Phone Data Collection” will provide a long list of opinions on the matter.)

There is no question absolute (or near) accuracy – and its high price tag in data acquisition – is still mandatory for engineering and design/build projects.  But for nearly all other business needs, relative accurate and complete datasets will continue to augment design/build projects and support government and industry decision making.    All said “everything happens somewhere – and it is increasingly being mapped in its right relative location”.