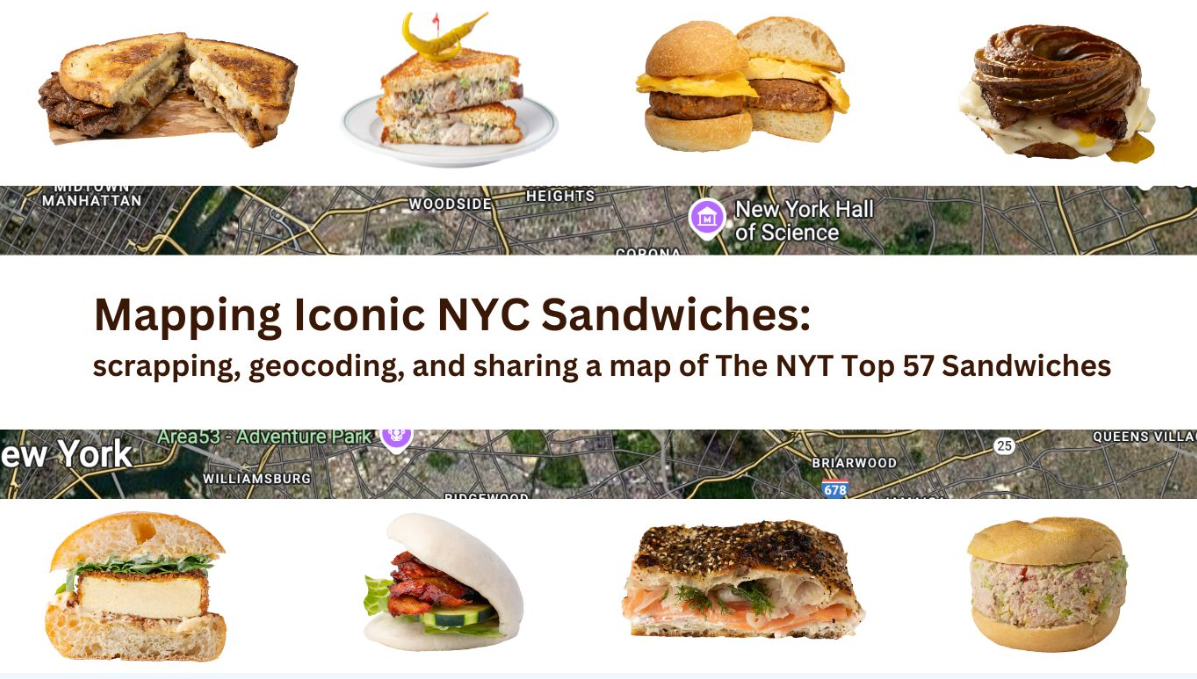
Nothing worse than being in a place where you know there are zillions of places to shop and eat, but you really don't know where anything is. Around the next corner? Street level at the next subway stop? Somewhere right in front of you? Tired of being lost in this regard, NYC sandwich guru and data scientist Dan DeWitz took matters into his own hands and came up with his own solution for the next time he has that certain palate craving.
Background
Held this past March 22-30, Open Data Week is an annual festival of community-driven events organized by the NYC Open Data Team at the Office of Technology and Innovation (OTI), BetaNYC, and Data Through Design. It is held each March to coincide with the anniversary of the City’s first open data law which was signed in March 2012. Additionally, one of the highlights of Open Data Week is the NYC School of Data which includes a myriad of workshops, panels, and demonstrations with the intent of demystifying the policies and practices around data and technology in the City. This year’s program included over 30 presentations. At its foundation, an immerseful week of users, open data, open software, and open development discussions.
Not all of the week’s presentations are specific to GIS technology as topics such as law, journalism, government budget transparency, data analytics, career development, even data comics, and much more are covered in the agenda. And as Open Data Week has evolved over the years, there’s also always been a healthy dose of the traditional GIS and mapping concepts which the geospatial community is actively engaged in. Though always the space for the unexpected mapping product and presentation, too. Something a little out-of-the-box and out of the norm. This year was no different.
Yeah, a Sandwich Map.
Background
As part of the Data Week’s events, Dan DeWitz led an online interactive hour-long workshop showing attendees how he built the sandwich map from scratch. Working from his Jupyter Notebook, DeWitz illustrated how he used ChatGPT as a coding partner, as well as python code, to scrape a list of sandwich names – and associated information – from a website and create an interactive sandwich map using the Google Maps API and GitHub Pages.
New York Times Article
Central to the map was a New York Times article published February 18, 2024. Authored by Nikita Richardson, the article was based on three months of work by New York Times Food staff which covered all five boroughs in search of heroes, bodega staples, breakfast specialties, veggie entrees, and much more. The intent wasn’t to necessarily rank the sandwiches but much more so to illustrate the culinary diversity across the New York City urban landscape. As mappers and always worrying about icons and how to symbolize our work, the images depicting the sandwich categories are a treat, too. Which DeWitz was able to scrape and use in his web map as well.
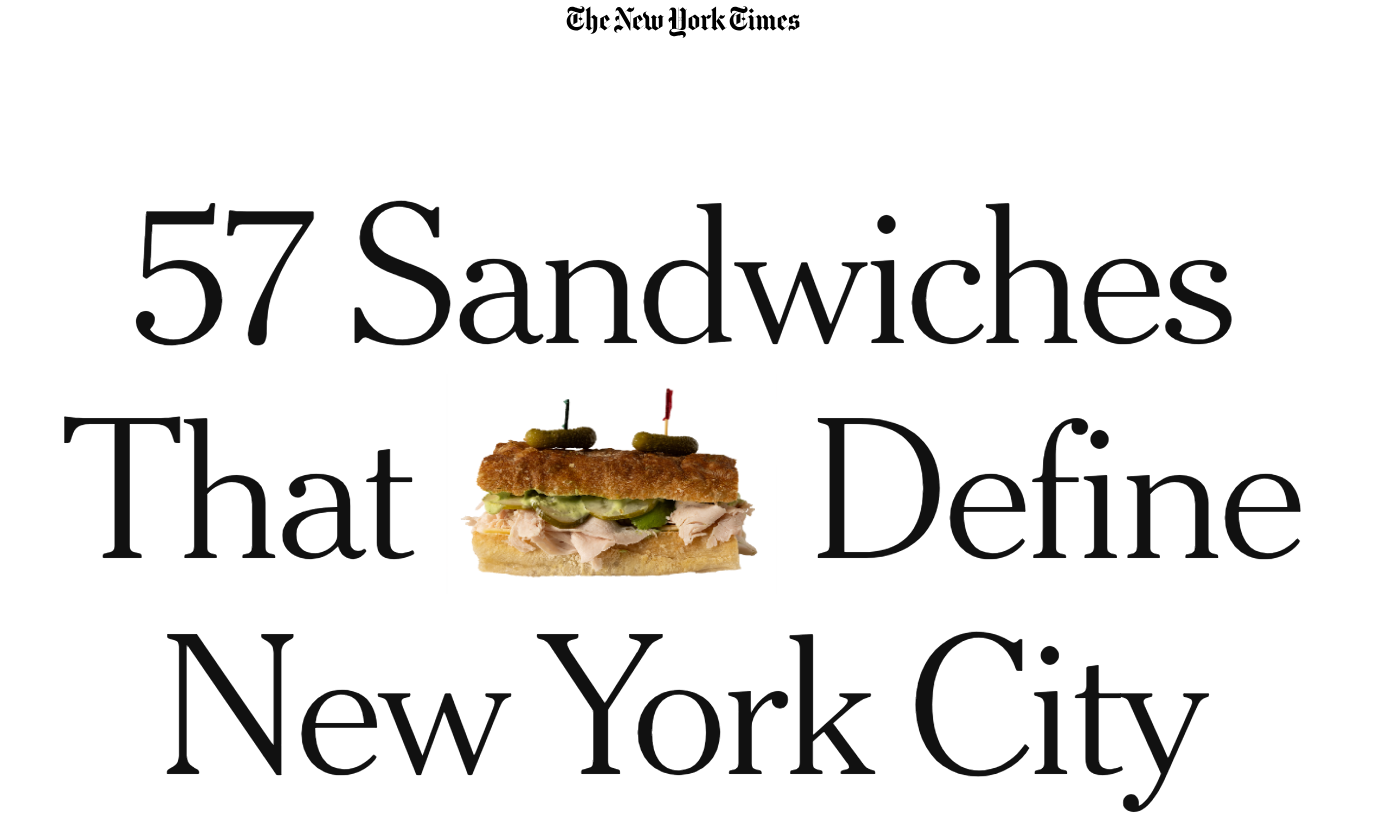
Nine sandwich types were identified in the article: Breakfast Bangers, Hero Worship, Veg In, Pastrami City, Gotham Greats, “Let Me Get, Uhh..”, Diner Party, Honorary New Yorkers, and Extremely Online. Something for everyone!
Scraping and Geocoding
DeWitz’s initial dialog with ChatGPT to start building and ultimately generating the sandwich map is shown in the image below. He initially intended to be able to parse each of the variables shown – sandwich and restaurant names, addresses, description, and images from the Times website, but determined large language models (LLM) like ChatGPT still can’t parse websites just from a URL. Dewitz notes, “I used Python to scrape data from a page and guiding the model through each step: identifying the structure of the site, selecting relevant HTML elements, handling errors, formatting results, and mapping the output – all while applying judgment about what matters and why”.
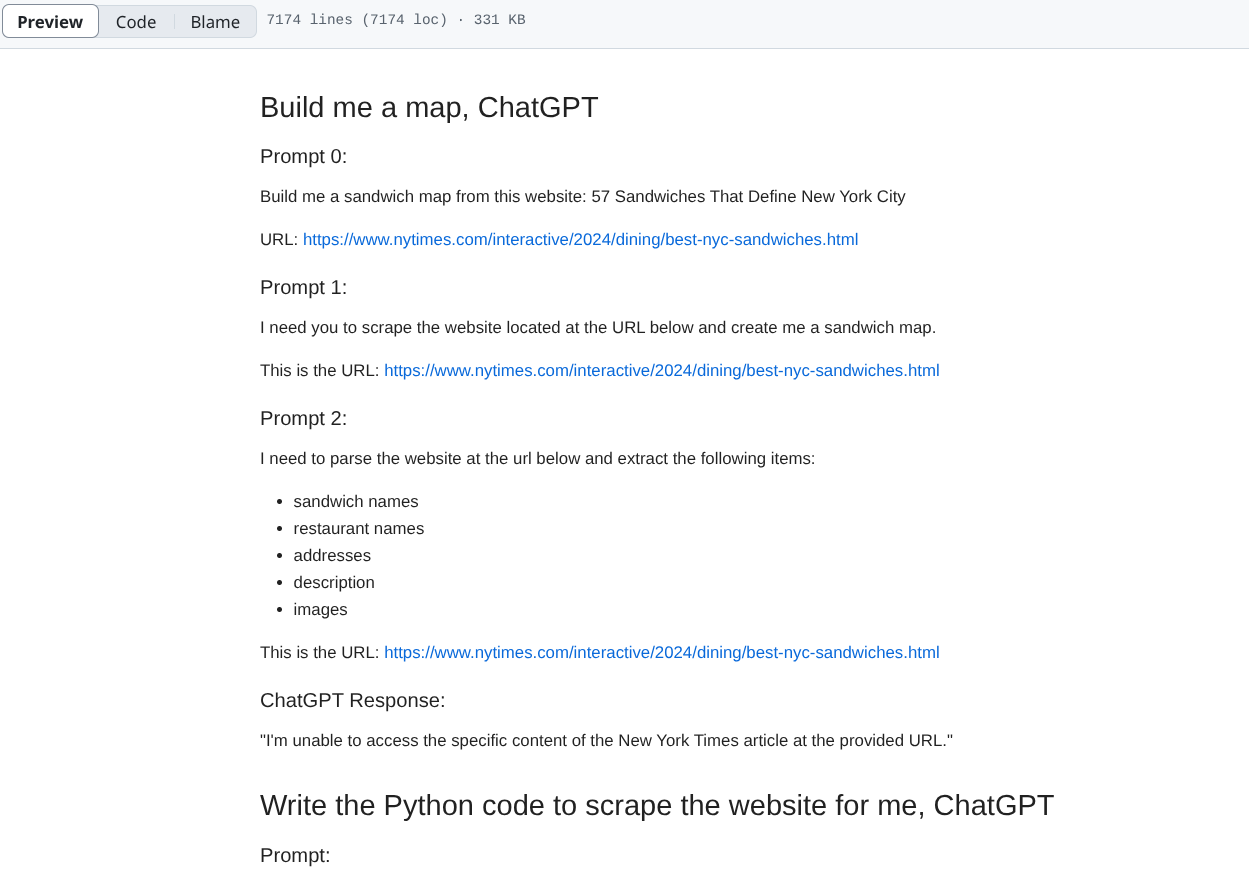
DeWitz’s initial dialog with ChatGPT to start building and ultimately generating the sandwich map
For geocoding, DeWitz used the Google Maps API and ChatGPT handled writing most of the python code – most of which was the focus of his Data Week presentation. DeWitz felt the Google Maps API did a good job with the addresses, particularly in context that the restaurant addresses included only a cross street and didn’t have the city name or zip – as presented in the Times article. For example, just passing the text (address) below, which was scraped from the article, to the Google Maps API, was good enough for most of the shops and the API returned the correct lat/long:
135 India Street (Manhattan Avenue)
For the remaining shops that did not match, he queried the API by restaurant name and then manually looked at the results and filtered as needed. The web map base map also comes from the Google Maps API.
In the Jupyter Notebook, the interface is made up of individual cells with some containing text and others with code that can be executed. The blocks with a tinted blue background are the ones where users write and execute Python code. This code sometimes comes AI engines such as chatgpt.com or the chatgpt assistant which is integrated into the Jupyter Notebook. All of the major steps and coding DeWitz used in the development process is available on his GitHub page which is available here.
The End Product
For those wanting to take a deeper dive into the process and product, a recording of the actual Data Week online presentation can be found at this YouTube link. And of course, here’s the online Iconic NYC Sandwiches interactive map.
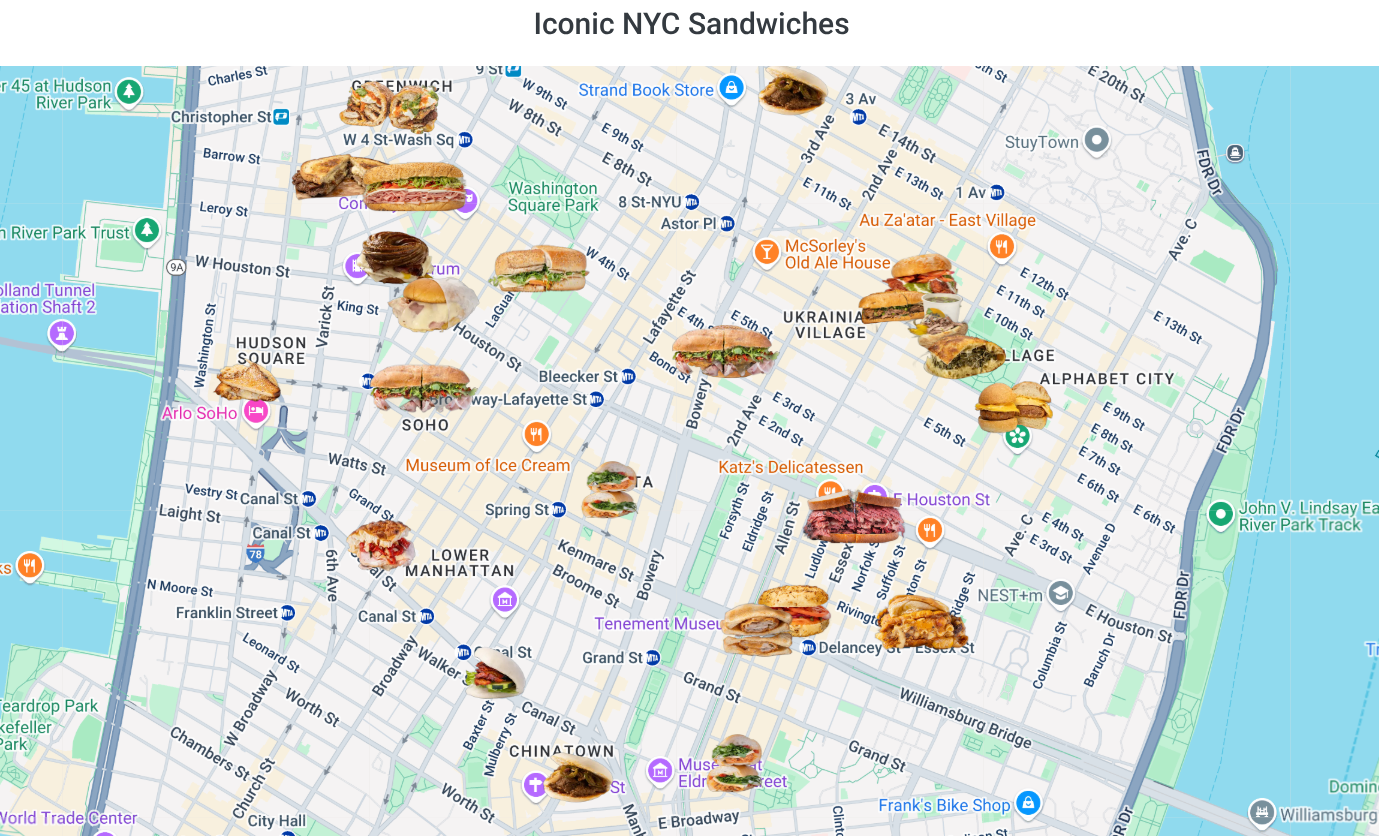
Interesting to note in context of determining that he actually accomplished what he set out to do, DeWitz feels the process had a built in quality assurance test. “Since I’m making a map, the output itself is the quality assurance test— especially that now I can actually use the map to go to restaurants and shops.”
It certainly appears that the QA passed.
Contact:
Dan DeWitz
dewitz.dan@gmail.com

