2017 NYS Spring GIS Conference Specials

The last couple weeks I’ve been engaged in the following cutting-edge enterprise geospatial issues:  (1) staring at the sky on a daily basis,  (2) monitoring the temperature, and (3)  hoping the remaining snow to melt and the leaves to hold off in budding – both at the same time.  After nearly 33 years in County government and its boiled down to this! Why?  So we can get our aerial photography flown over the next 10-days to support our 2017 countywide base map update.  The heavy snow March 14th really set us back and the window to capture the photography is closing quickly.

So at any rate, its been easy to lose track of upcoming Spring 2017 regional one-day GIS conferences and meetings over the next 4-6 weeks.  Most of the Spring 2017 shows are held in locations accessible via a maximum 2-4 hour drive from furthermost parts of the Empire State, offer a wide range of geospatial topics and presentations, provide excellent networking opportunities among colleagues and industry representatives, and are generally light on the wallet.    For those unable to make or justify the big lift of getting to the uber ESRI conference in San Diego later on in the summer and/or chasing GISP certification credits these venues are for you.

Sounds sweet, right? So consider the following and get your travel approvals in order:

GIS-SIG 26rd Annual Conference, April 11th, Burgundy Basin, Pittsford, NY.  Unfortunately I cannot make GIS-SIG this year as it is one of my most favorite statewide one-day shows.  GIS/SIG provides the premier geospatial professional forum in the Rochester/Genesee Finger Lakes/Western New York region for GIS practitioners focusing on trends and policies relating to new geospatial technologies and current projects.  With a loyal following, the size and content of the GIS/SIG conference is broad enough to often substitute as an annual state conference for many GIS practitioners in the western half of the state. This year’s conference again includes vendor displays and an agenda covering topics such as mobile data collection, drones, 3D GIS, and ESRI software updates, as well as a keynote address from Dr. John R. Schott, founder of the Digital Imaging and Remote Sensing Lab at the Rochester Institute of Technology (RIT).  Corporate sponsorship keeps the price tag of an individual registration at under $100 for the day which also includes lunch. Online registration is still available and while you are at the GIS/SIG website you can also see the many resources and links GIS/SIG provides to its user community.  This is a great show and if you have the opportunity to attend. Highly recommended.

Long Island GIS (LIGIS)  2017 Spring User Conference, April 26th, SUNY Farmingdale, Farmingdale, NY.  LIGIS meetings and conferences have grown in structure and content over the last few years and this spring’s April 26th meeting will continue to illustrate the improvement among the Long Island GIS stakeholder user community.  Scheduled presentations from government, academia, and industry are on the agenda including topics covering mobile applications, MS4 data collection, 2020 Census Bureau update, and GIS & hydrofracking among others. Located in central Long Island on the SUNY Farmingdale campus, this is a not-to-miss conference on “the Island” for those with limited travel budgets.  Make plans to attend.  Those interested in attending can monitor conference specifics at the LIGIS homepage.

Northeast Arc User Group (NEARC) Meeting, May 15th, University of Massachusetts, Amherst, MA.  Spring NEARC meetings are conveniently located in Amherst, MA which is easily accessible to the Albany Capital District and GIS professionals in eastern New York State.  Unlike GIS – SIG, which is software vendor independent, this show is very much ESRI centric and packed with high quality user presentations. Even though only one day, the show has grown to be so popular that it now competes with the larger multi-day GIS shows and conferences across New England.   Price tag for attending:  $65 which includes lunch.  If you can afford an overnight, activities the evening before downtown Amherst and a hotel room at the UMass conference center make it even more worth your while. (As of the day of this blog post 4/4 the May 15th agenda was still in development; I did submit an abstract!).  Registration will open mid-April.  If your organization is an ESRI shop – this is a Spring show not to miss.

Westchester GIS User Group Meeting, May 11th, Purchase College, Purchase New York. As one of the largest geospatial meetings in New York State, the Westchester GIS User Group Meeting is a free one-day conference held at Purchase College. Made possible by financial support from exhibiting vendors and conference facilities provided by the college, the draft 2017 agenda  features user presentations from County government,  Westchester County municipalities, nonprofits including the Goodlands Project, and ESRI. There is also free conference training: At lunch “Leveraging Suvey123 for Mobile Data Collection” with instructor Larry Spraker and post-conference “Getting Started with How to Build Great Web Apps” with ESRI’s Mark Scott.   Also, sponsors get to present 5-minute “Lightning” talks over the course of the day.  The Purchase College location provides easy one-day access across the metropolitan NYC area, as well as the broader lower Hudson River Valley and southeastern Connecticut. Agenda and other meeting  specifics – including registration – are available from the Westchester County GIS website.

Other Venues:  If you are in the Metro NYC area don’t forget to check the GeoNYC Meetup calendar for ongoing meetings across the city. Subject matter and participation is pretty amazing.  And/or the many other geospatial related Meetups in the region covering big data, data visualization, agriculture mapping, and everything inbetween including drones. A little further removed geographically from the Empire State is the Northeast Geographic Information Society (NEGIS) conference on April 27th in Ashland, MA. You can follow and learn more about NEGIS via their blog.

The entire Empire State GIS community is fortunate enough to be close enough to a range of regional geospatial meetings and conferences which are accessible from most areas of the state and provide many of the same benefits of larger shows and not nearly as expensive.

Safe travels!

GIS Common Core Part 3: Health and Human Services (HHS)

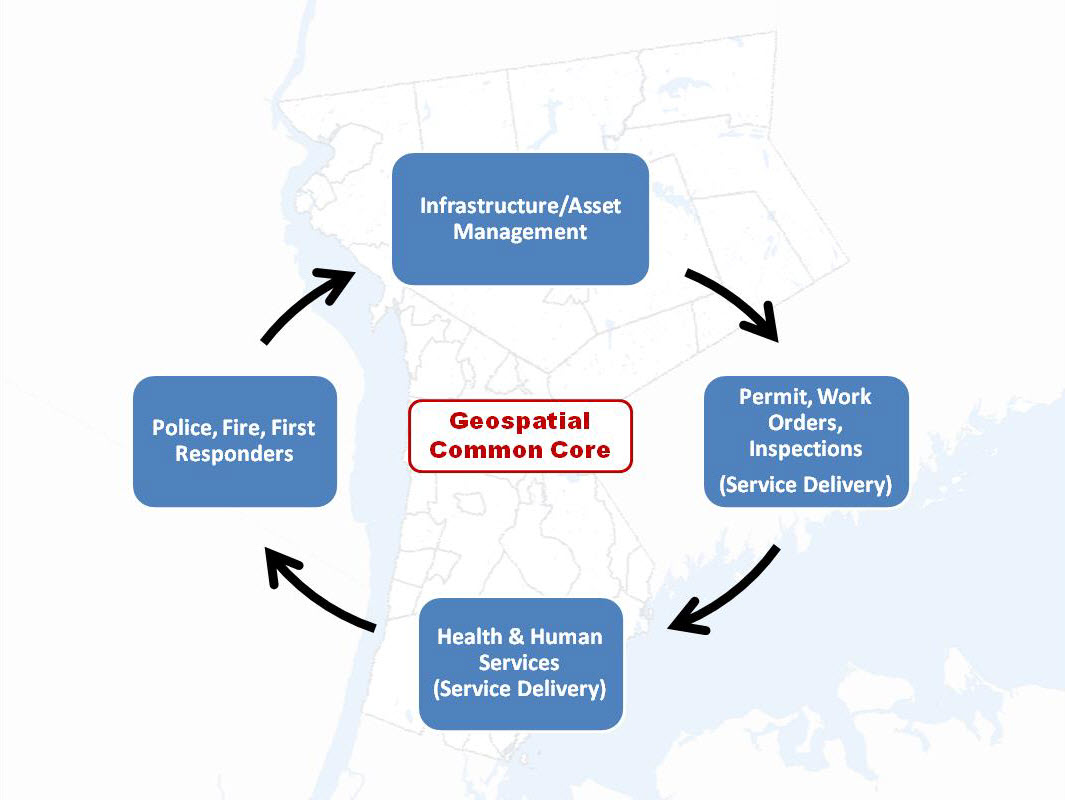
Through a sequence of articles posted in eSpatiallyNewYork, I have proposed a series of GIS applications which provide a framework for establishing and maintaining  GIS/geospatial programs in local  governments (villages, towns, cities, and counties) across  New York State.  These applications areas are referred to as the Geospatial Common Core, many of which are integrated with local government office and administrative business systems.  Others are utilized in the support of regulatory reporting programs.    Together, the Geospatial Common Core contribute towards building sustainable geospatial capacity for local governments.   This is the third installment of the series.

“GIS Common Core” application areas in New York State local governments

The first article entitled Part 1:  Infrastructure and Asset Management focused on the growing and critical role local government GIS geospatial programs continue to serve in rehabilitating and maintaining the decaying and outdated New York State – and national – public infrastructure.  The second article Part 2:  Work Orders, Permitting, and Inspections (WOPI) published in March 2016 focused on geocentric software packages which are ubiquitous in government programs supporting work flows in areas such public works, health, planning, clerk, assessment, buildings/code enforcement and inspections.  Organizations investing and integrating WOPI systems with GIS will continue to help build long-term sustainable geospatial programs in local governments.

Part 3:  Health and Human Services (HHS)

Health and human services can often be broadly defined from one location to another but for the purposes of this article it includes a wide-range of government programs including, but limited to, public health services, social services, public assistance, youth and veterans programs, disability programs, housing and homeless services, child protection services, as well as the important network of contracted service providers governments rely upon in providing counseling and related support services.  I have long been an advocate of building geospatial capacity in these local government program areas.

Why?

Statewide local government HHS budgets typically dwarf other local government operational program areas with regard to annual appropriations.  While I am not a budget analyst and admittedly it’s sometimes difficult to follow the money trail of appropriations vs. revenues vs. actual tax payer costs in county budgets, here are a few examples to illustrate the size and magnitude of HHS programs in a selected 2017 NYS county budgets (Data/information from County webpages as noted):

  1. Stuben County 2017 Budget. (Page 3).  Pie chart indicates nearly 47% of the appropriated budget dedicated to Health and  Economic Assistance/Opportunity (includes Social Service disciplines) program areas
  2. Ulster County 2017 Budget. (Pages 1 & 2). Table and pie chart indicate nearly 42% of the appropriated budget dedicated to Public Health and Economic Assistance/Opportunity program areas
  3. Erie County 2017 Budget. (Pages 93, 159, and 174). Appropriations (rounded in millions) in Health ($86M), Mental Health ($47M) and Social Services ($591M) account for almost 50% of the $1,455,000,000 recommended general fund budget.  (Note:  There are other references to the 2017 budget being closer to $1.7B). Either way, HHS budgets are a significant portion of the overall county budget
  4. Albany County 2017 Budget. (Page 34). Employee Count table lists 657 of 2,535 County employees (26%) are in the Child, Youth, and Family Services (170), Social Services (308), Mental Health (90), and Dept. of Health (89)
  5. Suffolk County 2017 Budget. (Pages 101 and 366).   Appropriations (rounded in millions) in Health Services ($249M) and Social Services ($628M) account for nearly 30% of a recommended $2.9B budget
  6. Monroe County 2017 Budget. (Pages 157 and 275).  Appropriations (rounded in millions) in Human Services ($536M) and Public Health ($62M) account for nearly 50% of an adopted $1.2B budget
  7. Continue reading

Geospatial Business Spotlight: Bowne Management Systems

Company Name:         Bowne Management Systems, Inc.

Location:                     235 E. Jericho Turnpike, Mineola, NY  11501

Website:                      http://www.bownegroup.com

Employees:                 35

Established:               1982

Bowne Management Systems (BMS) is unique in the technology world as the firm has been in business since 1982.   2017 marks the 35th anniversary of BMS and they proudly state “we innovate every day.”

The collective team of professionals are not only fluent in IT and geospatial technology but in the core competencies of any business – professional project management, diverse and adaptable skill sets and most importantly, customer relationships and satisfaction.

BMS is associated with their affiliate, Sidney B. Bowne and Son, a nationally recognized civil engineering and surveying firm that has been in business in New York State since 1895. The shared corporate culture and values has kept Bowne in the forefront for almost 125 years.

BMS has developed core practices to support the mission critical operations of local government. This client base includes local government at all levels, as well as State and Federal government agencies, and private clients. BMS has core practices in the following areas:

  • Public Safety
  • Land Records and Tax Mapping
  • Infrastructure and Asset Management

In addition to these core practices, BMS has robust operations in the areas of IT Staffing and Governance, Geospatial Cloud Deployment, Disaster Recovery and Business Continuity Services, and Project Management and Oversight. Some recent notable work includes the following:

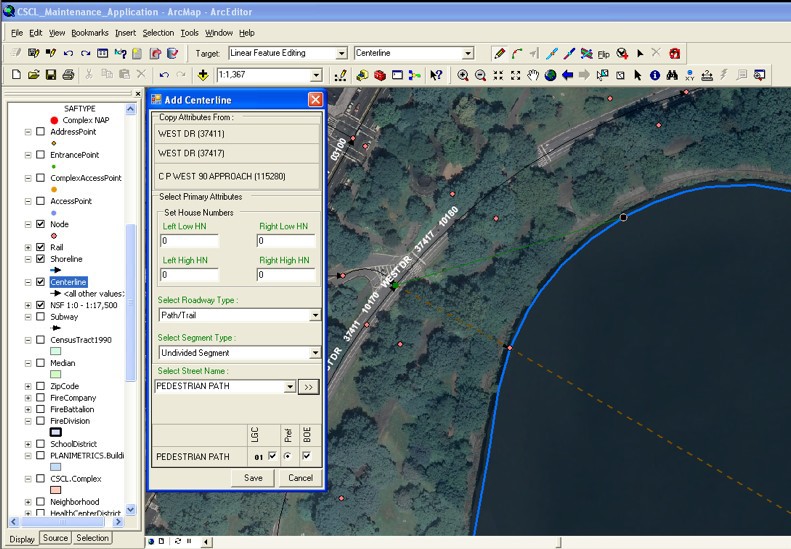
Support for New York City’s emergency  dispatch   systems   – BMS built the street center line (“City- wide Street Centerline” [CSCL]) and the required maintenance  system. BMS also built and maintains  the software that transforms CSCL data to the geofile format required  by the NYPD and FDNY dispatch systems. To date, also most 50 million e-911 calls have been successfully handled by CSCL and Bowne developed software. Continue reading

Geospatial Business Spotlight: Systems Development Group (SDG)

Systems Development Group (SDG)  provides real property, imaging and GIS-centric software and professional services to government, education and private sector companies. The Company provides clients with the appropriate technologies to cost effectively improve tax payer services while reducing operational costs. Clients achieve operational efficiencies with SDG’s blend of expertise in assessment, imaging, GIS and software administration tools and professional services.  SDG currently collaborates with state, county and local government agencies.

Location:             44 Trenton Road, Utica, New York 13502.

Website:             www.sdgnys.com

Email:                   info@sdgnys.com

Phone:                 (315) 798-1328

Employees:        8

Established:       1991

Flagship Product: Image Mate Online (IMO) Real Property Web Portal

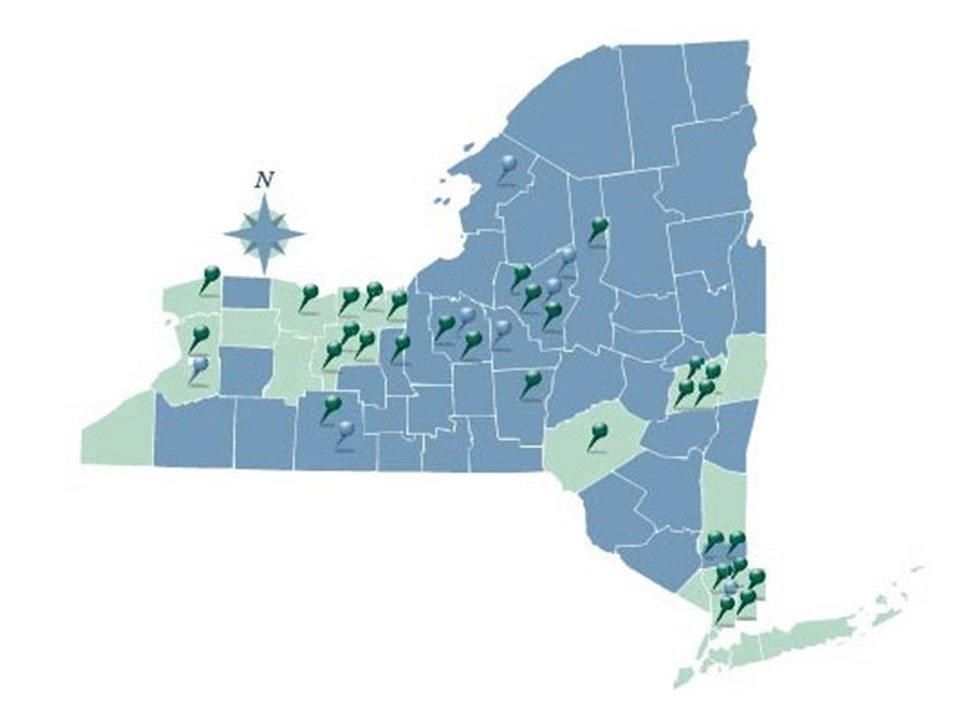
The New York State SDG IMO coverage area. Full County services are rendered in blue.  Individual City or Town services are denoted by pushpins.

Brief History

In the New York State Real Property System ( RPS V3) 1990’s era, NYS challenged SDG by noting it was technologically impossible to display photos during a live RPS V3 session.   SDG knew otherwise from similar projects performed for their parent company (Lanier Business Systems). Code being used to add imaging support to hospital applications was leveraged to build an initial application saving the Towns of Whitestown and New Hartford over $50,000 of previously ear-marked monies for Tyler-CLT Landisc street level imaging projects.

As SDG systems engineers and developers grew more familiar with assessment administration, opportunities arose to assist assessors with the development of line of business valuation software utilities including the Assessment Sales Analysis Program (ASAP)  search engine. A combination of these software tools contributed to the successful NYS Office of Real Property Tax Services (ORPTS)  RPSV4  launch.

RPSV4 was originally developed as a client server – “thick” desktop application. However, within a few short years, the internet and web application (browser) paradigm entered the software mainstream. The web quickly became a natural conduit to share real property information with the public and between Government departments and agencies. The next “organic” step forward for SDG was the development of a web portal for real property and assessment information – Image Mate Online (IMO).

IMO quickly gained popularity with NYS Counties and local municipalities throughout the early 2000’s. The State Real Property Tax Administration Technology Improvement Grant Program (RPTATIP) Grant program in 2006 and 2007 helped open the door for many additional County Real Property and Assessment Departments to deploy IMO portals. A large percentage of RPTATIP grant projects included IMO due largely to:

    • Return on Investment (ROI) – The City of Yonkers experienced a 70% reduction in Assessment Office foot and telephone traffic within their first year of IMO operations.
    • Extensibility – Ease of building upon the IMO portal to create “one stop shops” for comprehensive parcel related information.
    • Tight bindings with New York State Real Property and Assessment rules and best practices.
    • Strategic  partnerships, projects and connectivity with “best in class” players including Pictometry, Apex, ESRI, Google, VHB, TerraGo and Sewall
    • Performance and scalability – The Onondaga   IMO site performs over 2 million parcel searches a year. At 20% the size, nearby Seneca County – over 80,000 searches annually.
    • Outpost extends IMO and live RPS data collection services to the field as a low-cost tablet mobile sister service.
    • Continue reading

Jonathan Levy: Cartography Remixed

Jonathan Levy is yet another geospatial enthusiast I have made contact with via the burgeoning GeoNYC Meetup group. It’s a small world indeed as Jonathan and I share some common interests including music, sports, and time spent in one of my most favorite spaces: Idaho. His path down the cartographic road might be considered a bit different than the conventionally trained geospatial professional.  However, what is coming out the other end today is a wide range of interesting cartographic products and services.  Enough for an interesting dialog and blog post – including some interesting personal stuff on the side.  Enjoy.

Jonathan Levy grew up in the Durham and Chapel Hill areas of North Carolina spending lots of time running around in the outdoors.  His dad was a huge fan of National Geographic exposing Jonathan to both the beauty and vastness of the publication’s cartographic products and at the same time taking him camping and trail hiking around  in the Appalachian Mountains.  In his teens, he completed an Outward Bound course which introduced him to orienteering and using maps for navigation and survival.

After graduation from high school, Jonathan attended Brandeis University majoring in Near Eastern and Judaic Studies with a minor in Environmental Studies focusing on conservation biology and environmental politics.  After finishing his undergraduate work he traveled to Grenada, West Indies, to teach environmental/social science to children with Dr. Dessima Williams.   Afterwards, he worked for Polaroid’s Corporate Environmental Department in Boston, MA for nine months before heading to Salmon, Idaho as part of the Student Conservation Association working with the U.S. Forest Service in the Frank Church Wilderness Noxious Weed Inventory program.  It was here he was introduced to Global Positioning System (GPS) data collection concepts and GIS software to make maps of field guides of rare plant species in the wilderness area.

Completing his internship work in Idaho in 2002, Jonathan was  given a grant towards graduate study at at Hunter College in New York City in the MA program specializing in Geographic Information Systems (GIS)  and Media during which time he was able to intern at the United Nations and the New York City Office of Emergency Management.  He received his Masters from Hunter College in 2005.

Getting Started

His first job out of Hunter College was with the NY State Legislative Task Force for Demographic Reapportionment which Jonathan notes “was very GIS heavy and really interesting”.  At this point he began picking up freelance work on the graphics side of things with TED.com, Maps.com and Not For Tourists – the latter of which was has continued to be a successful long term contract.

Along the way he has continued to expand his use of the ESRI software particularly with regard to the spatial/network analyst extensions as well as becoming proficient in QGIS and Carto. Because he extends his cartographic product beyond the what is available with GIS software, Jonathan uses Adobe Illustrator and Photoshop for graphics processing, texturing and post production. For 3D renderings he uses Cinema 4D, After Effects, and Sketchfab.

Sample Cartographic Products

Lower Manhattan Buildings:
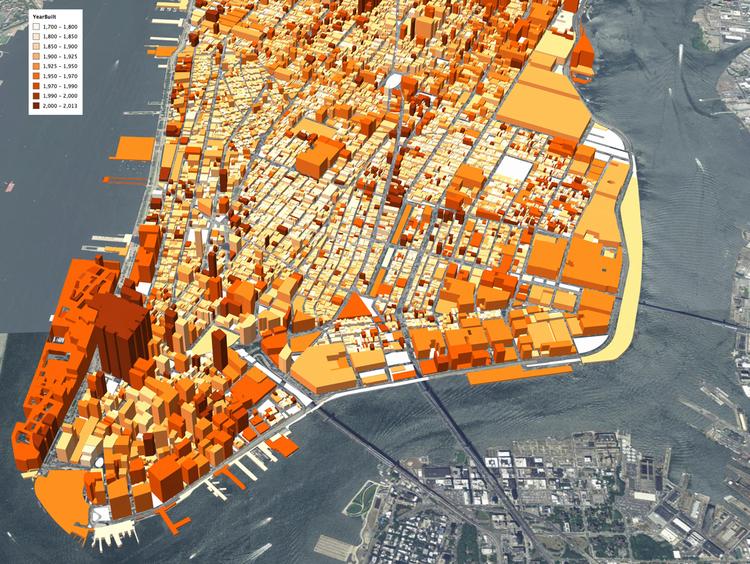
This 3D rendering of buildings in Lower Manhattan show the years in which they were built from 1700 to the present. The gradations of dark orange to light orange correspond to the newest to the oldest buildings. The data used to create this map came from NYC Open Data.

Environs Map Series:

This series is a way of sharing Jonathan’s life experiences of favorite places and spaces in his  life through map renderings and illustrations.  It is his personal experience of specific places and the personal “visions” of that space.  He gets requests to produce custom maps for friends, family and clients who want their town or neighborhood mapped in this style. He’s currently working on a Valentine’s day gift for a client who wants a map of Roncolo di Quattro Castella in this style.  These images are created using: Photoshop, Adobe Illustrator, scanned textures and GIS data.
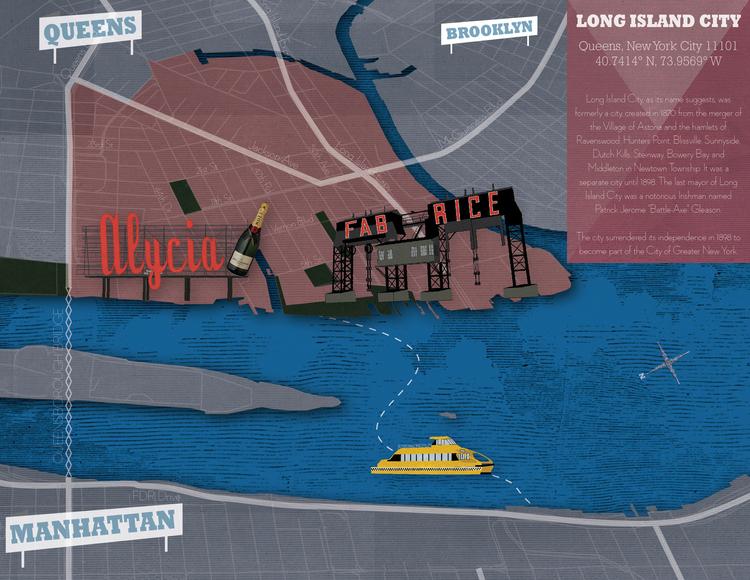
Jonathan notes: “I love seeing Long Island City from across the East River. The Pepsi and Long Island City signs are featured prominently although here I’ve replaced them with my sister and brother in law’s names in lieu of their recent marriage.”

Airbnb:

Jonathan notes this was a “fun” project. Using some fancy internal tools Airbnb developed, Jonathan helped map out neighborhood boundaries in 20+ cities across the U.S – including New York City.   It involved lots of research and involvement with city planners, residents and/or a combination thereof to get a feel for the individual city.
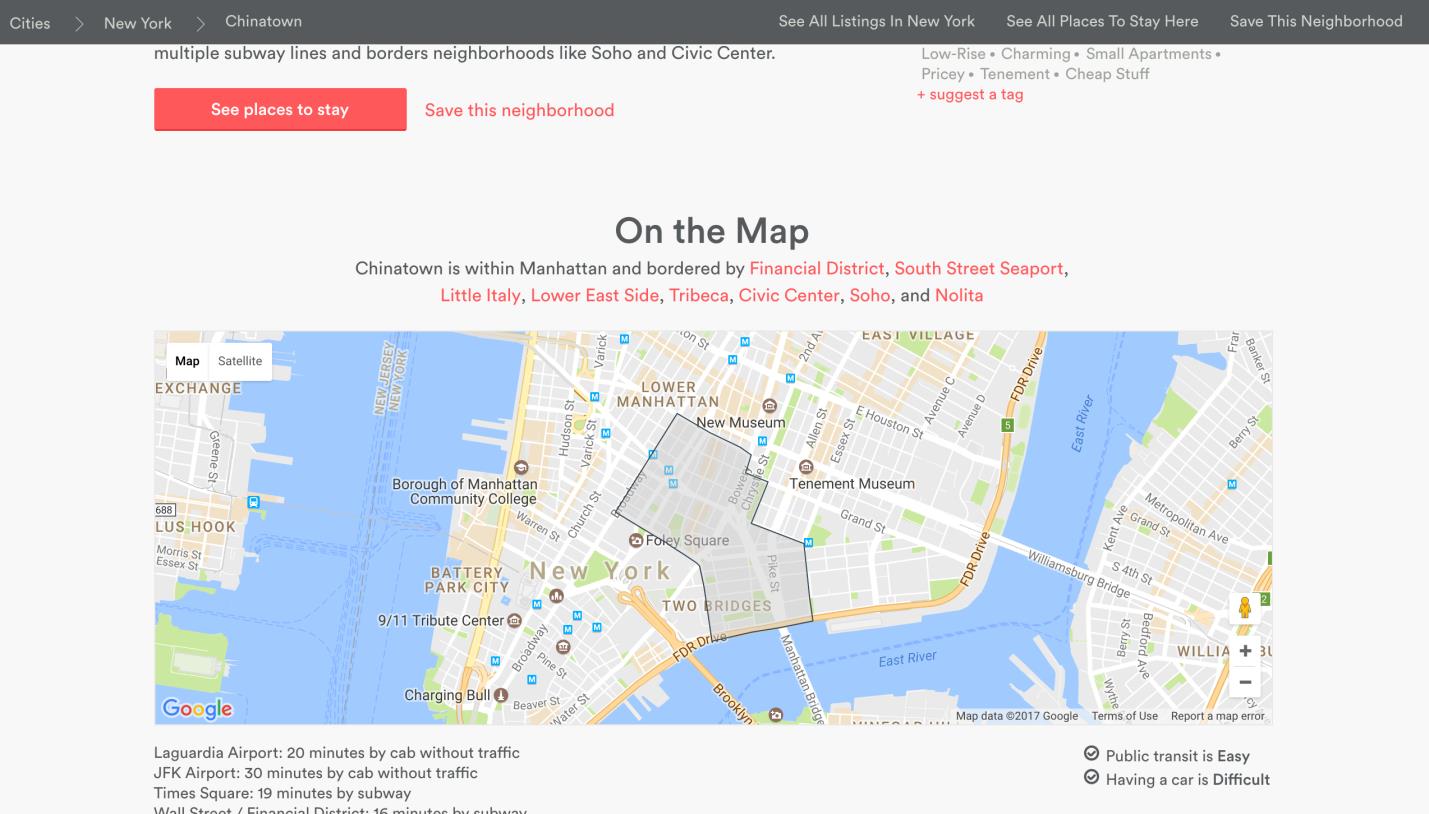
Sample of one NYC neighborhood maps – Chinatown – Jonathan researched and created for Airbnb helping users better define which areas and neighbors they are looking for lodging and accommodations.

Montauk 3D:

This was a personal project that was inspired by his time this past summer learning to surf in Montauk. He was struck by the interesting topography of the area. He took digital elevation model (DEM)  data, exaggerated the contours in Cinema 4D for effect, created custom topographic palettes and created a website that uses Sketchfab’s API to switch out textures on the 3D surface. Link to website: http://aws-website-montaukd-vr1zr.s3-website-us-east-1.amazonaws.com.  (Note:  Sketchfab recommends WebGL to display 3D content in real-time  which is a standard in most modern browsers.  Check your browser for compatibility at http://get.webgl.org/).
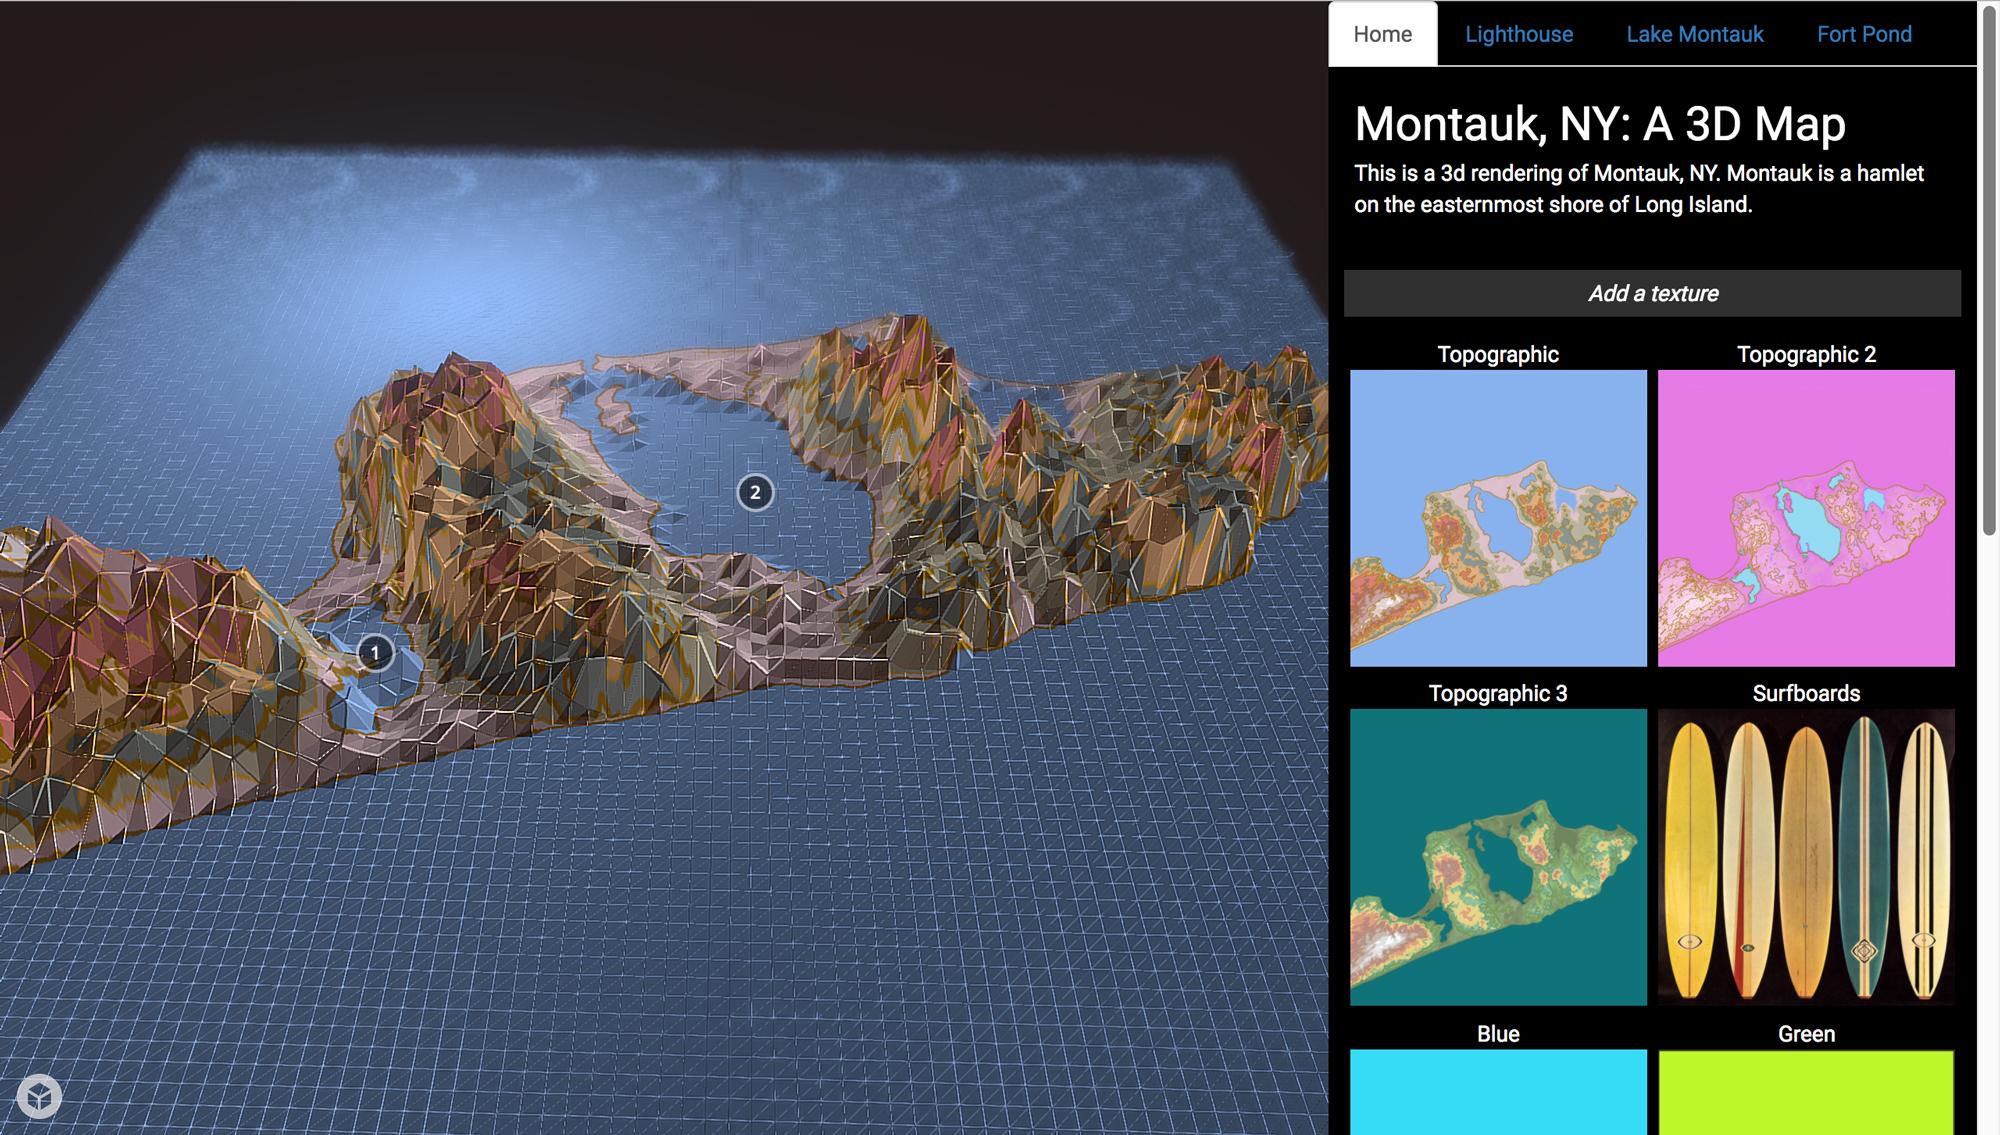
Amped Topography of Montauk: If you know the Montauk landscape and locations of specific geographic features (i.e., Lake Montauk and the Lighthouse – chances are you would find these renderings of the area very interesting – and different.

Loud Noise/Noise Complaints:

Jonathan also enjoys scrapping data from public web sites to develop maps and visuals.  While living on the Lower East Side of Manhattan, Jonathan created a Party/Loud Music Complaints map based on 311 data obtained from New York City’s Open Data Portal. These maps include and reflect his interest in rendering the “personality” of geospatial data through design choices – as illustrated in this map/web map – including a dark background, a purplish nighttime color palate and star animated Gifs.  Indeed an interesting map from a person who loves loud music and spends his spare time playing in a metal band!
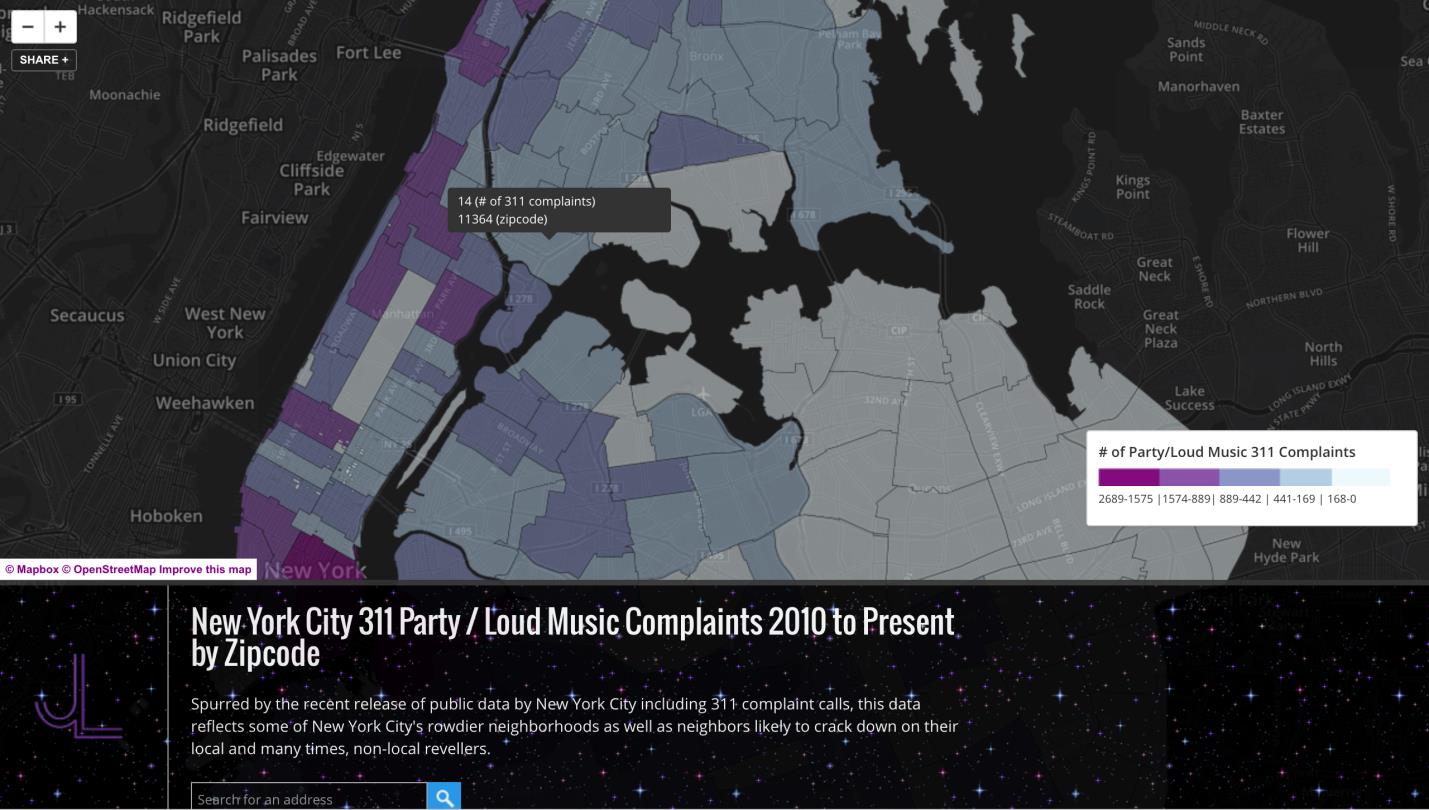
Built with OpenStreetMap, this interactive map allows users to pan around Manhattan to see which NYC zip code has the largest number of noise complaints as filed through 311.

The Other Stuff

Jonathan always finds his legal mapping client work interesting as it requires mapping and data development to such a fine level of detail.  Often such work involves boundary disputes requiring the review of historical deeds and historic photogrammetry to determine boundary line changes. Looking forward he continues working with Sketchfab in context of mapping in the 3D space.  He supports Sketchfab because it is “accessible, light and has a community for sharing 3D models with annotation”.

As a one person shop, Jonathan does not have a large marketing and public relations budget and as such all of  his business development is  word-of-mouth.  He’s recently created an interactive presentation for a close friend and chef/owner Will Horowitz (Duck’s Eatery / Harry & Ida’s) which he presented at the Food on the Edge conference in Ireland. He’s working on an online platform, Common Scraps, which addresses the issue food waste.   As an extension he has produced some animated maps that show how food scraps can be saved and reused in an exchange system between local farms/suppliers and restaurants.

Jonathan covers a lot of ground and styles in his work which is more detailed and described on his website. Take a look, and if you are really lucky you might find him playing at a local club down the street with his band Autowreck.  Go check them out.

Though take some ear plugs and hold on.

Contact:  Jonathan Levy @ jl@jlcartography.com


Finger Lakes Trail Conference: The Reach of Digital Mapping

As a hiker myself, I first visited the Finger Lakes Trail Conference (FLTC) website in search of information about the trail system with little knowledge of the incredible structure the organization has in place for creating and publishing hardcopy and digital maps. Thus, the genesis of this article and an overview of how FLTC makes all of the digital content come together.

Background

Established in 1962, the Finger Lakes Trail Conference (FLTC) mission is to “… to build, protect, enhance, and promote a continuous footpath across New York State. Forever!”  With administrative offices near the Mt. Morris Dam Visitor Center in Mt. Morris, New York, FLTC is a 501(c)3 non-profit organization which works in cooperation with its members and various organizations to develop and maintain the premier hiking trail system in New York.   The Finger Lakes Trail System includes the main Finger Lakes Trail (FLT) from the Pennsylvania-New York border in Allegany State Park to the Long Path in the Catskill Forest Preserve. The main FLT is 580 miles long. There are six branch trails and 29 loop trails and spur trails that extend from the main FLT. These branch, loop and spur trails currently total 412 miles. Including the Main Trail and all branch, loop, and side trails, the Finger Lakes Trail System offers 1,000 miles of hiking.    Today, more than 1,400 individual and family memberships currently support the FLTC  of which approximately one fourth actively volunteer to operate the organization and its programs.  The sale of maps and GPS track data help  build and maintain the trail system.

FLTC also recognizes Sponsors which are individuals or organizations which formally accept responsibility for maintaining a length of trail in the FLT System and Affiliates which are hiking clubs and Scout troops that operate their own local hiking program and sponsor (maintain) their section of the trail system. The FLTC is a Partner of the North Country Trail Association (NCTA) and cooperates with that organization and the National Park Service in maintaining and promoting that portion of the FLT that carries the North Country National Scenic Trail.  The FLTC is also a member of the Great Eastern Trail Association (GETA) and is constructing a branch trail of the FLT system (the Crystal Hills Trail) that will carry the New York portion of the Great Eastern Trail.

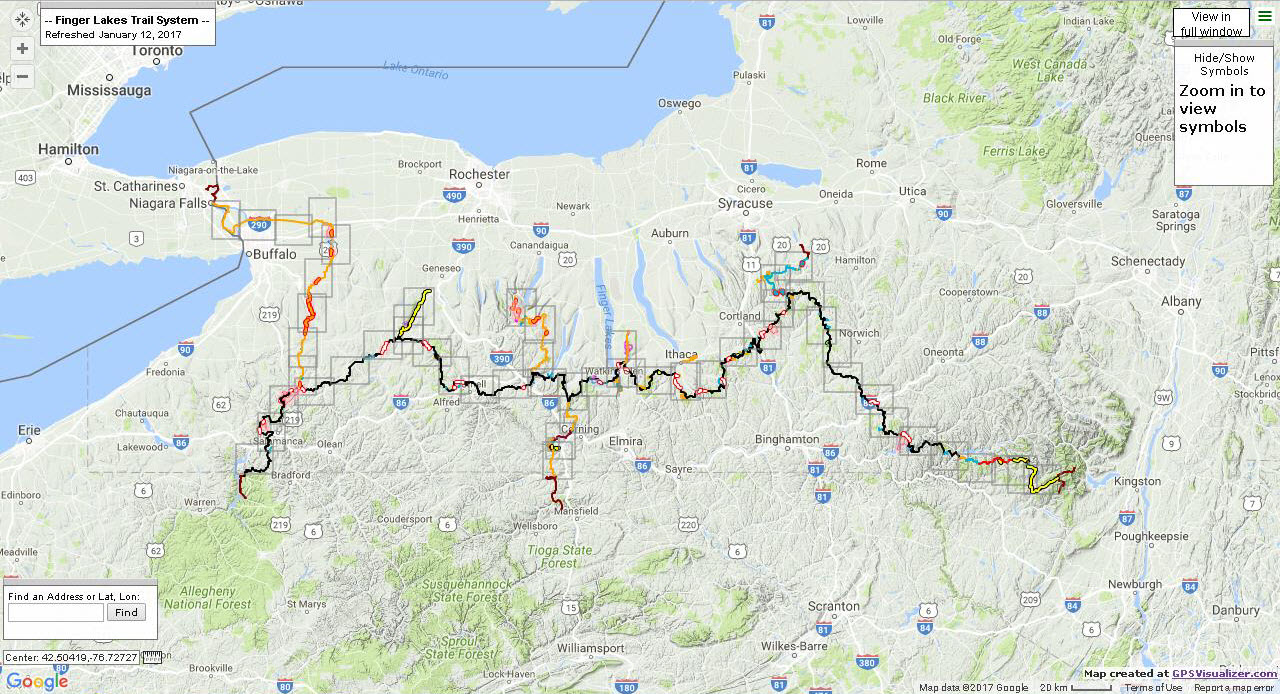
The Finger Lakes Trail System main trail from its eastern terminus in the Catskills to Allegany State Park in western New York State. From their interactive web application this image also show outlines of section maps which provide detail at larger scales.

Mapping and Cartography

Since the early 2000s with advancements in GPS technology and digital data collection, trail mapping responsibilities within the FLTC have been increasingly assigned to the Trail System Management program within the organization.   Within this structure, the mapping of new and/or changes to trails fall on the responsibilities of volunteers trained in use of  GPS devices – either their own Garmin device or an FLTC-owned Garmin Montana.  FLTC maintains  detailed specifications on what GPS devices are acceptable and how they are to be configured.  The GPX file from the walk is emailed to the mapping team which is currently under the direction of Greg Farnham and Jo Taylor).    Following a very detailed process document, the mapping team uses Garmin Basecamp to edit the official, unfiltered GPX track, which is referred to as the “trail centerline”.    There is adequate iteration with the person who walked the trail and the  Regional Trail Coordinator (RTC) overseeing that section of the trail where the data is being collected to ensure an accurate rendition of the (trail) data has been collected.  Regional Trail Coordinators and other FLTC administrative positions are highlighted on the organizational chart on their website. Continue reading

2017 GeoCon Wish List: Part 1

I first wanted to publish this article initially as a wish list to the GIS Santa Claus in early December, but the holidays came and went so I am now submitting it as a New Year’s wish list (Part 1) for the 2017 GeoCon  in Lake Placid.  There will  be other suggestions over the next several months and I’ll remain cognizant  what I wish for as I may be submitting an abstract to present myself.  Maybe.

So to start the discussion, here is an initial list of  ten geospatial mapping applications and program areas I’d like to send a speaker invite to for the 2017 GeoCon – and why.

NYS Office of the Attorney General:  New York Crime Gun Analysis https://targettrafficking.ag.ny.gov/tool/

While mapping continues to be one of the primary end products of GIS analysis, geospatial data is increasingly being used in a wide range of data visualization platforms such as Tableau.    I’d welcome the opportunity to attend a presentation by the Office of the Attorney on the Crime Gun Analysis report outlining data collection, data analysis, and the rendering of the data through maps, tables, and charts.  Not the normal GIS menu.

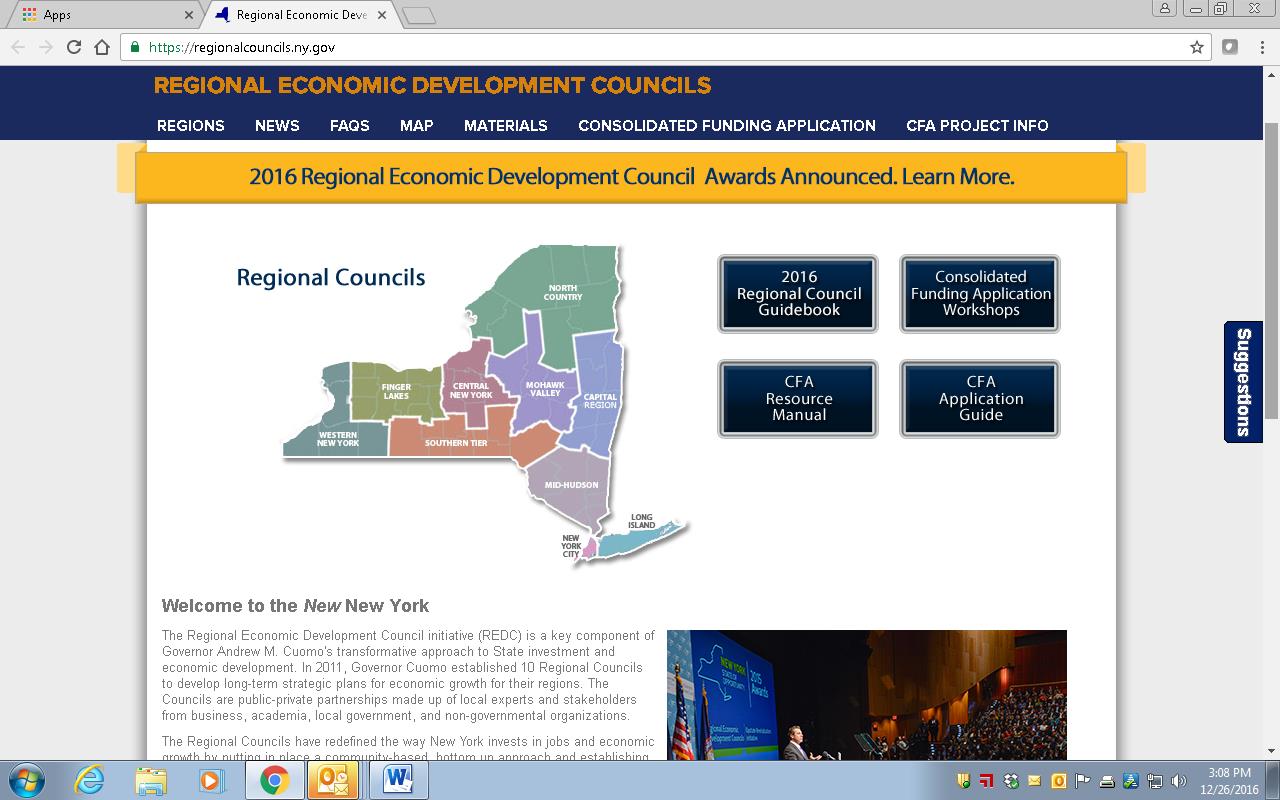
New York State Regional Economic Development Councils (REDC) http://regionalcouncils.ny.gov/

In context of geospatial, this program reference isn’t so much about “what it is”, as opposed to more about “what it isn’t”.  Or at least I think.  From my level, the REDC framework has always been somewhat of a mystery since current state administration created the 10 Regional Councils in 2011.  And even more confusing that the geography of the REDCs do not coincide with the statewide Regional Planning Commission boundaries. That said, there is an incredible amount of geospatial information and analysis in the Council’s underlying mission.  Everything happens somewhere.  And there is a ton of money coming through the Consolidated Funding Application (CFA) process which I believe the GIS community should be more engaged and recipients of to some degree. Uber opportunities for web mapping applications, Story Maps, and GIS-produced maps for publications though one would be hard pressed to see any real evidence of a professional GIS touch in any of the Council products and services.   I looked through four regional 2016 “progress” reports (Hudson Valley, Finger Lakes, Capital Region and Southern Tier and found very limited reference to GIS/geospatial technologies.   Some kind of presentation by one of the REDCs and/or regional GIS personnel involved in this program would be most informative for the statewide GIS community.  Otherwise I doubt we’re going to hear anything through the state GIS program office on this.

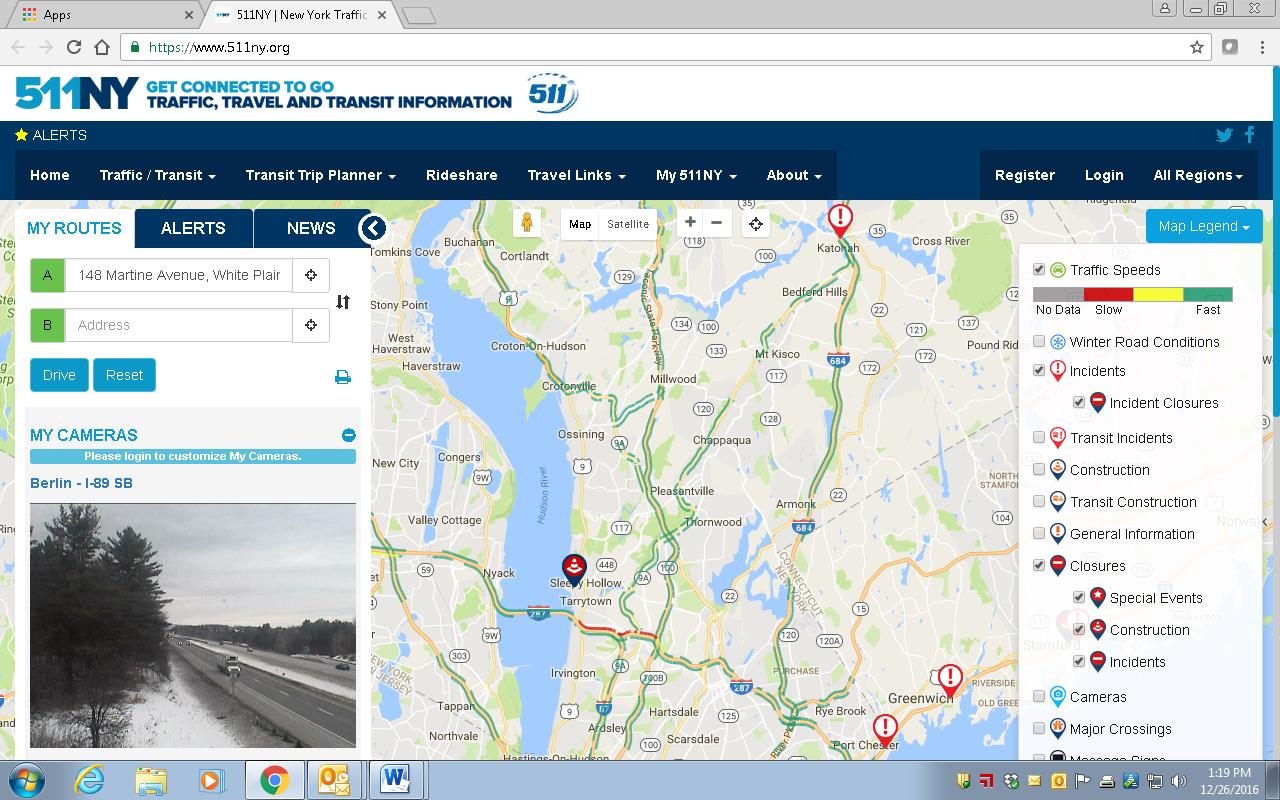
511NY
https://www.511ny.org/

This is more of a selfish request than anything because I really don’t fully understand the makings and how 511NY operates in context of GIS/geospatial data collection, sources, work flows, or even development of their applications including the online mapping stuff.  I do know it’s big, visible, seemingly growing in functionality, supported by a mess of New York State transportation agencies -even though it has its own .org web address.  It also creates a lot of data which would be useful to consume and use in local government web mapping applications.   I’d be the first one to sign up to hear how it all comes together, funding, sources of the data (including what is being taken from and/or generated at the local level), opportunities for collaboration with local GIS programs, and what’s next.  How long before we see an Uber icon on the 511NY homepage to help support trip planning?

Continue reading

Deep GIS: Mapping What You Touch In the Subways

I’ve recently been communicating with Ebrahim Afshinnekoo who is Project Director for the PathoMap project based at the Weill Cornell Medicine Mason Laboratory in New York City.  Launched in the summer 2013, PathoMap was the first project of its kind, with the intent to comprehensively map and investigate the presence of bacteria and DNA on the surfaces of large urban, metropolitan environments such as New York City. And of course what better venue to collect bacteria samples in NYC than the subway system – the large subterranean behemoth home to 5.5 million riders on an average weekday.

I was drawn to the project in that it involves several common geospatial components the traditional GIS community is routinely involved with such as  data collection/data validation, data analysis, mobile apps, web mapping and visualization. To date, discussion on this geospatial research effort has focused mainly within the Cell Systems (scholarly journal) community, though with little exposure within the traditional NYS GIS community. While both the Wall Street Journal and the New York Times published articles on PathoMap in 2015 we’ve seen little work of this nature at statewide conferences or how it can promote similar geospatial analysis across the Empire State. With this in mind, eSpatiallyNewYork initiated this blog entry with the purpose of exposing the PathoMap project, and its subsequent global expansion (MetaSUB) to the larger statewide GIS community.

Data Collection

The molecular profiling initiative launched in the summer of 2013 with the help of undergraduates from Cornell University and Macaulay Honors College – which were soon to be given the appropriate moniker “Swab Squad”.  To create a city-wide profile, the research team first built an Android/iOS  mobile application in collaboration with GIS Cloud to enable real-time entry and loading of sample metadata directly into a database (Figure 1).

Figure 1: Data collection from the project included the “swabbing” of sites and subsequent analysis and data entry of the findings into a mobile app which are dynamically uploaded to the Cloud GIS database. Source: Afshinnekoo et al., 2015

Continue reading

10 Questions: Dr. James Mower

Dr. James Mower is a familiar face across the New York State GIS landscape.  Having started at SUNY Albany almost thirty years ago, he has mentored hundreds of geography and GIS students whom have gone on to work in a wide range of government and industry positions across the state.  Over the past two decades, Westchester County GIS has employed at least six of his students as full-time employees and numerous summer interns.  His teachings have contributed significantly to the continued development of the Westchester County GIS program.

eSpatiallynewyork:  You’ve been at SUNY Albany for a while now – how long?

Mower: I started in the fall of 1987.

eSpatiallynewyork:  Take us back to your  doctoral work. Your PhD came from the University of Buffalo– one of the early most recognized centers of GIS research in the United States – in the late 1980s and early 1990s.  Who was your mentor at Buffalo?

Mower:  My mentor was David Mark who recently retired (from teaching, anyway). Dave was a great mentor—he let me run with some unusual but ultimately successful projects.

eSpatiallynewyork: What classes are you teaching these days? 

Mower:  I have focused more on programming courses recently. I have a 2-course Java programming sequence that has become a lot more interesting with the exploding interest in open source GIS. I’m retooling my courses to focus more on mapping libraries like the GeoTools package from OSGeo  (the program that also supervises GRASS, QGIS, GDAL, and other great tools). I also teach a Python course aimed at ArcGIS scripting (at least for now).

eSpatiallynewyork:  How has teaching GIS/geospatial at the university level changed over the last 5-10 years?

Mower:  The biggest changes are yet to come. Cartography and GIS are learning how to embrace mobile platforms with smaller screen space. Generalization issues in mapping have never been more important. Along with mobile mapping has also come global navigation satellite system position finding and its use in almost every cell phone app out there. Also, the coming revolution in autonomous vehicles will impact our field in many unforeseeable ways. Continue reading

10 Questions: Steve Romalewski

Steven Romalewski is currently director of the Mapping Service at the Center for Urban Research at The Graduate Center / CUNY.  During his 32-year career he has helped hundreds of nonprofit groups across the country leverage the power of GIS; helped develop more than two-dozen online mapping services analyzing environmental issues, social services, transit routing, demographic trends, voting behavior, and legislative representation.  He has also coordinated the work of community groups and others across New York to advocate for sensible environmental policies at the local, state, and federal levels.  For the past 10 years, he has taught students at Pratt Institute how to use GIS in their urban planning careers, and helped educate many others through presentations about the value of GIS.  He lives in Manhattan.

eSpatiallynewyork:  How did you end up in your current position at Center for Urban Research?  

Romalewski:  Before joining CUNY I ran the Community Mapping Assistance Project (CMAP) at NYPIRG for about eight years, providing mapping services to nonprofit organizations across the country.  (Before that I was an environmental researcher and advocate at NYPIRG.)  By 2004 or so, CMAP’s work had started to outgrow our advocacy-oriented parent organization. Internally we discussed options of spinning off CMAP as a social business venture, merging it with another organization, or launching it as its own nonprofit.

At the same time we were going through a strategic planning effort for the OASIS project, and one of the key findings was that OASIS would benefit from an institutional setting such as academia where the OASIS website would be able to leverage more stable technology resources and organizational support.

One of the academic programs we talked with was the Center for Urban Research (CUR) at the CUNY Graduate Center.  I had worked on projects over the years with CUR’s director John Mollenkopf, and he was a big fan of our work. It seemed like a great fit, and in January 2006  I moved to CUNY.

eSpatiallynewyork:  How do CUR projects come to be or developed?

Romalewski:  We’re fortunate to have a good amount of leeway in deciding on projects.  Generally CUR engages in applied research projects in the areas of neighborhood change, immigration, and urban development broadly speaking. Within those areas, we look for mapping projects where we can have an impact, where we can leverage CUR’s mapping skills and expertise in analyzing urban trends, and that come with funding support so we can cover staff time and related expenses.

We’re especially interested in working with our colleagues throughout CUNY, as well as within city government (since CUNY has a close relationship with New York City agencies), but we also take on projects with a wide array of partners.

If the project involves an online mapping component we try to structure it so we can incorporate the latest and greatest interactive web and mapping techniques and technologies. Continue reading