Retail Trade Geospatial Mapping and Analysis

There is no secret of the increasing use of GIS technology in the real estate industry due to the latter’s overwhelming interest and dependency on LOCATION.  For real estate professionals, location is always one of the determining factors influencing property value.  Geospatial technology provides the foundation for many common real estate tasks including  property research, market analysis, spatial analysis, matching tenants to available properties, plan market expansion and contraction, as well as staying abreast of changing consumer tastes and local demographics.  The expanding availability of business and marketplace datasets, online property (records) and land information systems, and more friendly and accessible enterprise web-based  geospatial software tools enables real estate firms building geospatial capacity to act more quickly than their competitors.

One Empire State firm which has embraced and is currently expanding it’s GIS infrastructure is the The Shopping Center Group (SCG).  A more focused group within the company is called SCG Retail which is located in Manhattan and concentrates on retail real estate properties in urban environments not specific to shopping centers.  It is in this office where primary SCG GIS resources are located providing geospatial support and guidance to other SCG offices in the United States.   Established in 1984, SCG is a retail-only real estate company providing advisory services to tenants, landlords, developers, investors and financial institutions.  With 22 offices from New York to Southern California, it is the largest commercial/retail-only real estate firm in the United States.

Sample SCG-Retail map of “targeted” neighborhoods in southern Westchester and Fairfield (CT) Counties. SCG-Retail uses ESRI’s Business Analyst to estimate the number of total employees who work within a defined area to generate a general idea of daytime population/employment hubs.  Rent ranges (Est. rent per square foot of retail space) is provided by brokers and business partners.

The SCG-Retail GIS operations are built on top of the ESRI GIS platform to conduct their industry leading mapping and demographic studies.  Connected offices utilize ArcGIS Server services, ArcGIS Online, and selected ArcGIS client programs.  In the Metro NYC region, SCG GIS staff utilize a variety of datasets as part of their market and site specific analysis including ESRI’s Business Analyst and Tapestry Segmentation products and in the a variety of public (Metropolitan Transportation Authority [train, bus, subway ridership], New York City [property/parcels, permits, bus ridership, etc]) and other commercially available real estate and consumer databases. Directing the SCG Retail geospatial efforts its New York City office is Will Parra who joined SCG Retail after working with Sanborn Mapping Company in Pelham, New York.

“SCG Retail’s use of GIS has grown significantly over the past 24-26 months” notes Parra, “it is used and integrated into all of our business decisions”.  Illustrative of SCG-Retail’s work is their recent 125th Street Corridor retail analysis in Harlem, New York – with the world famous Apollo Theater near the center of the study area.   To assess current and anticipated demographic changes in this area of Manhattan and how these trends will effect the potential retail trade landscape,  SCG-Retail GIS staff employed a variety of databases and mapping/analysis tools which enables staff to utilize custom designed GIS tools to establish potential consumer movement patterns in the study area during daytime and evening hours.  The resultant findings of their analysis, as highlighted in this StoryMap, identifies the 125th corridor, particularly the western end, as an excellent area for commercial retail growth and development.

Chase Welles, Partner, SCG Retail comments “Within the last 24-36 months, GIS technology has become an essential tool in working with clients and defining potential retail trade areas.  SCG Retail always had access to U.S. Census and demographic data, estimated consumer trade and drive-time zones, the ability to place potential consumers in defined locations at specific times of the day (AM/PM) via mobile device (smart phone) generated X,Ys  has been a game changer for us working in this space.  This mash-up of new consumer locational data with traditional Census, consumer spending patterns, and other GIS overlays is a very new, powerful, and emerging market analysis tool.”

When representing clients, a basic SCG-Retail map product is a radius map (typically .5 mile radius around a specific address) which provides a basic understanding of the demographics in a given designated trade area. Data is generated using ESRI Business Analyst Online.

Using data collected by mobile devices, The Shopping Center Group developed this map in ArcGIS Desktop to highlight the differences between where people who frequent Colonie Center in Albany, New York, live and where they work. This information is then used within Esri Business Analyst Online to uncover the slight variations in both the demographics and the psychographics of Colonie Center guests.

Learn More About SCG

SCG Retail GIS work has been featured in a February 2017 ArcNews article as well as in an ESRI Case Study YouTube video.  In 2016, The Shopping Center Group was also recognized at the annual ESRI User Group Conference with a Special Achievement In GIS (SAG) award.  Additional information and background on consumer research and analysis in the shopping center industry, visit the International Council of Shopping Centers (ICSC) website.

Contact Will Parra, SCG Retail, at wparra@scg-retail.com.

2017 GeoCon Wish List: Part II

In January of this year, I published my first 2017 GeoCon wish list relative to geospatial mapping applications and topics I’d like to see as part of the Lake Placid October 17-19 conference.  Since January, writing and publishing eSpatiallyNewYork has enabled me to communicate with a wide range of individuals and organizations involved in geospatial programs across the state  – some of which are included in the list below.  Others itemized on the list are new business start-ups,  government and nonprofit initiatives, and programs involved in the emerging drone technology.

So without any further adieu, here is Part II itemizing geospatial topics and program areas I’m advocating for 2017 GeoCon in Lake Placid.  Speakers, presentations, and ideas to mix things up and start some new discussion – and why.

Opioid Crisis Mapping

With the opioid crisis well documented in New York State, Story Mapping and data visualization help further detail the magnitude of this public health issue to a much wider audience.  Story Maps also enable authors with much greater flexibility in developing a narrative to accompany the data which might be otherwise be difficult to interpret or understand with just a map by itself.  Here in New York, it’s the hope to see greater use of Story Mapping (not just ESRI’s solution – all platforms) by agencies and organizations which historically have been reluctant to publish maps due to concerns of data which might be sensitive or misinterpreted.  This Opioid Story Map provides a powerful message and can prove to be a catalyst in seeing other statewide public health data being published in a similar geographic format.  It would be interesting to hear more from this Story Map author(s) about the datasets used (availability, sensitive/non-sensitive, sources, etc.) and possible collaboration with other GIS programs and agencies at the federal, state, and local level.  See also the Northern Kentucky Story Map:  The GEOStory of Opioid Addiction and The Urban Observatory: The Opioid Epidemic.

Story Maps provide an easy and powerful framework to combine narrative and maps which is often very helpful when publishing sensitive or “difficult” to interpret data. Publishing agencies have can better help how data is interpreted and read.

New York State Wildland Fire Mapping

Nothing special or cutting edge here geospatial, but I’ve always had a soft spot for wildland fire maps having served on U.S. Forest Service interregional fire crews back in the day in both Idaho and Montana.   Though in context of publishing fire data, it’s unfortunate how little capacity New York State Department of Environmental Conservation (DEC) has built in context of publishing their data and products as services. Not that statewide wildland fire data and map services would be a top seller for DEC, but the image below (scrapped from the DEC website) speaks to the continued reliance on static maps and other enterprise map applications  which cannot be consumed by other viewers.  The map is actually interesting in showing how there are more fires per square mile closer to urban areas (red) than in the more forested areas such as the Adirondacks – where most would think wildland fires occur and with more frequency.   Publishing this type of data as some type of map service would Continue reading

GPS Telematics for Fleet and Mobile Workforce Management

Several of my posts over past 18 months have focused on a core set of applications which I have seen evolve over the past three decades that serve as the cornerstones for many New York State local and county government geospatial programs.  Increasingly and central to many of these geospatial program areas is the “mobile” component albeit much of the attention to date has been on “field/handheld” hardware and software components for both spatial data collection and updates.

Increasingly  it is becoming recognized  another mobile collection technology can add value to  an organization’s work force and business systems productivity.  Originally referred to as Automated Vehicle Locator (AVL) systems, this technology got its start decades ago focusing on the capture (mapping) of a vehicle’s location and display in a GIS or similar digital mapping system. These early systems were expensive and not widely used outside of business and industry.

Over the last five or more years,  fleet managers have increasingly adopted “AVL” technology to assist in the management of  fleet assets especially with availability of lower cost hardware components which connect  to vehicle On Board Diagnostic (OBD) ports.  This capability supports fleet managers with a wide range of metrics  providing  odometer/mileage readings, engine idling, vehicle usage and a variety of other vehicle related information.  Now recognized as “GPS Telematics”, this technology has become more affordable and accessible to a larger range of government agencies and organizations.  This modern use of the technology centers around the use of M2M (machine to machine) and telematics technologies.

Benefits of GPS Telematics

To date, much of the work focusing on capturing and analyzing data associated with field resources has been done the “old way”, i.e., capturing and recording the data by human fingers.  Historically, this method is fraught with inconsistencies. Machine-to-machine (M2M) data capture on average is far more accurate and consistent.

Fleet telematics monitor the location, movement, status and behavior of a vehicle and associated field resources.  This is achieved through a combination of the  GPS telematics device which is installed in each vehicle transmitting  location based data via wireless networks to web servers for near real time availability.  Users access location, movement and status information and metrics of vehicles via special web-based software applications or through existing in-house “vehicle tracking enabled”  business applications.  In essence, GPS telematics systems become platforms to collection and transport valuable mobile resource field information and activities.  In addition to locational data,  fleet telematics solutions provide the status of each vehicle and by extension the corresponding crew an inference of  ongoing work accomplishments and assignments to field resources.  Managers know how each vehicle is being used as well as mileage, idling status, location and speed.  Such systems can be extended to be connected to onboard systems and sensors which log activities such as street sweeping, plowing, spreading, and spraying – workflows which are particularly challenging to capture and document by hand during the normal course of business.  While Return-on-Investments (ROI) can and will vary greatly, calculating the benefits of investing in fleet telematics technology can now be  based on factual metrics such as improved routing and dispatching, reducing labor costs, improved fuel and vehicle usage, and newer more cost-effective system architecture (Cloud). Continue reading

Geospatial Business Spotlight: The CEDRA Corporation

Company Name:         The CEDRA Corportation

Location:                     1600 Mosley Road, Suite 500, Victor, NY  14564

Website:                      http://www.cedra.com

Employees:                 12

Established:               1985

The CEDRA Corporation offers GIS based software for mapping, civil engineering design and modeling, surveying and database maintenance applications. CEDRA’s AVseriesTM suite of software operates directly within Esri’s GIS software (ArcGIS® 9.x and 10.x), thus eliminating the need to switch back and forth between various software packages. CEDRA software is developed entirely in-house and marketed worldwide to public works agencies, tax assessors, utilities, municipalities and private sector companies.

Complementing CEDRA’s Software Development Division is CEDRA’s Professional Services Division which has performed consulting projects throughout the U.S. and specializes in developing, populating and maintaining GIS databases.   CEDRA’s Professional Services Division offers consulting services to clients for a multitude of applications including CEDRA-specific software solutions or can be totally non-CEDRA software related consulting projects. CEDRA staff is highly proficient in GIS Analysis, Data Capture, Data Conversion, Map Production, Routing and Custom Application Development in toth the desktop and server environments.  As an authorized Esri business partner and reseller, CEDRA has a long history in the use and application of Esri’s GIS suite of software dating back to 1987.

CEDRA’s corporate mission is to provide services and software that improves the efficiency and productiveness of its clients. This goal is achieved by (a) developing software that is production oriented and (b) offering services that enable clients to streamline workflows. CEDRA believes the more automated a workflow can be made, the more efficient a client will be and a higher quality product will be produced. CEDRA offers Expertise, Experience and Commitment when undertaking a project.

Illustrative CEDRA products and services include:

Wayne County E911, Lyons, New York

Under this project CEDRA assisted Wayne County staff in developing the County’s E911 street database. Specifically, the work involved acquiring the NYS Street Address Mapping (SAM) data, extracting the street data for Wayne County, and working with the County in verifying and updating the street center line database for use in the County’s E911 system.

In performing this work, CEDRA staff was on-site at the County’s office performing the work and training County staff in the process. A workflow was developed and adopted by the County. Additionally, a training guide was developed enabling County staff to maintain the street center line data with their own resources. Continue reading

Geospatial Business Spotlight: Systems Development Group (SDG)

Systems Development Group (SDG)  provides real property, imaging and GIS-centric software and professional services to government, education and private sector companies. The Company provides clients with the appropriate technologies to cost effectively improve tax payer services while reducing operational costs. Clients achieve operational efficiencies with SDG’s blend of expertise in assessment, imaging, GIS and software administration tools and professional services.  SDG currently collaborates with state, county and local government agencies.

Location:             44 Trenton Road, Utica, New York 13502.

Website:             www.sdgnys.com

Email:                   info@sdgnys.com

Phone:                 (315) 798-1328

Employees:        8

Established:       1991

Flagship Product: Image Mate Online (IMO) Real Property Web Portal

The New York State SDG IMO coverage area. Full County services are rendered in blue.  Individual City or Town services are denoted by pushpins.

Brief History

In the New York State Real Property System ( RPS V3) 1990’s era, NYS challenged SDG by noting it was technologically impossible to display photos during a live RPS V3 session.   SDG knew otherwise from similar projects performed for their parent company (Lanier Business Systems). Code being used to add imaging support to hospital applications was leveraged to build an initial application saving the Towns of Whitestown and New Hartford over $50,000 of previously ear-marked monies for Tyler-CLT Landisc street level imaging projects.

As SDG systems engineers and developers grew more familiar with assessment administration, opportunities arose to assist assessors with the development of line of business valuation software utilities including the Assessment Sales Analysis Program (ASAP)  search engine. A combination of these software tools contributed to the successful NYS Office of Real Property Tax Services (ORPTS)  RPSV4  launch.

RPSV4 was originally developed as a client server – “thick” desktop application. However, within a few short years, the internet and web application (browser) paradigm entered the software mainstream. The web quickly became a natural conduit to share real property information with the public and between Government departments and agencies. The next “organic” step forward for SDG was the development of a web portal for real property and assessment information – Image Mate Online (IMO).

IMO quickly gained popularity with NYS Counties and local municipalities throughout the early 2000’s. The State Real Property Tax Administration Technology Improvement Grant Program (RPTATIP) Grant program in 2006 and 2007 helped open the door for many additional County Real Property and Assessment Departments to deploy IMO portals. A large percentage of RPTATIP grant projects included IMO due largely to:

    • Return on Investment (ROI) – The City of Yonkers experienced a 70% reduction in Assessment Office foot and telephone traffic within their first year of IMO operations.
    • Extensibility – Ease of building upon the IMO portal to create “one stop shops” for comprehensive parcel related information.
    • Tight bindings with New York State Real Property and Assessment rules and best practices.
    • Strategic  partnerships, projects and connectivity with “best in class” players including Pictometry, Apex, ESRI, Google, VHB, TerraGo and Sewall
    • Performance and scalability – The Onondaga   IMO site performs over 2 million parcel searches a year. At 20% the size, nearby Seneca County – over 80,000 searches annually.
    • Outpost extends IMO and live RPS data collection services to the field as a low-cost tablet mobile sister service.
    • Continue reading

Geospatial Business Spotlight: Tyler Technologies

Company Name:  Tyler Technologies

Business Unit:    ERP & Schools Division, Transportation Solutions (formerly Versatrans)

Website:               www.tylertech.com

Established:        1966

THE COMPANY

Tyler Technologies, Inc., is a leading provider of end-to-end information management solutions and services for local governments. Tyler partners with clients to empower the public sector — cities, counties, schools and other government entities — to become more efficient, more accessible and more responsive to the needs of citizens. Its mission-critical applications provide the public sector with the ability to streamline and automate operations, resulting in improved productivity, reduced costs and continual process improvement. Tyler’s client base includes more than 14,000 local government offices in all 50 states, Canada, the Caribbean, the United Kingdom and other international locations. Forbes has named Tyler one of “America’s Best Small Companies” eight times, and the company has been included six times on the Barron’s 400 Index, a measure of the most promising companies in America. Tyler provides a broad line of software products in seven main solution areas: appraisal and tax; courts and justice; ERP financial; planning, regulatory and maintenance; public safety; records and documents; and K-12 schools. Tyler has over 400 customers in the State of New York. Customers include large counties such as Nassau, Suffolk and Westchester as well as municipalities such as City of Buffalo, Rochester and Yonkers.

Versatrans started as a transportation planning consulting firm in 1965 and began developing software in 1980. For more than 35 years, Versatrans has developed the leading technology for school professionals to deliver the best service to their districts. In 2008, Versatrans became part of Tyler Technologies, which today employs more than 3,600 professionals. Since that time, the Versatrans® product line has been maintained and supported, and the number of development resources assigned to the product line have nearly doubled. Tyler’s transportation solutions are the software of choice among more than 1,600 school districts and pupil transportation service providers in the United States and Canada. In the State of New York, Tyler transportation solutions are used in over 280 school districts including large school districts such as Buffalo Public Schools, Williamsville Central School District and North Syracuse Central School District, but also in small school districts such as Fort Plain Central School District, Candor Central School District and Broadalbin-Perth Central School District.

PRODUCTS AND SERVICES

Tyler’s transportation solutions are built to factor together district policies and student information with hazard restrictions and realistic bus speeds. This provides safe and accurate bus stop locations and optimal routes that save money. By geocoding with the latest GIS technology using county maps, and taking into account cross restrictions, hazard zones, predator locations and more, the software picks up students from their exact location and assigns them to the safest stop. The Tyler team is composed of industry transportation professionals such as former directors, trainers, routing experts and drivers which, combined with experienced software engineers, apply their expertise and latest technology to transportation solution products, implementation and support.

Tyler’s transportation solutions include Traversa®, the Versatrans suite and Tyler Drive™.

Traversa

Traversa is Tyler’s integrated, comprehensive transportation management system. Traditionally, transportation software has been offered piecemeal, with different interfaces, different data sources and different requirements for training and installation. Traversa offers a seamless user experience for:

  • Bus routing
  • Activity trips
  • Work order tracking
  • Fleet maintenance
  • Automated vehicle location (AVL)/GPS tracking

In addition to the areas mentioned above, Traversa’s core functionality includes entity management (students, vehicles, employees, etc.), messaging and alerts, planning and reporting. Traversa is a cloud-based service supported by Tyler experts and hosted in Tyler’s SSAE16-certified data center. Tyler’s GIS services department converts a client’s data and helps verify client maps. Tyler’s transportation team provides training and data security and – when needed – disaster recovery.


TylerTech1

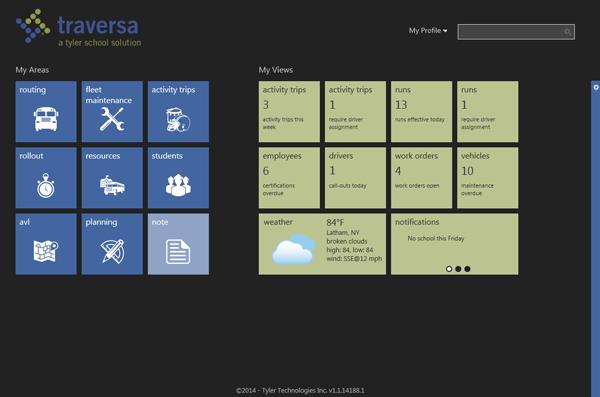
Traversa Dashboard allows school district transportation personnel to see a comprehensive view of everything they need for routing, planning and fleet maintenance.

Traversa’s technology stack incorporates portions of ESRI’s mapping software and can also interface with third-party data providers to show real-time traffic conditions, construction projects, city planning, evacuation routes, weather and more. A user can select a bus stop and zoom in to inspect the streetscape for possible safety issues. Traversa even helps a user respond to change. If a bridge washes out, he or she can quickly find an alternate path and print the new directions for drivers to use.

TylerTech2

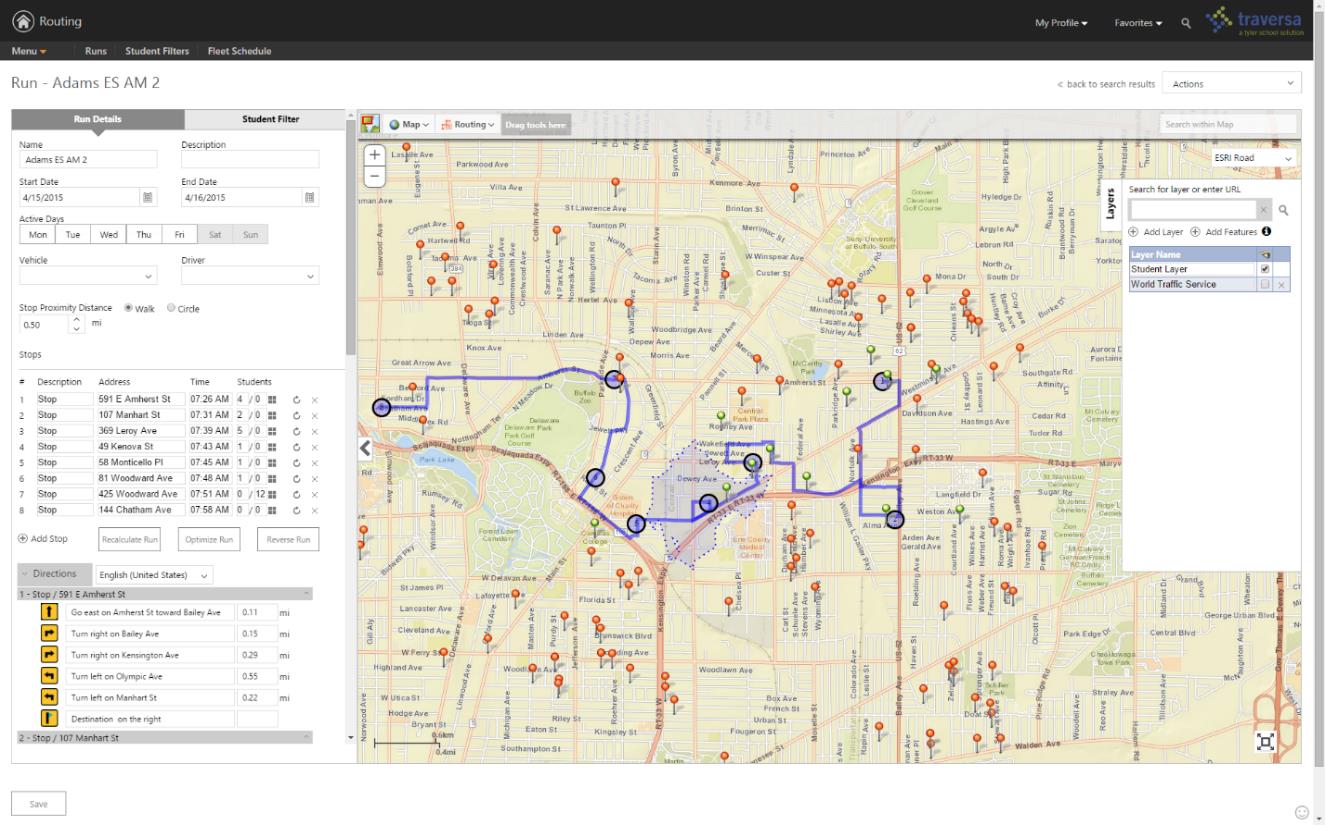
Traversa Routing allows a school transportation router to build daily runs, assign students to stops, generate driver directions, assign vehicles/drivers and more.

Traversa AVL brings all vehicles to one screen for the dispatcher to monitor them in real-time. Users can filter for a specific vehicle, date or time and follow the path of that vehicle. They can also assign geofences for alerts and much more.

TylerTech3

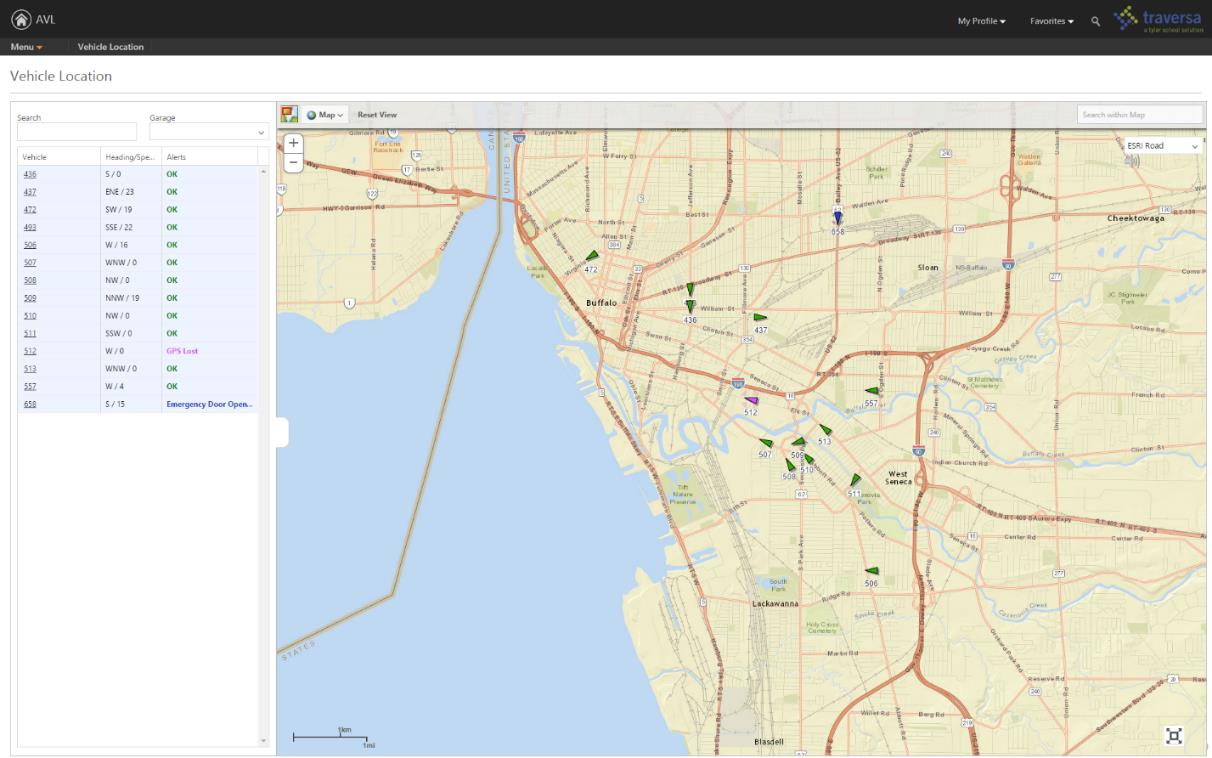
Traversa AVL allows users to view current and historical data related to the location, speed, and direction (N, E, S, W) of the entire fleet of GPS equipped vehicles.

To learn more about Traversa, follow this product overview video.

Tyler Drive

Tyler Drive is an innovative, mobile device designed for the school bus driver.  Mounted on the school bus console, Tyler Drive’s 4G service and cloud-based software closes the gaps in school bus transportation.  It stems the losses caused by outdated timekeeping software and substitute drivers navigating unfamiliar routes. Tyler Drive keeps school buses on course and generates the documentation for reporting and reimbursement.

Tyler6

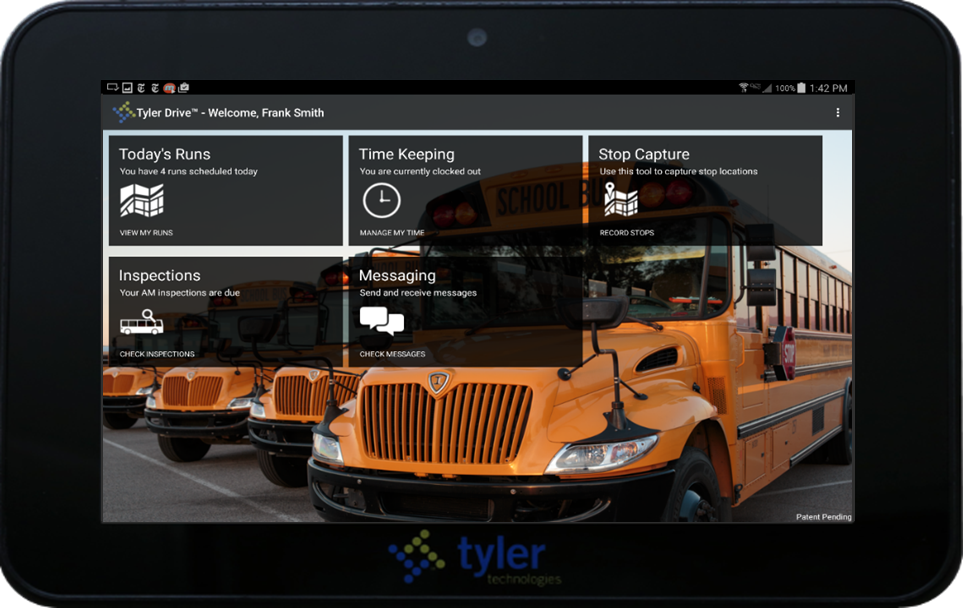
Tyler Drive Dashboard presents drivers with a comprehensive view of everything they need for their shift.

Through integration with Tyler’s student transportation routing and planning solutions, Tyler Drive is able to provide the most comprehensive and reliable route navigation available. Tyler Drive navigation map highlights the planned route with detailed directions to the next stop. If a road is closed, Tyler Drive can redirect the bus to the planned stop. Driver is presented with turn-by-turn directions and a list of students to pick up or drop off as the bus approaches a stop. If the school bus goes off the planned route Tyler Drive re-routes through the shortest path to the next stop in sequence.

TylerTech5

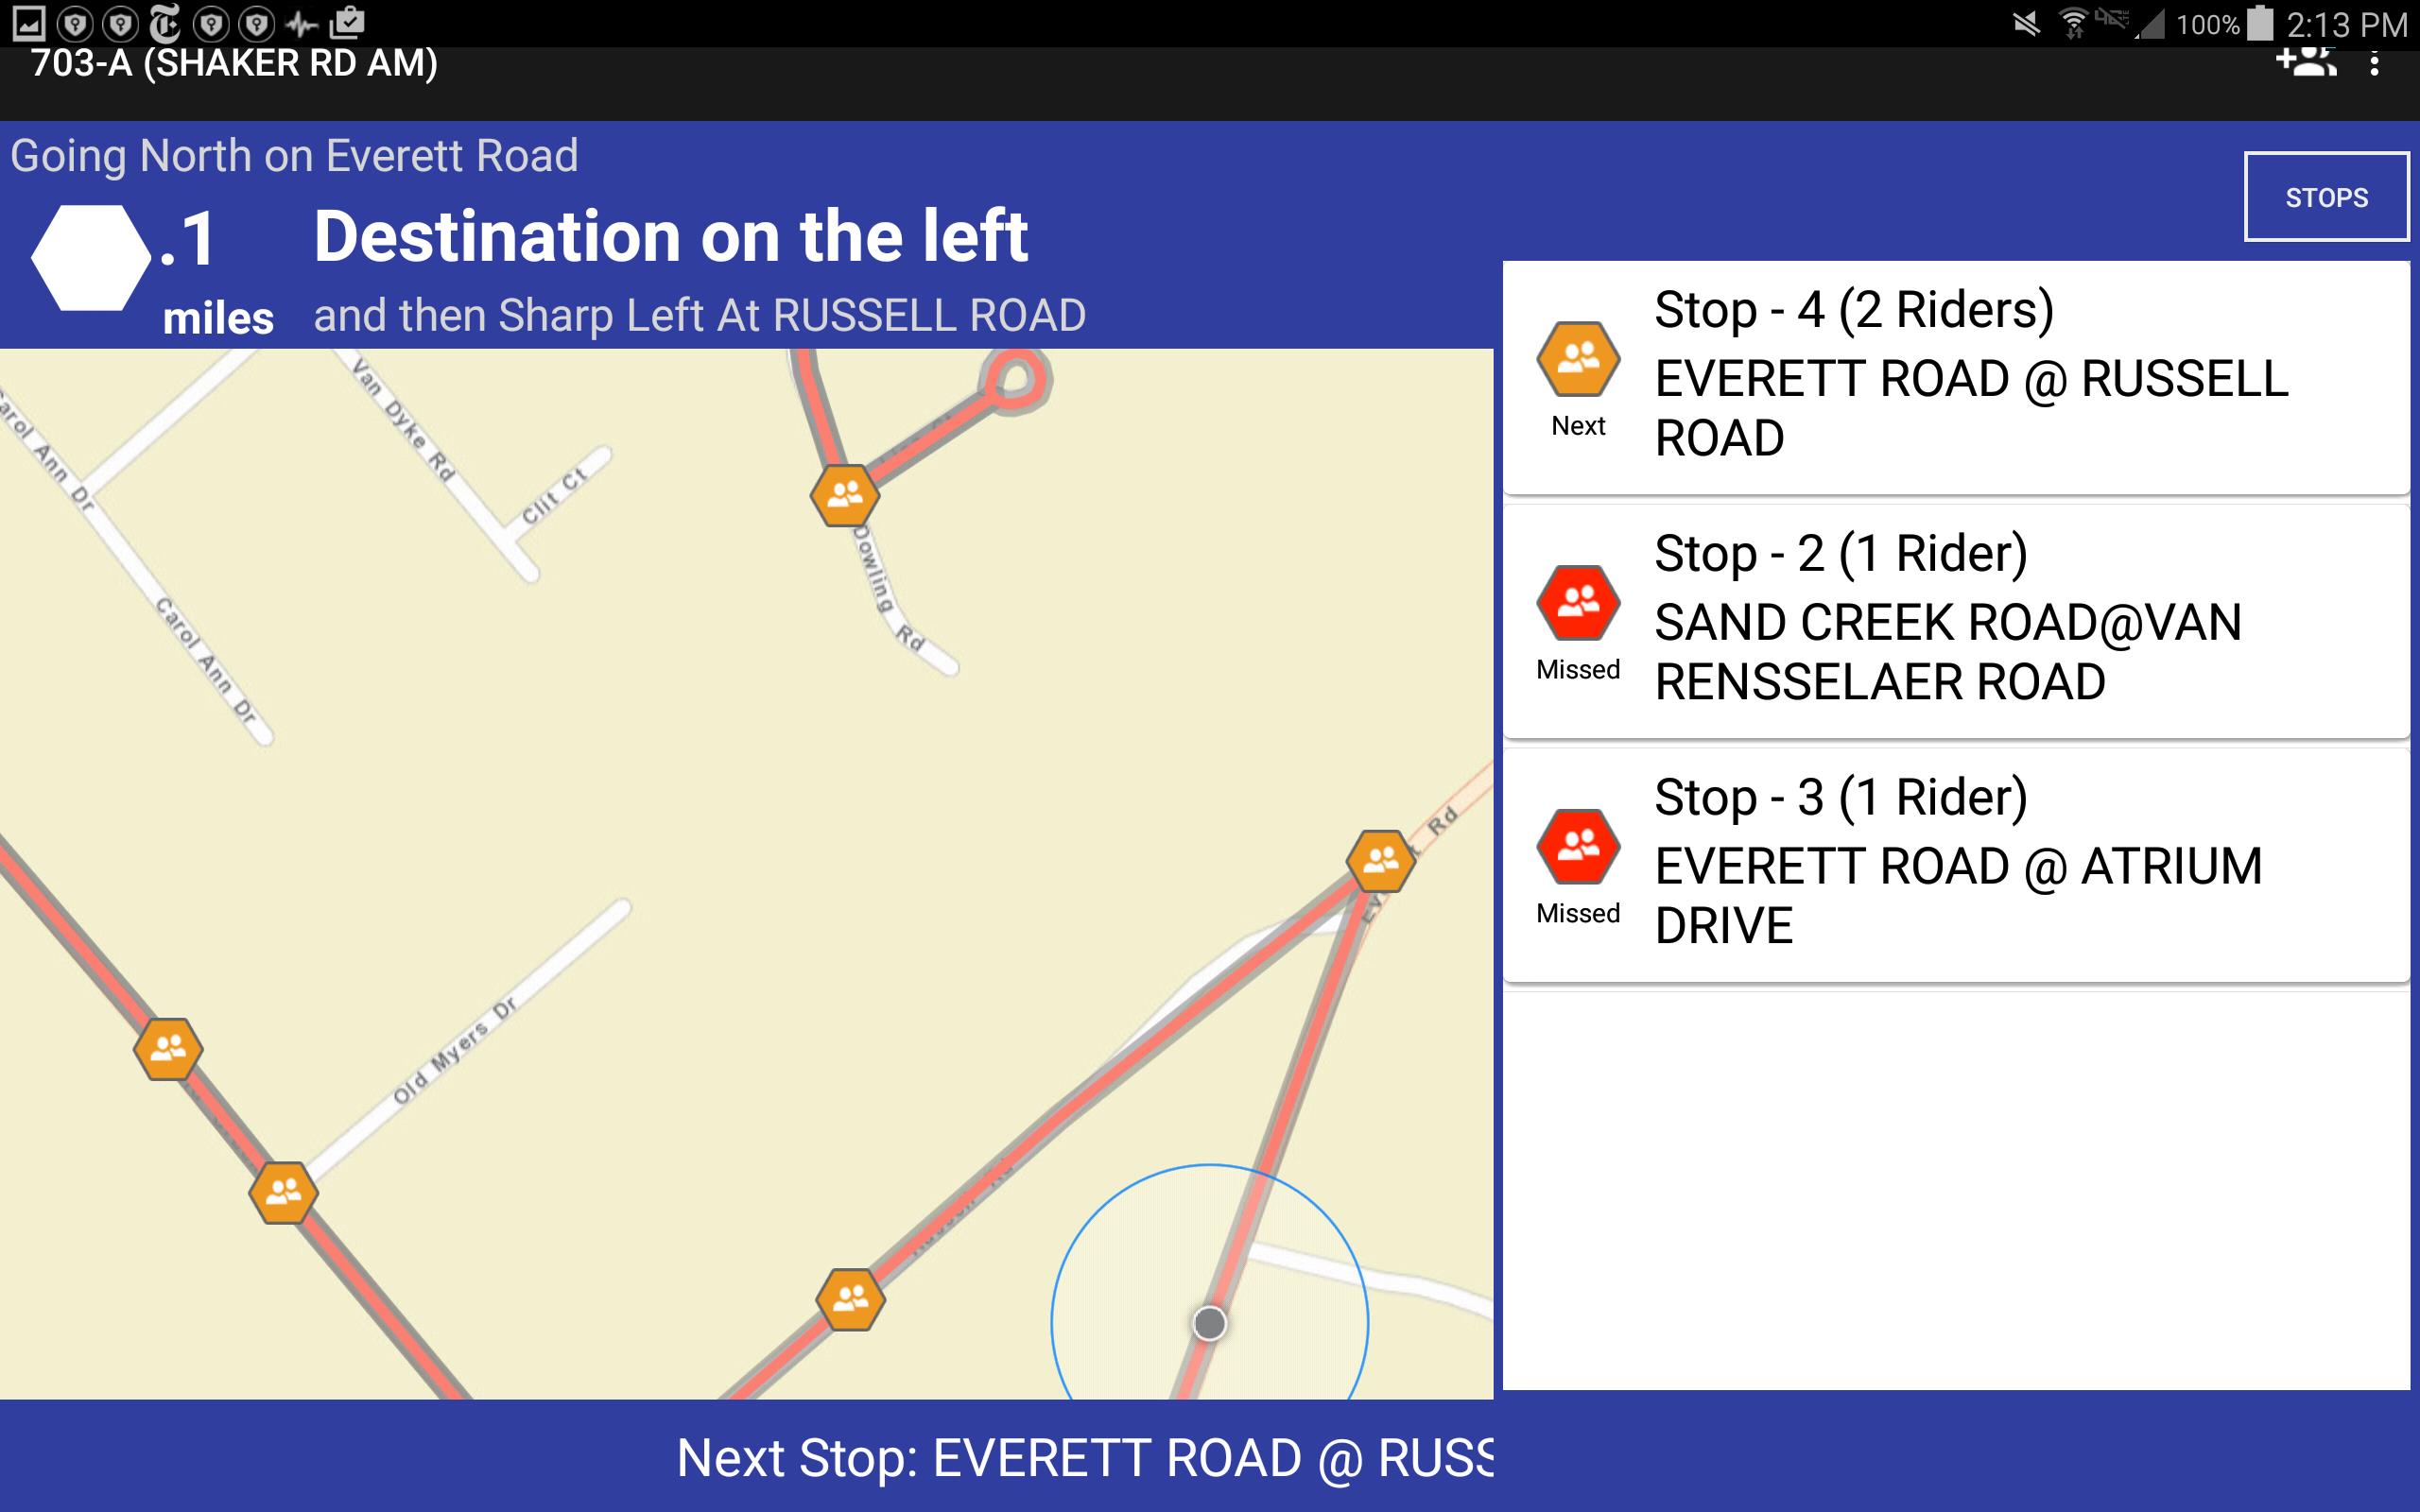
Tyler Drive live navigation assist the bus driver in getting to all the planned stops, picking up students and dropping them off.

Versatrans Suite

Versatrans is a complete school transportation software suite designed to help school districts efficiently and cost-effectively manage day-to-day transportation needs, transporting students to and from their educational programs on time and on budget.

  • Routing & Planning is a multi-user transportation management system that can effectively handle multiple destinations within the District’s demographics.
  • Versatrans Onscreen® is a GPS fleet tracking solution.
  • Versatrans My Stop™ is a mobile application for parents, guardians and students to know exactly where their bus is and what time it will show up at their stop — all from a smartphone or similar mobile device.
  • Versatrans Fleetvision® is a maintenance software to manage district fleet. It can auto-generate work orders, track inventory and organize employee certifications.
  • Versatrans Triptracker® is web-based field trip software, automates otherwise cumbersome processes like driver selection and personnel approval.
  • Tyler Telematic GPS™ is a hardware solution for school buses providing a complete view of vehicle, driver and engine. Tyler Telematic GPS includes: software expandability, driver scorecard, accident reporting, engine data, real-time alerting and more.

Implementation Services

Tyler’s implementation services include training on software functionality and full map preparation, including entering all district schools with grades, other buildings, walk zones, safe zones, bus stops, bell times and more. Tyler gives many options to keep customer maps current, and when the product receives electronic updates from the original map source, functionality is not affected. Tyler’s maps have the ability to utilize GPS information, draw streets simply and accurately, modify street names, and adjust run times to factors like time of day and school bus speeds. The process is automated to provide both efficiency and safety.

Geotab GPS

Tyler has a long standing relationship with Geotab Inc.; the leader in telematic solutions for heavy-duty vehicles. Tyler has been an authorized reseller for the Geotab hardware since 2010 and its close partnership with Geotab over the years has led to Tyler having the distinction as the only partner to have integrated Geotab data within the K-12 marketplace.

Esri Gold Partner

Tyler is an Esri Gold Tier partner, which enabled Tyler to be an industry-leading provider of geospatial solutions and services. As a Gold Tier partner, Esri recognizes Tyler’s commitment to providing enhanced technical and sales support, collaborative engagement and a national and multinational focus. Multiple Tyler solutions use Esri technology, including suites in school transportation, appraisal and tax, planning, permitting and public safety. Tyler has been an Esri partner for more than a decade.  Tyler’s new K-12 transportation solution, Traversa, is based on Esri technology.

 To find more about Tyler Technologies and their office in Latham, New York, visit their website.

CONTACT

Ted Thien
Sr. Vice President and General Manager, Versatrans
Tyler Technologies, Inc.
23 British American Blvd
Latham, New York 12110
Phone: 800.433.5530 ext. 131840
Email: ted.thien@tylertech.com

Geospatial Business Spotlight: Mohawk Valley GIS

Company Name:                Mohawk Valley GIS

Website:                               www.mohawkvalleygis.com

Established:                          2003

THE COMPANY

Linda Rockwood founded Mohawk Valley GIS in 2003, after her family relocated to Herkimer County, New York.   Previously, she owned North Country Technology Integration in New Hampshire, working primarily with school teachers to integrate technology and particularly GPS and GIS into the K-12 curriculum.

Initially, Linda had planned to continue offering the same type of services in New York, but found more opportunities early on providing GIS system development, data creation and training to municipalities, and designing custom print maps for organizations.

Mohawk Valley GIS moved to historic Bagg’s Square in downtown Utica in 2014 and has grown to include three full-time staff in addition to Linda, who continues to keep her GIS skills current along with coordinating all business development associated with the firm.    Interns from nearby SUNY Polytechnic Institute  and Syracuse University help when everyone starts bouncing off the walls.  The business received NY Women Business Enterprise (WBE) certification in 2013.

PRODUCTS AND SERVICES

The company has expanded to offer a complete suite of technology services including custom interactive online maps and mobile applications to help promote tourism and recreation, as well as to helping businesses, organizations and local governments towards updating websites to be mobile responsive.

By example, GoCaz.com is an interactive web map promoting four season recreation opportunities throughout the Cazenovia area in the Finger Lakes Region.  This particular project is an example of an adaptive, rather than a responsive, mobile application.  The software checks to see what device is accessing the map, then adapts by “offering” the correct version, either large screen or small device screen, as shown below.

The GoCaz website is device independent - enabling users to access the application from different platforms.

The GoCaz website is device independent – enabling users to access the application from different platforms. The browser version screen is on the left and smartphone version on the right.

Mohawk Valley GIS has also been running two promotional, recreation e-commerce sites for the past six years: the winter-oriented NY Snowmobile Trails  and the summer-oriented ADK Trail Map.   The Snowmobile Map application features an interactive map with a route planner, no-reception-needed trail apps with turn-by-turn navigation, and GPS map offerings including Garmin .img file format overlay maps and regional .GPX track files and waypoints.  The application was built in partnership with over 100 snowmobile clubs throughout New York State and was just awarded a NYS GIS Association Applications Award at NYGeoCon 2015.  Many similar functions are available in the ADK Trail Map.  Both projects feature responsive interactive maps, which respond to the device screen size by repositioning elements or eliminating some functionality.

n addition to a massive catalog of snowmobile trails, the application provides access to information on lodging, restaurants, and related travel services

In addition to containing a massive catalog of statewide snowmobile trails, the application also provides access to information on lodging, restaurants, and related travel services.

The route planner and turn-by-turn navigation functionality are built using a pathfinding algorithm which required converting the shapefile representation of the trails to a graph data structure. All geospatial application code in the web map is programmed using Leaflet, an Open Source javascript library.

Core Mohawk Valley GIS services  include GPS data collection, geocoding and digitizing, custom map creation, GIS implementation and training, and GIS data analysis, particularly with regard to big data analysis for predictive analytics and visualization.

Other recent or currently underway Mohawk Valley GIS projects include:

  • Municipality mobile app for Town of Webb/Old Forge, reception required, runs on all mobile devices/browsers, designed primarily for codes enforcement department
  • Municipality mobile app for Warren County, no reception needed, for first responders, focusing on building and structure characteristics
  • Custom paper map design for Vermont Association of Snow Travelers
  • Responsive website for the Herkimer County Chamber of Commerce
  • A unique (at clients request) website, American Electrical Enterprises, which uses a high tech data and chart visualization library
  • Three “big data analysis projects”, all under Non-Disclosure Agreements (NDA), which include  strong geospatial components related to predictive analytics, marketing, and real time data interpretation

To find out more about Mohawk Valley GIS geospatial services and products, visit their website.

CONTACT

Linda Rockwood, Owner

linda@mohawkvalleygis.com

114 Genesee Street, 3rd floor

Utica, NY  13502

315-624-9545

www.mohawkvalleygis.com


Geospatial Business Spotlight: Spatial Analytix

Company Name:        Spatial Analytix

Website:                      http://www.spatialanalytixllc.com/

Established:                2015

The Company                                                       

Spatial Analytix is currently under the leadership of Ben Houston (CEO) and Matt Mercurio (GTO).  Together, both bring a wealth of experience in GIS and mapping to the growing Unmanned Aerial Vehicle (UAV) mapping market in New York State and beyond.

Most recently, Matt was GIS Manager in Allegheny County, PA and before that Project Manager at the Institute for the Application of Geospatial Technology (IAGT) in Auburn, NY. He also continues to be a principle and founder at Civic Mapper (www.civicmapper.com). Ben has spent the past six years as founder and officer at GroundPoint Technologies (www.groundpointllc.com) and prior to this worked with Matt and other colleagues at IAGT in both NASA and New York State Department of Environmental Conservation (NYSDEC) funded geospatial programs.

Spatial Analytix was formed in early 2015 to support a growing need in the UAV data processing market.   The current emphasis in the UAV market is on platforms, hardware, software and cloud based solutions, not the data. Spatial Analytix believes that the next few years will be characterized by market confusion over data quality and deliverables as even experienced geospatial professionals sort through the fog. By bringing a focus on data quality and useful deliverables, Spatial Analytix moves UAV data collections beyond being just imagery projects to producing high quality, plug and play geospatial data.

Geospatial Services   

Spatial Analytix focuses on geospatial data in terms of the data quality triangle:

SA1While much of the current discussion in the UAV market focuses on the wow factor of precision, Spatial Analytix also considers temporal components along with verifiable accuracy in the data deliverables to ensure customers get what they want, when they want it. It’s the three elements together that bring real value to the data.

Typical outputs from automated processing (i.e., web based solutions) normally include point clouds, terrain models, and image mosaics (often labeled with the misnomer of “orthomosaics”). Such deliverables are usually acceptable for surveillance and monitoring uses, but for true GIS and engineering mapping applications, automated processing solutions leave a big data quality gap. Artifacts, noise and flight line overlap issues can clutter the point cloud and skew surface models, making for inaccurate contours and messy mosaics. Automated orthophotography can show up with smearing and ghosts, and usually do not include optimal image and cut line selection. Although available off-the-shelf geoprocessing tools in this space are becoming more powerful and functional each day, Spatial Analytix combines the right mix of quality tools, technical knowledge, and artisanal experience to get projects to come out right. The first time.

Clients can access raw data and processed deliverables through standard file systems, or as a URL which can be delivered across an enterprise for data visualization and exploration. No longer do the deliverables need to be sent to a GIS or CAD operator to put on screen for a supervisor or program manager. Live, web based delivery of hosted data is now standard. Platforms range from Google Maps to ArcGIS Online to Pictometry Connect. When compared to traditional photogrammetric and aerial survey products, Spatial Analytix deliverables are designed to be not only equivalent…but better.

Ortho-Image

Ortho-Image

Spatial Analytix is developing a network of regional UAV data collectors offering standard services including:

  • Point Clouds (LAS format)
  • DTMs (full surface)
  • DEMs (bare earth surface)
  • Contours
  • Breaklines
  • Planimetrics
  • Image mosaics/orthomosaics
  • Volumetrics
  • Drainage
  • Vegetation/Landcover/Impervious surface mapping
Colorized point cloud

Colorized point cloud

In the near future, Spatial Analytix product enhancements will include:

  • Oblique imagery integration (Pictometry Connect integration)
  • GeoVideo
Typical UAV Flight Line Configuration Developing 3D Model

Typical UAV Flight Line Configuration Developing 3D Model


Spatial Analytix offers Virtual Geospatial Technology Office (vGTO) services to partner companies looking to leverage UAV and geospatial technologies by providing authoritative consulting support on such things as optimal flight planning and data processing, enterprise data management, and web based solutions. Whatever the UAV geospatial data deliverable is –  imagery, elevation, vector, or raster –  Spatial Analytix is confident that users have never seen data like this before.

Contact:   

Ben Houston, ben.houston@spatialanalytixllc.com

Matt Mercurio, matt.mercurio@spatialanalytixllc.com

Website: spatialanalytixllc.com

Facebook: /spatialanalytix

Twitter: @spatialanalytix

(412) 368-6015

GTO © Professional Services

SA7