Streamlining the New York City Environmental Quality (CEQR) Review Application with Geospatial Tools

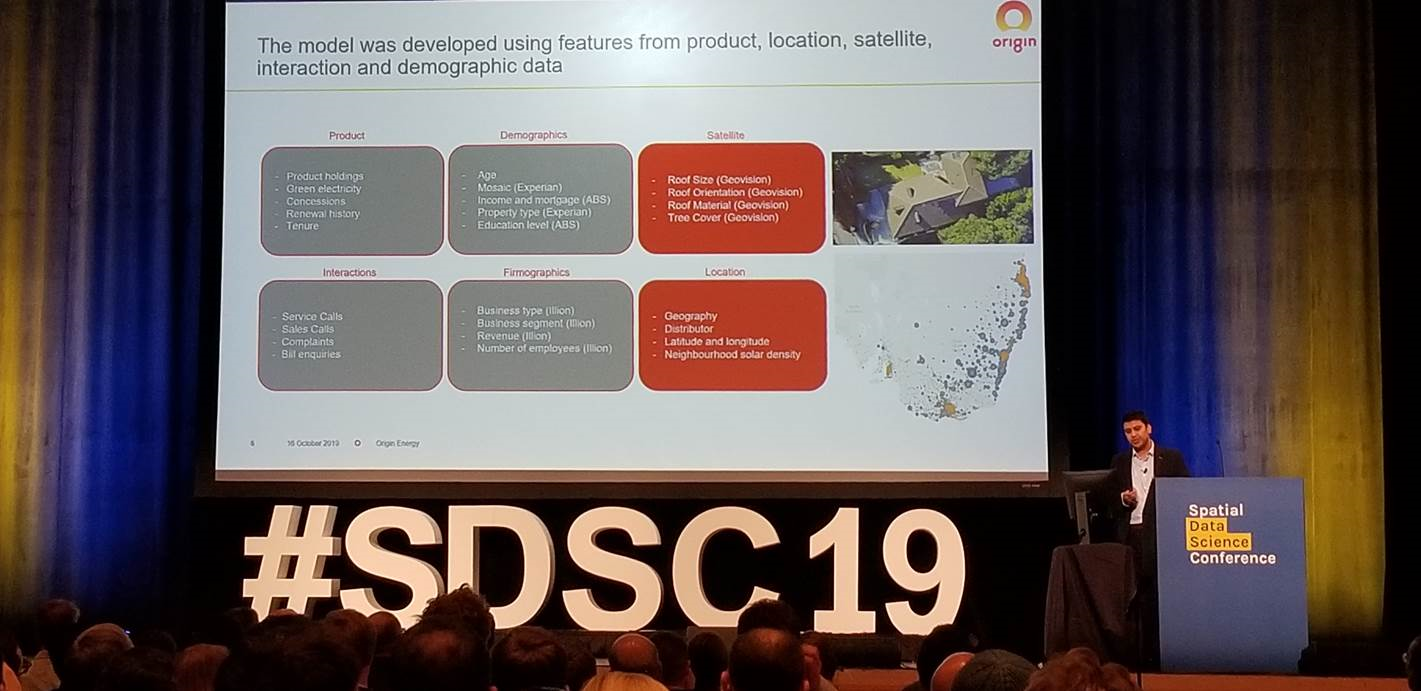
Open source content and tools at the core of automating complex process

City Environmental Quality Review, or CEQR, is the process by which New York City agencies determine what effect, if any, a discretionary action they approve may have upon the environment. CEQR is a disclosure process and not an approval process in and of itself. Completion of an environmental review supports other decisions made by agencies such as approvals of rezoning or variance applications, funding, or issuance of discretionary permits. Ministerial actions, such as the issuance of a building permit, are not subject to environmental review.

Historically, CEQR, along with other government environmental review programs such as the New York State Environmental Quality Review Act (SEQRA) and the National Environmental Protection Act (NEPA) have been the subject of much debate – right or wrong – with regard to being overwhelming, complicated, and costly to those individuals and/or organizations involved in projects or “actions” which trigger the application process.

CEQR is precursor to ULURP (Uniform Land Use Review Procedure), which, in part, is the approval process that decides the fate of the action.  ULURP cannot start until the environmental review process is complete.

Introducing AutoCEQR

In the New York CEQR space, leave it to a couple seasoned GIS folks to step in and combine  professional experience with geospatial tools and programming skills to offer a cost effective and streamlined process to work through the CEQR application.

AutoCEQR cofounder Matt Sloane has worked in the planning field since 2007, working extensively with SEQRA and CEQR.  Over that time Matt developed specialties in both GIS and Data Science.  As Matt learned to program the tools that power ESRI ArcDesktop software, he realized that many of the processes required by CEQR, which are explicitly prescribed by the CEQR Technical Manual, could be automated based on existing data (e.g., MapPLUTO) and several project-specific inputs. He approached Danny Sheehan, a close friend and former classmate at SUNY Geneseo’s planning and geography courses, about the project. Both agreed it would be a great opportunity to put their combined skills to work and build a platform to augment the CEQR application process.  Danny was able to bring geospatial development expertise and software production knowledge he learned at UBS, Carto, and Columbia University to start and evolve the project into a production application.

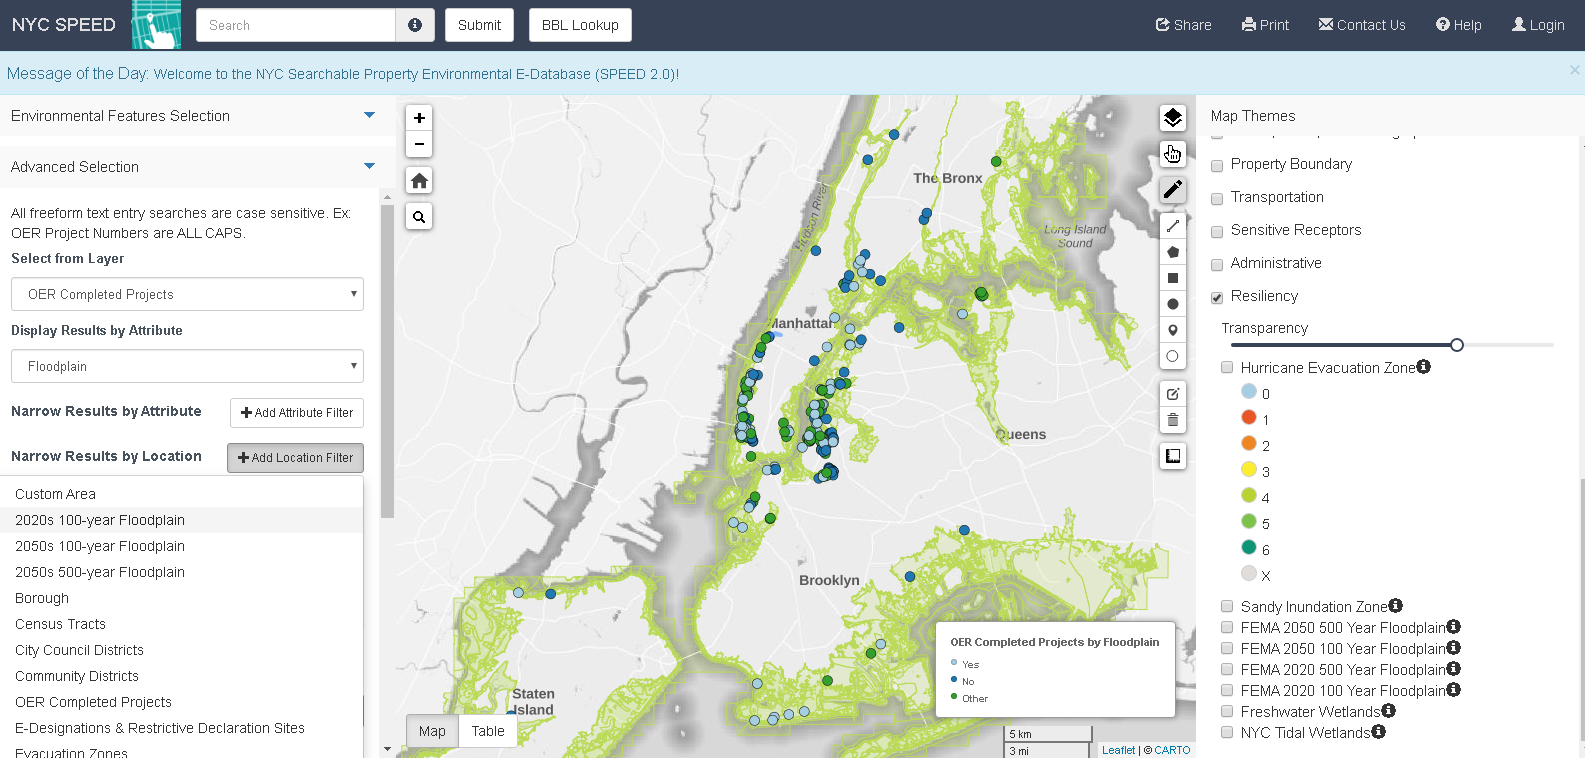
AutoCEQR leverages a mixture of City, State, and Federal data resources, though primarily relies on NYC Open Data.  Other data sources include:

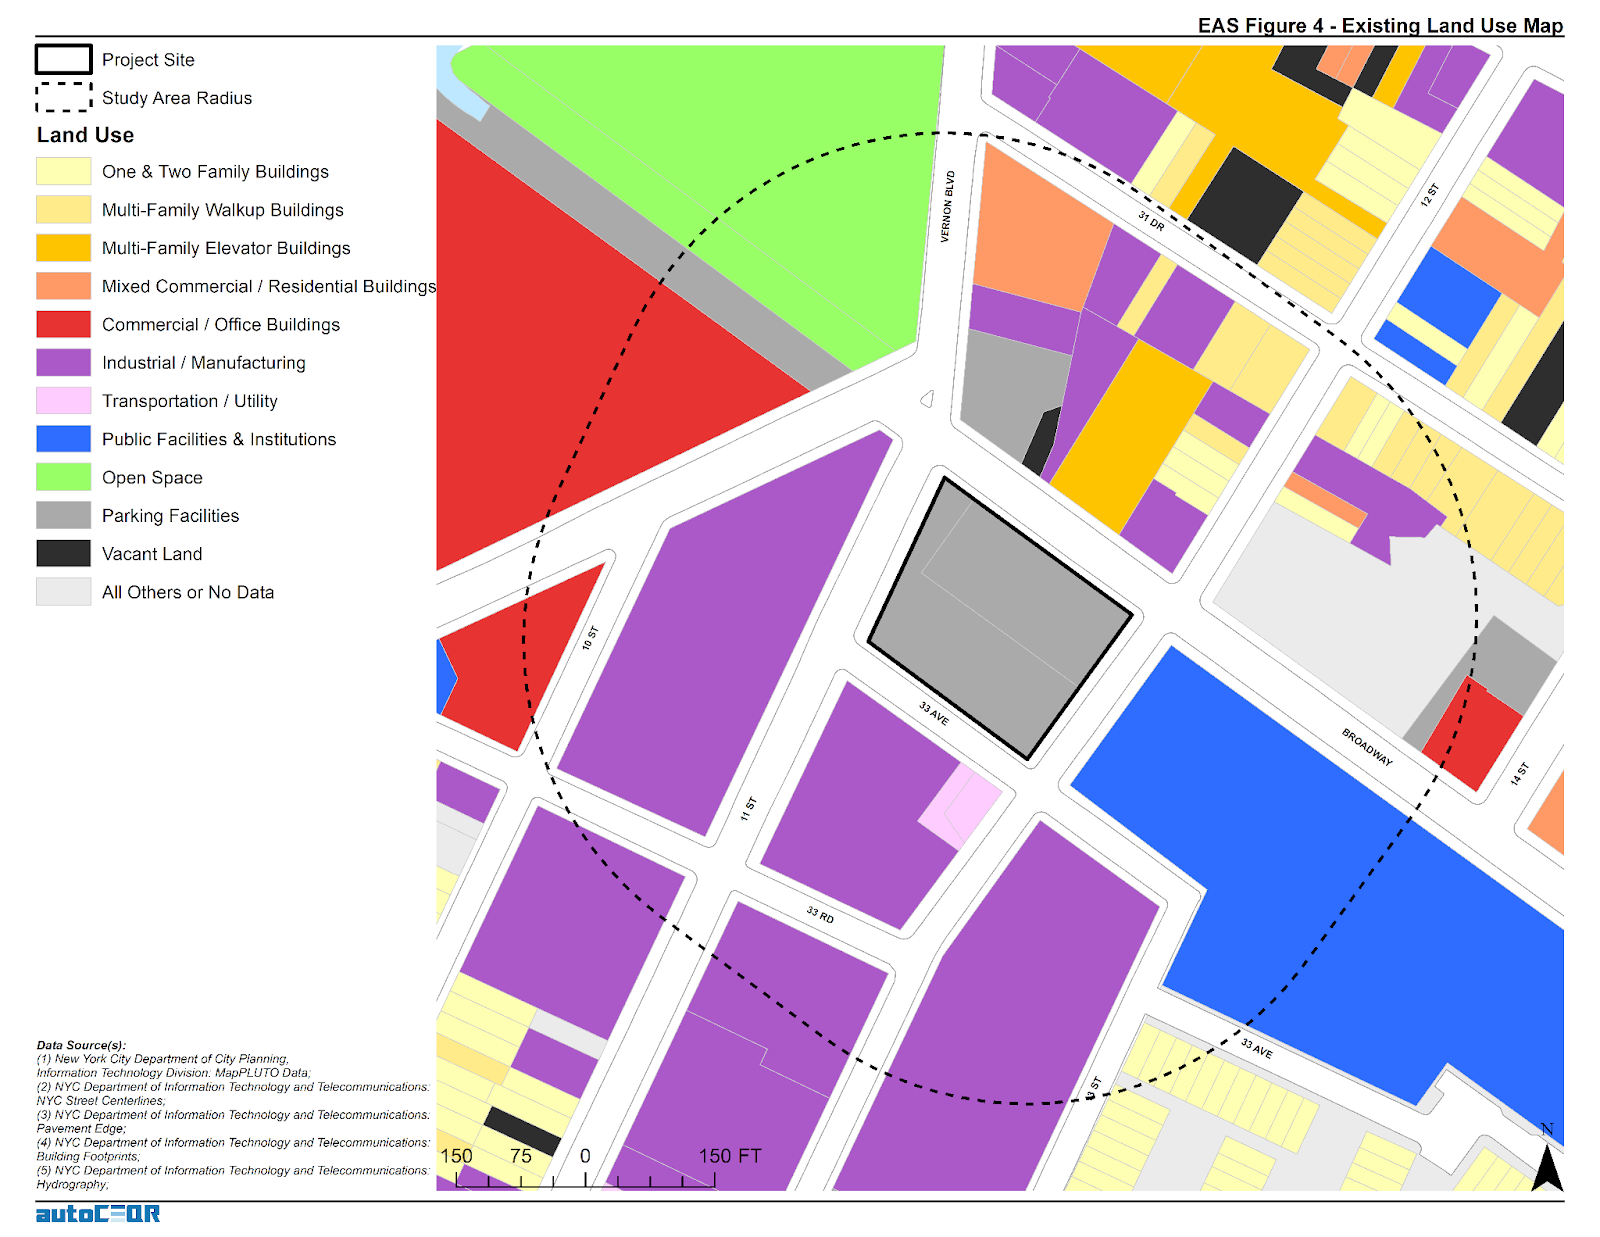
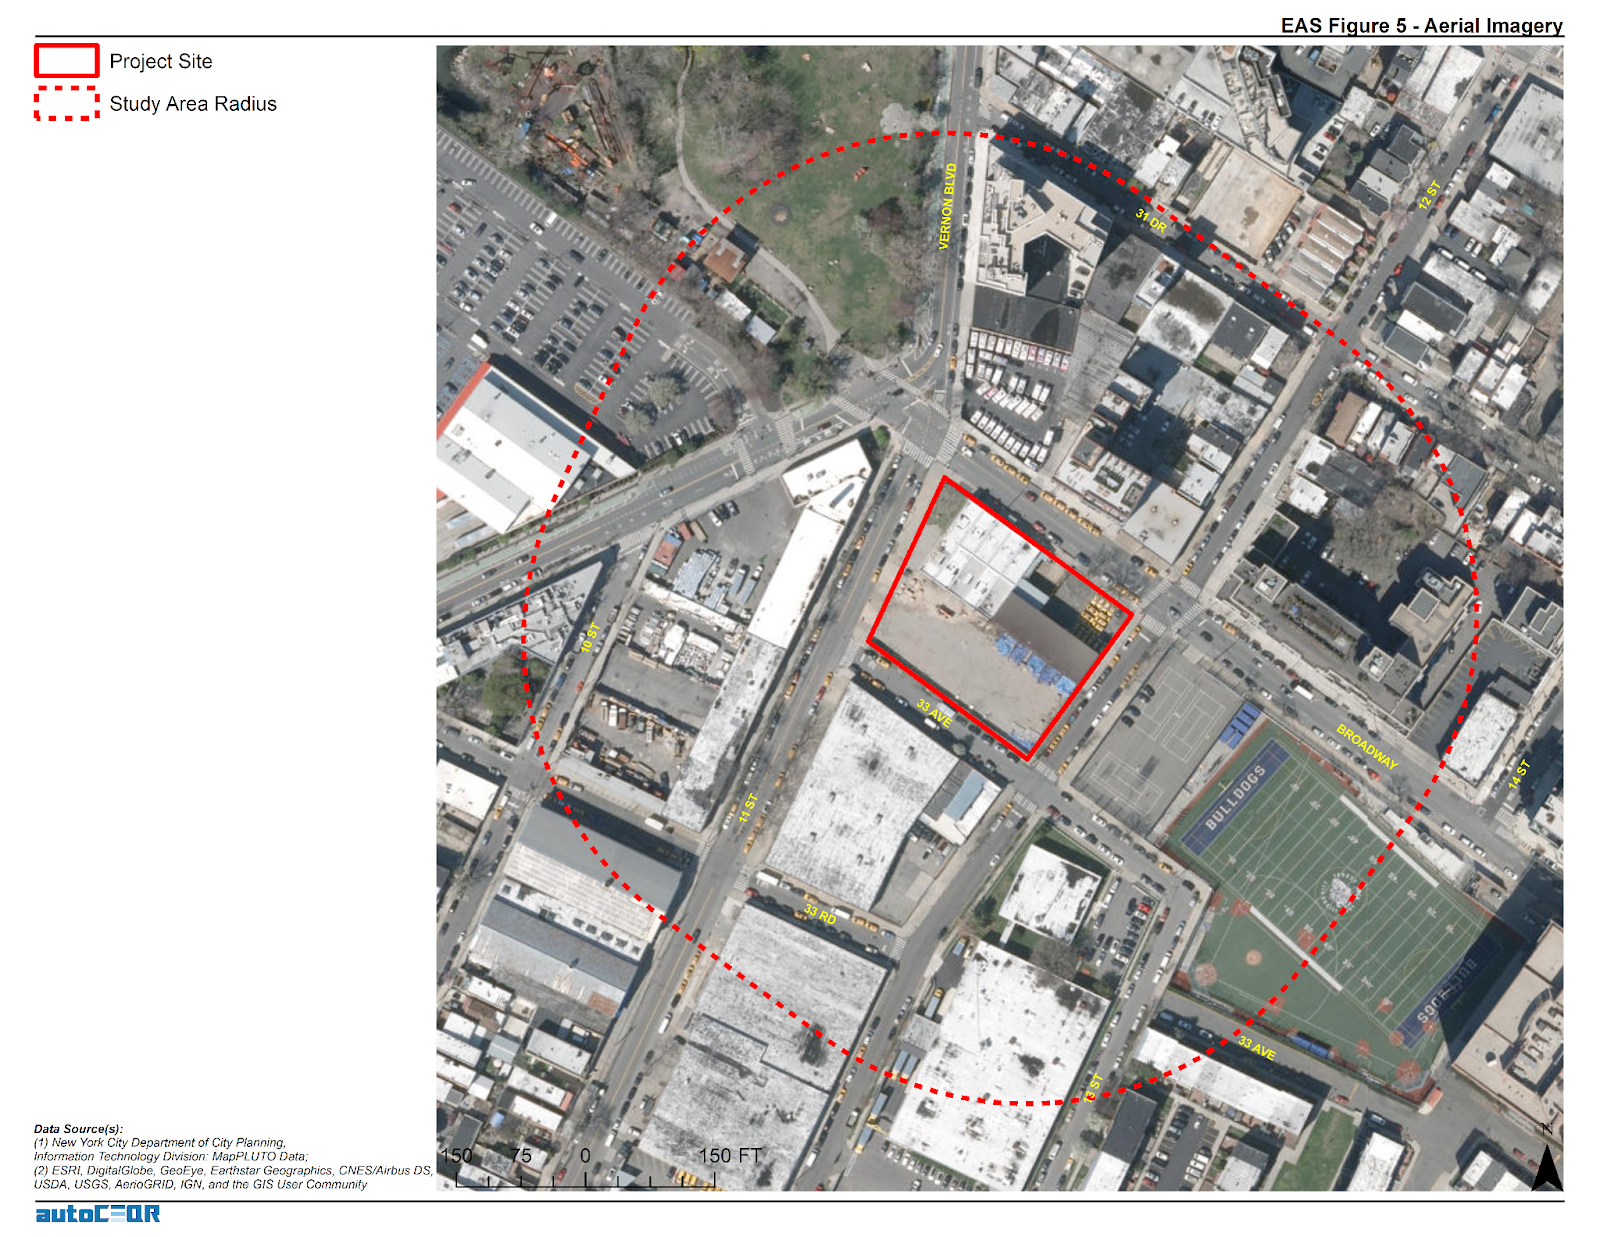
This 400’ radius buffer around a subject property which requires CEQR shows adjacent parcel land use classifications that are included in the NYC MapPluto file on a regular basis

A. Coding and Software Environments

Python is at the core of the AutoCEQR technology.  For working with data, the AutoCEQR team uses  Pandas, GeoPandas, Shapely, Fiona and ArcPy for generating Map Document files (.mxd’s), and creating custom Python classes for the workloads.  Sheehan notes “With GeoPandas and Shapely it’s phenomenal how close to parity they now are for matching ArcPy functionality.”  In the development environment, PyCharm Community Edition and GitHub are used for code development & versioning.   

AutoCEQR prototyping started with ArcPy for all tasks but it was decided to abstract the high-level functions so the geoprocessing engine could be changed to GeoPandas, the geoprocessing library of choice.  For interacting and communicating with Amazon Web Services (AWS) – the current AutoCEQR Cloud Computing Platform – developers leveraged Boto3 (AWS SDK for Python).  EC2 and S3 is leveraged in the AWS environment for computing, data storage, and distribution which has enabled to keep the application computing bill fairly low per month. In the future, it is anticipated to modify the architecture by leveraging more serverless technology and more scalable architecture for added compute cost savings.   AWS generously provided AutoCEQR with free computing credits for one year through AWS Activate – which was brought to their attention as part of their involvement and experience at the Columbia Startup Lab (CSL).  QGIS is also used to verify results and quick GIS work. 

Interacting with Census data and a whole host of services is made possible by leveraging the many great open-source libraries available on PyPl and GitHub. The storefront is the Squarespace AP which is used to process and deliver orders.

AutoCEQR still uses ArcPy mapping for generating maps, .mxd’s, and map packages but given the high cost of licensing and the technical slowdown it adds to both the production application and ongoing development speed, and it’s unclear if .mxd’s will exist in future iterations. (Both Sheehan and Sloane would like to have more feedback from users if the .mxd deliverable is necessary or if the application should generate static maps with Matplotlib and GeoPandas or if interactive web maps would be more helpful.)

The data engineering ETL process mostly consists of pulling down data with requests, unzipping files, some transformations and projecting data, and API libraries and a scheduler. We download the latest data every night – whether the source is updated daily or not. Data ETL would be a big focus to redesign to improve the platform and save on cloud storage and computing costs.

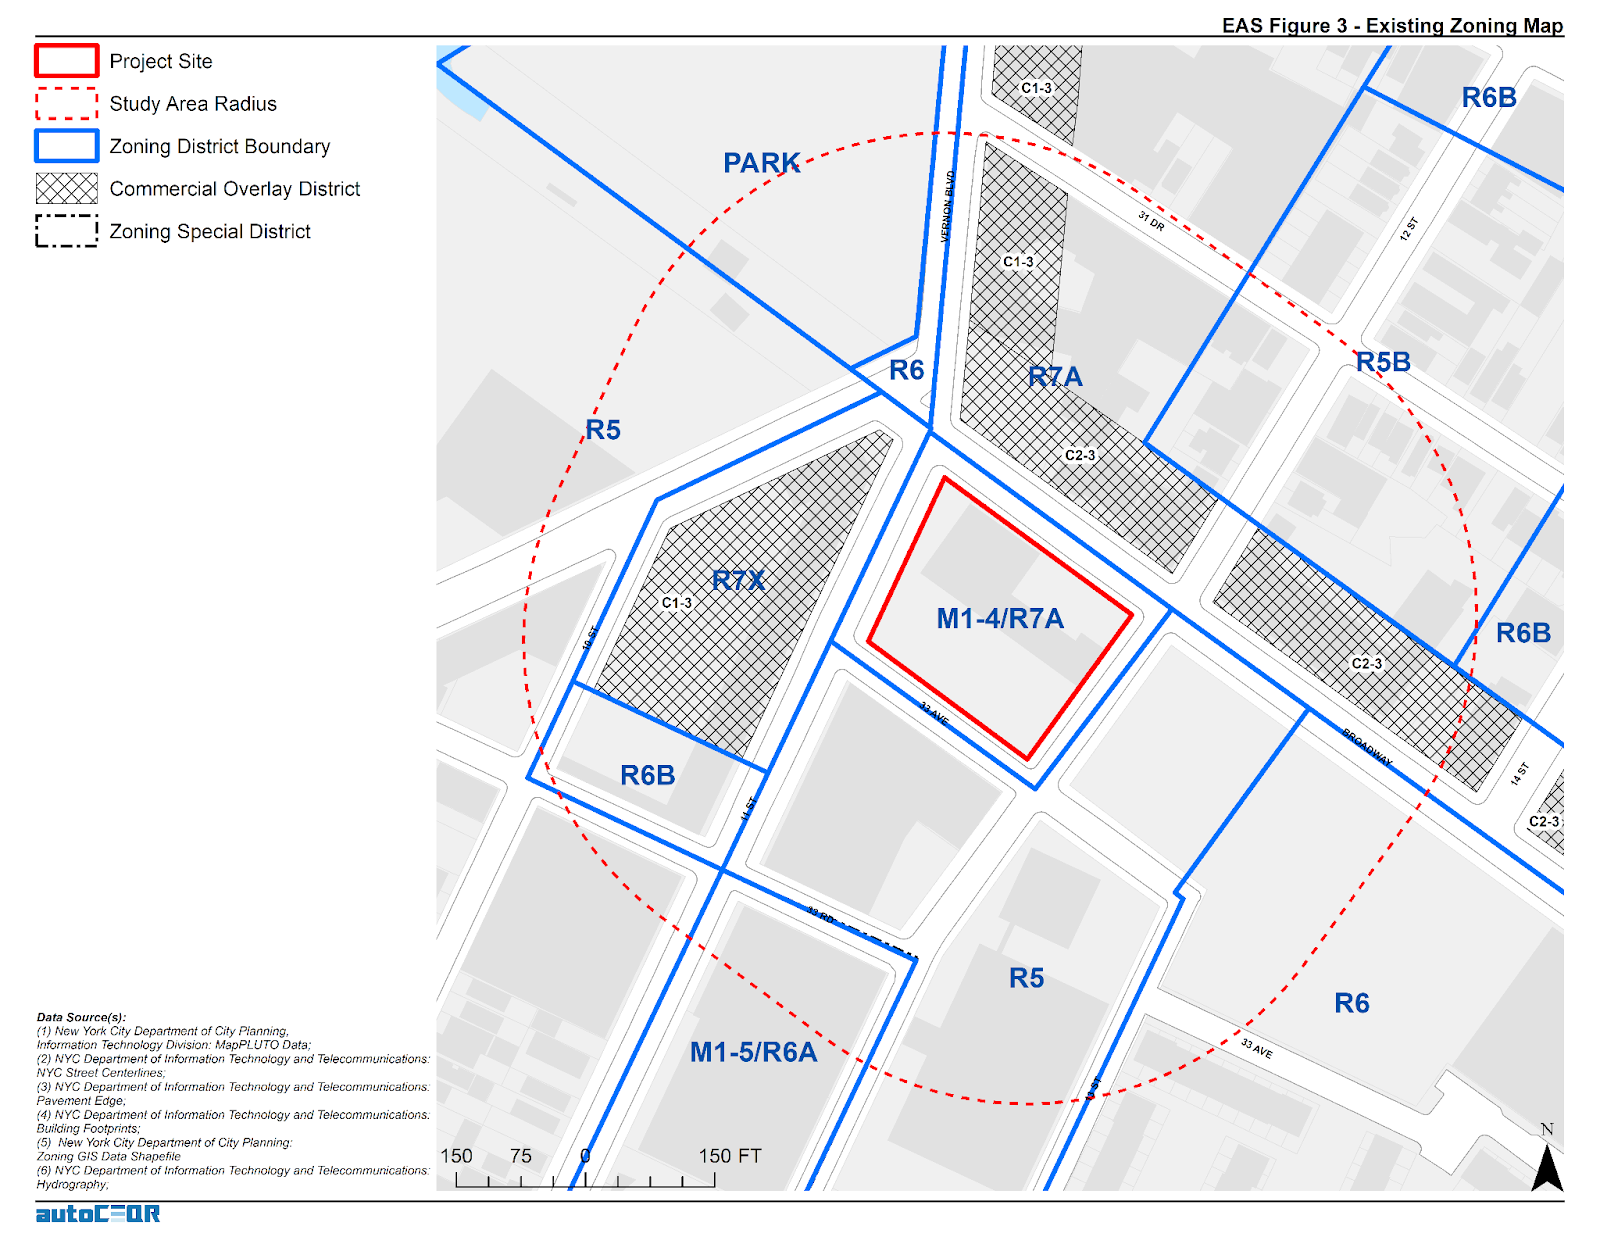
In addition to being consistent with existing property zoning classifications, projects are also reviewed in context of proximity to a myriad of other special districts and overlay zones.

B.  Application Process

Users input relevant project-specific information (e.g., dwelling units, building height, square footage, etc.) via the AutoCEQR website.  From there the application software ingests  the data and checks it against public data sources – usually with some intermediate geoprocessing steps required – and then references the analysis thresholds stated in the Environmental Assessment Form (EAS) to determine which analysis the proposed project is required to undertake as part of the CEQR environmental review. For certain quantitative calculations,  AutoCEQR has translated all of that logic into functions or classes in the codebase. Users also receive the data and maps for either a CEQR Pre-Screen or a select set of CEQR Full Analysis items. This VIMEO video provides an introduction to accessing the application and illustrates the products generated.

C.  Usage

To date, AutoCEQR has had several dozen environmental professionals targeted from a few key firms to evaluate application and then go on to use AutoCEQR in production. Currently Sheeran and Sloane are allowing users to leverage AutoCEQR freely in order to get helpful product feedback and gain traction.  With the aim of soliciting feedback for refinement, feature expansion, and product evolution,  AutoCEQR has been well received by former director of the NYCDCP Environmental Assessment Review Division, Ms. Olga Abinader.  She comments:

“AutoCEQR is an excellent application – as its title indicates, it automates tedious, time-consuming CEQR documentation that has historically taken consultants dozens of person-hours to complete.  As a longtime NYC environmental review expert and former public service leader, I appreciate that it gathers data points from the City’s publicly available databases and agency websites (MapPLUTO, NYC Parks, NYC LPC, GIS sources), and combines this information with user inputs (i.e., analysis framework details) to generate useful EAS Maps, visuals, and content/data for the EAS Forms in a short turnaround. Given the time savings it offers, I am very enthusiastic about AutoCEQR as a tool and recommend it highly to consultants, public service professionals, the general public, decision-makers and others interested in preparing or reviewing CEQR materials.” 

As the product is currently operating under a freemium model, users don’t need to currently apply the discount.  However, it is important for AutoCEQR to continue this offering to support affordable housing in NYC in the event AutoCEQR ever moves to any kind of fee-based model. 

All AutoCEQR maps included in the project delivery file as both ArcGIS Map Document files (.mxd) and Map Package files (.mpk).

D.  Affordable Housing Development Services Discount

Those working on the development of Affordable Housing or Inclusionary Housing are encouraged to contact the AutoCEQR team.  It is their aim is to provide the AutoCEQR platform and reporting deeply discounted for individuals or companies involved in these types of housing projects.  If the entire development provides 100% Affordable units, the AutoCEQR team intends to provide free reporting and analysis.*

As the product is currently operating under a freemium model, users don’t need to currently apply the discount.  However, it is important for AutoCEQR to continue this offering to support affordable housing in NYC in the event AutoCEQR ever moves to any kind of fee-based model. 

* Free reporting with minimal overhead for costs associated with report processing. 

Summary 

Development and marketing efforts on the AutoCEQR project has slowed down since both Sheehan and Sloane have started new full-time positions.  Nonetheless, both continue to explore interesting options for its future development and continued success.  Individuals and companies interested in the application and/or communicating with Sheehan and Sloane are encouraged to do so via the contact information below.

Contact:

Daniel M. Sheehan
danny@autoceqr.com

Matt Sloane
matt@autoceqr.com

SPEED 2.0: Authoritative Environmental Remediation Mapping in New York City

Application Includes the use of both Open Source Software and Open Data Content

A lot of great geospatial projects and content are coming out of the NYC OpenData ecosystem.  In the same space  throughout the city is the deployment of applications and viewers using open source software.  One such app is the Searchable Property Environmental E-Database SPEED 2.0, built on top of CARTO and published by the Mayor’s Office of Environmental Remediation (OER).  I was introduced to the application via an online presentation organized by GISMO in March of this year.

SPEED 2.0 is an impressive collection of local/city, state, and federal geospatial datasets wrapped into one application for the purpose of helping individuals identify environmental issues – both current and past – on and/or adjacent to specific properties in New York City.  It is a sister application to the NYC Office of Environmental Remediation’s Environmental Project Information Center (EPIC) that provides information about the cleanup of brownfield sites across the city.

Individual parcels can be buffered by either 250’ or 500’ to show the proximity of adjacent parcels with current or past environmental issues, permitting, or contamination issues. Access to pertinent metadata is readily available.

Background

According to Lee Ilan, Chief of Planning in the Mayor’s Office of Environmental Remediation, the first version of SPEED was launched in 2009 as a web map with limited functionality and developed with PostGIS.  It was launched in support of the newly created office’s focus on the cleanup of brownfields across the city.  However, support for the initial application waned over the next several years with minimal new content added.  Post – SuperStorm Sandy provided new funding through the U.S. Housing and Urban Development (HUD) Community Development Block Grant Disaster Recovery Program which OER secured and offered the opportunity for a major rewrite and update of the original application. SPEED 2.0 was designed by their vendor Applied Geographics (AppGeo) to be a cloud-based application.  Originally the application was managed by the vendor but since December 2020, OER has assumed managing the app in the Google Cloud on their own.

The application also includes advanced search functions. For example, in the left-hand column using the filter options, I was able to identify only those OER projects in FEMA 100-year floodplains. Query is rendered in the map viewer.

Carto software is helpful by providing a very modern user interface that generates layers which are compatible with Leaflet”, notes OER’s IT Director Maksim Kleban.  “It makes the transition from uploading our layers, and turning them into fully functional, interactive maps seamless.”  AppGeo proposed the use of CARTO to OER which has since found the software to be user friendly and simple to use with standalone online applications. Carto is licensed annually for the amount of space and resources needed for the SPEED application and works very similar to any other cloud solution, like Amazon Web Services, Microsoft Azure (AWS), or Google Cloud.

Currently there are about 50-55 datasets included in the SPEED viewer right now. The large majority are OER datasets which are updated automatically by syncing with data from external agencies’ datasets on Open Data, or from OER’s internal data sources.  Generally, they each have an independent update schedule which is also automated.   The data is managed mostly by automatic updates on OER’s server which communicates directly to Carto through an API. For layers which are not on an automatic update schedule, OER uses either a custom-designed interface or manually uploads data into Carto’s online platform.

User can search the SPEED database using a standardized address, common place names such as Bryant Park or Madison Square Garden (btw – even “MSG”!) or borough, block and lot (BBL) numbers.  The application also includes mark-up, feature transparency, and sharing tools,  great HELP documentation and easy access to metadata (as illustrated in the first image above) which is very helpful given the bevy of similar datasets from local, state and federal datasets accessible in the app.  Historical aerial photography from 1996, 1951, and 1924 enables users to identify previous land cover which can be an indicator of the presence of historic fill.  A “Sensitive Receptors layer includes the locations of facilities (schools, parks, libraries, health care, etc) where occupants are more susceptible to the effects of environmental contamination.

It continues to be a work in progress” says Ilan, “in the future we would like to also have functionalities for registered users. We also would like to add more analysis capabilities where new layers can be easily integrated with advanced search features”. 

SPEED 2.0 Featured on NYC Open Data Week

For the first time ever, OER participated in NYC Open Data Week in early March.  For those looking for a deeper dive into SPEED 2.0, use the link below to listen to Lee’s presentation.

Contact:

Ms. Lee Ilan
Chief of Planning
NYC Mayor’s Office of Environmental Remediation
lilan@cityhall.nyc.gov

Geospatial Business Spotlight: CARTO

Company Name:                   CARTO

Location:                               New York, New York​​​​​

Website:                               www.carto.com

Employees:                          143

Established:                         2009

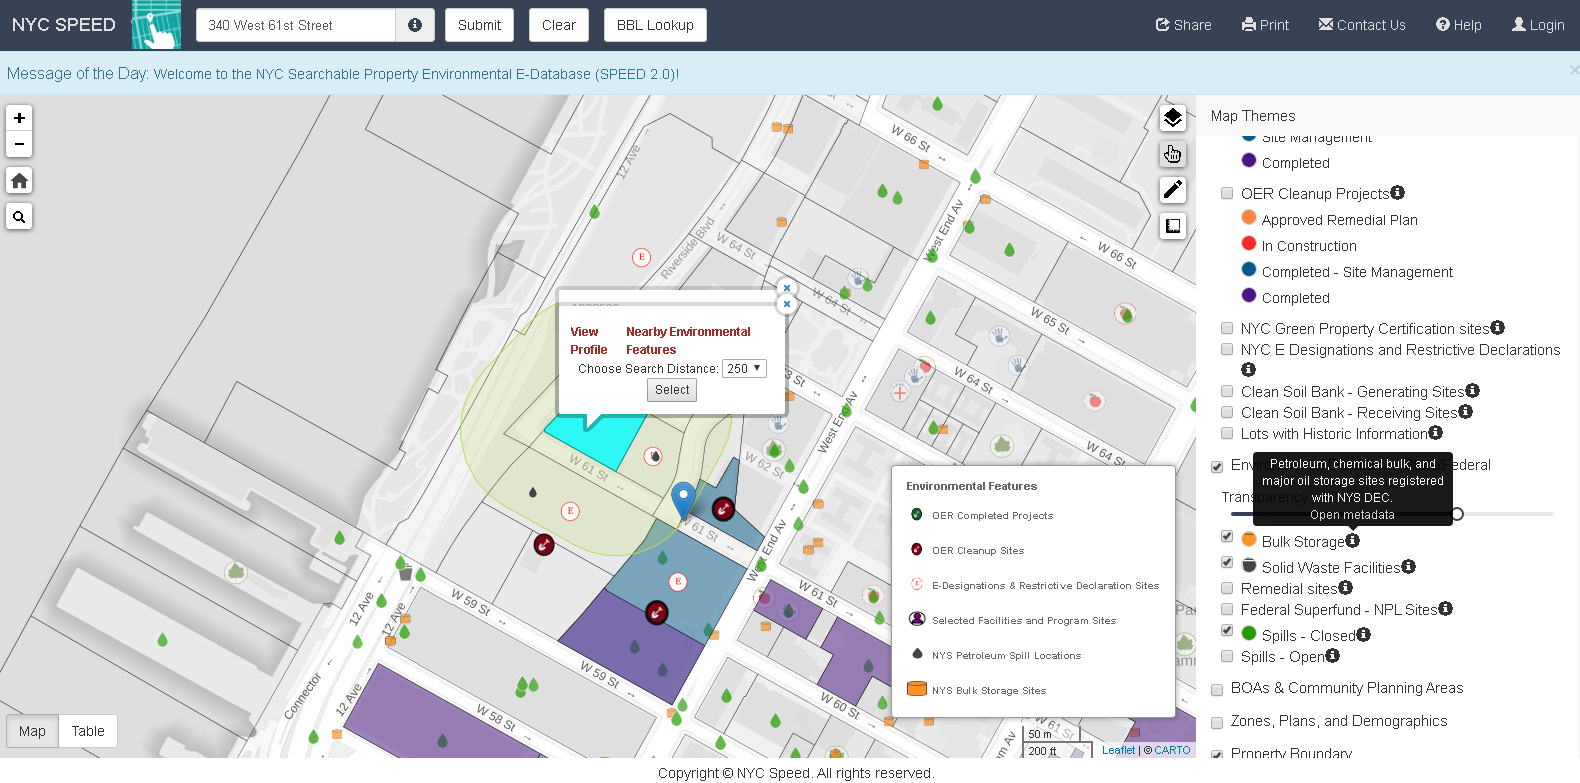
Founded by Javier de la Torre, CARTO is a diverse and expanding company which includes data scientists, geospatial analysts, cartographers, software developers and engineers, visualization experts, and web designers focusing on Location Intelligence.  Most recently in May 2019, CARTO expanded its worldwide professional service portfolio offerings by acquiring Geographica.

Providing ready to use software tools for data scientists and application developers, CARTO’s client focus is on turning location data into business outcomes, and is built around the following workflow:

  • Data Ingestion & Management
  • Data Enrichment
  • Analysis
  • Solutions & Visualization
  • Integration

Software & Capabilities

Complex analysis, filtering, and visualization are integrated in real time reducing time-to-insight.  Users can integrate CARTO’s API’s and geocoding services to complement other apps and business applications and can be integrated with custom proprietary analytical models.  CARTO can be used as an engine to visualize a wide range of data services.

CARTO is scalable and offers a Software as a Service  (SaaS) deployment model to push new features instantly allowing users to “grow as you go.” Being enterprise-ready also means making on-premise and private clouds architecture solutions available to clients.  CARTO also offers a mobile platform.

Sample Products and Applications

On October 16, 2019, CARTO hosted the 2019 Spatial Data Science Conference (SDSC) at Columbia University which I covered and reported on in a previous blog post.  Typically GeoSpatial Business Spotlight focuses on three or four applications from the firm being highlighted.  However, since SDSC was a day-long series of entirely CARTO-based applications, the conference website provides a better and more thorough overview on how CARTO is applied in business, academia, government, and nonprofit organizations.  Choose from presentations by Uber, Facebook, University of Chicago, American Securities, Salesforce Maps, and MIT among others.  In Empire State, CARTO supports numerous programs in the metropolitan New York City area in both business and government.

Contributions to the Profession 

As part of CARTO’s long-standing commitment to FOSS, Open Source, Open Data, and Open Science, the company has collaborated with many organizations providing access to next generation geospatial technology, data, and models. Most recently (October 2019), CARTO’s Javier de la Torre  joined the Urban Computing Foundation (UCF) Technical Advisory Committee which is a neutral forum for accelerating geospatial open source and community development.  The UCF operates under the umbrella of The Linux Foundation.  In July 2019, Geospatial Media and Communications included Javier de la Torre as part of the Location Analytics & Business Intelligence (LA & BI) Advisory Board.  Additional

CARTO is an open source software built on PostGIS and PostgreSQL which was first released in Beta at FOSS4G in September 2011 and officially released at Where2.0 in April 2012.  The CARTO software solution uses JavaScript extensively in front end web applications, back end Node.js based APIs, and for client libraries.

Overall, CARTO’s platform consists of the following primary components:

The CARTO platform enables users to access and manage vast amounts of data while at the same time providing numerous processes to discover, filter, and integrate local and Big Data libraries.  Geo-enabling large datasets provides a means to visualize and better understand large and complex datasets. CARTO enriches user location data with versatile, relevant datasets, such as demographics and census, and advanced algorithms, drawn from CARTO’s own Data Observatory and offered as Data as a Service (DaaS).

CARTO uses widget-driven dashboards, an array of maps, and unified workflows so that non-GIS and non-mapping users/staff can bring the power of location into the organization’s decision making.

The CARTO software user interface provides both user-friendly mapping and dashboard visuals which can be customized to user needs and experience.

Complex analysis, filtering, and visualization are integrated in real time reducing time-to-insight.  Users can integrate CARTO’s API’s and geocoding services to complement other apps and business applications and can be integrated with custom proprietary analytical models.  CARTO can be used as an engine to visualize a wide range of data services.

CARTO is scalable and offers a Software as a Service  (SaaS) deployment model to push new features instantly allowing users to “grow as you go.” Being enterprise-ready also means making on-premise and private clouds architecture solutions available to clients.  CARTO also offers a mobile platform.

Contact:

Florence Broderick
VP Marketing
flo@carto.com
4475-686-89402


Spatial Data Science Conference 2019

I had the opportunity to attend the 2019 Spatial Data Science Conference (SDSC) at Columbia University on October 16th.  Hosted by NYC-based Carto, the event was attended by over 500 people from government, nonprofits, industry and business, and academia.  The day-long conference was highlighted by a variety of presentations and lightning talks from data scientists and program managers representing organizations from around the world including Uber, Airbnb, Datarobot, Waze, Instacart, MIT, Sidewalk Labs, Two Sigma, and Facebook among others.  All of the presenters use Carto’s Software as a Service (SaaS) platform which provides GIS functionality, web mapping, and spatial data science tools.

Data Science

Founded in 2017, SDSC  brings together organizations who are pushing the boundaries of spatial data modelling – ranging from large enterprise, to cities and government, as well as thought leaders from academic institutions.  Shown through the use of geospatial applications and organizational project initiatives, there was no doubt the common denominator and focus of those attending:  Data. It was definitely worth the trip.  SDSC is similar, but a very different kind of a “geospatial conference” for those of us who have spent a career running in traditional government geospatial circles.  Attendees and presenters are largely a completely different make-up from those normally attending the annual New York State GIS conferences.  (Of the 500+ preconference registrants, nearly 55% were from the private sector).   The day’s event included high quality presentations on the latest in modelling techniques, data science and analytics, visualization practices, and new data streams.  This later issue an increasingly important and interesting one across the statewide geospatial community as the day’s conversation clearly illustrated both the growing number of online geospatial data sources  (for example, numerous references were made to U.S. Census Bureau American Community Survey) and related data access tools.  Speakers noted both the importance and benefits of open data portals though not without the caveat that it was not uncommon to have to clean and often normalize the data prior to using in applications.  Numerous references to popular sites such as GitHub, Leaflet, OpenStreetMap, and Elastic (which presented at the event) were made with regard to supporting the open source ecosystem.

Mudit Srivastav from Australia-based Origin Energy, presented on the use of spatial data to support the increase sales of residential roof top solar panels. Note the many types of data the company is using to better define growth areas.

Data for the Social Good

Another common theme throughout the day was the use of geospatial data for the social good.  Interesting to hear the point being made not only from nonprofits and academia, but from the private sector as well.  Way far away from the normal Albany GIS crowd, Stuart Lynn made a presentation focusing on how Two Sigma, an investment management firm located in New York City, provides spatial analysis support through the company’s Data Clinic program to nonprofits, academic institutions, and government organizations.  Their focus:  Enabling and promoting social impact through data driven predictive models while funding breakthrough research, education and a wide range of charities and foundations.    The image below identifies some of their recent projects.  Great stuff and I’m already planning on a more in-depth article with Stuart in the future.

Enabling Social Impact Organizations with Spatial Analysis Techniques

Stuart’s talk, as well as others during the day, made reference to the  The Data for Good movement which was a social media movement first started by DataKind to highlight how data science could be used to help address a range of humanitarian issues. DataKind is a collaborative network of organizations that work together with data scientists to leverage the science of data for social impact.  DataKind’s afternoon presentation “Spatial Data Science for Social Good:  Improving Access to Dignified Sanitation in Haiti” was excellent.  The video for this session and all of the day’s presentations are now available online at the Spatial Data Science Conference website.

Arguably, the demand for “data scientists” will increasingly intersect and expand in government geospatial programs in areas such as the health and human services, climate change, public safety, sustainability and resiliency,  and social and environmental justice to name only a few.   As the universe of geospatial data continues to expand and be integrated with both new artificial intelligence (AI) and machine reading technologies, as well as combined with the availability of more powerful GIS software, it is easy to see where the demand for data scientists focusing on locational and predictive analytics is headed.

I asked Javier de la Torre, Carto founder and SDSC organizer, what his impressions were of the day’s presentations and content.  He replied:

“First, moving the data discussion from WHERE to Why. Time to move to analyzing data using maps opposed to just seeing data in maps.  Second, the rise of the Spatial Data Scientist and/or where advance GIS is emerging as a new platform. And third, identifying the need for better data marketplaces which provides interactive solutions resulting in increased performance to users”

Links to the 2017 and 2018 presentations are also available on the SDSC website.