Expanding Suite of Online Portals Offer Data For All Types of GIS Users
Ever since the federal government launched Data.gov in May 2009 and President Barack Obama issuing an executive order in May 2013 establishing the Open Data Policy, as well as Governor Andrew M. Cuomo signing Executive Order 95 (“Using Technology to Promote Transparency, Improve Government Performance and Enhance Citizen Engagement”) in March of the same year, governments at all levels across the country have responded in creating an array of online data portals with the intent of making data free and easily accessible. Available and open to everyone including nonprofits, application developers, researchers and academia, business and industry, service industries, the geospatial community and everything in-between. Such portals purpose and intent is to promote government transparency, reduce data request and distribution costs, fuel business development and job growth, and drive innovation. Open data portals are particularly useful in times of crisis or major incident when multiple agencies require access to the same data and/or may be limited in context of data sharing agreements either ad hoc or formal.
Current Empire State Data Portal Offerings
Today, geospatial data portals across the Empire State have a variety of aliases including Open, Gateway, Hub, even the old school Clearinghouse title. For the purpose of this article we’ll take a look at a range of the current publically available sites focusing on current content and some of the general functionality as it relates to the GIS/geospatial user. Sites included are those currently available in New York City, state government, and at the county and municipal. It is by no means inclusive of all the sites across the state though for the ones itemized below, take a drive and see what you find.
Map Services vs. Files
Accessing, or consuming, geospatial content has changed significantly since the early years of data sharing. The term “open data” was barely in the geospatial vernacular in old school GIS with many sites providing access to data which was governed by formal data sharing agreements and/or requiring some kind of organizational membership. Offering file-based downloads to support, which at the time, was a heavy-client software-based world of GIS computing.
While file-based downloads from the myriad of portals across the Empire State are more than adequate for most users of the sites, GIS/geospatial users often have software enhanced capabilities to consume large volumes of data content in both client and browser applications via map services. Consuming web services is now even an option within certain versions of AutoCAD which greatly expands the use of government authored and published geospatial content.
Given the option of having to take the time to download numerous individual files vs. consuming one map service with many data layers and picking only the data layers needed – the choice is often pretty obvious. As such, data portals which offer geospatial content as a service (or by extension developer tools to provide similar functionality) increasingly have added value to the GIS/geospatial user.
New York State Government
HEALTH.DATA.NY.GOV & DATA.NY.GOV
Launched approximately around the same time in 2013, these two portals provide lots of file based content for the GIS/geospatial community. Built on top of Socrata software (Tyler Technologies) the two sites differ only in content. DATA.NY.GOV serving more as a generalized repository for state agencies (and selected local governments) and HEALTH.DATA.NY.GOV focusing specifically on public health related datasets. Creating an user account (if needed) provides developers and publishers to identical tools and documentation to each site including customization options, database connections and API endpoints, metadata documentation, visualization tools, and more.. Both portals as part of the broader Open NY initiative.
While centralized data access and data visualization (charts, dashboards, etc) have always been a primary Socrata focus, the software also includes a basic toolkit to map and render datasets which include coordinate geometry. Both sites also include the ability to download datasets in a variety of formats including KML, KMZ, Shapefile, and GeoJSON which can be used by a wide range of GIS software platforms.
Users of DATA.NY.GOV site need to be aware this site ALSO includes content from other statewide Socrata sites (HEALTH.DATA.NY.GOV, NYC Open Data, and Open Data Buffalo) so it is important to use the filtering function in the lower left corner of the page after the initial data theme/category has been selected. For example, in the image below, after selecting the “Transportation” category, the application returns 521 records – which includes those meeting the same criteria from the other three statewide Socrata sites. (And in this category many from the NYC Socrata library.) After filtering for “This site only” (DATA.NY.GOV) the application returns just 251 records. A small nuance but filtering does help if the search is specific to certain jurisdictional or geographic footprints. Also, when searching for state agency data across the available statewide portals, users will begin to see that some agency data is published and available on more than one portal. For example, some state agency data can be found on DATA.NY.GOV, CUGIR, and the state Clearinghouse.
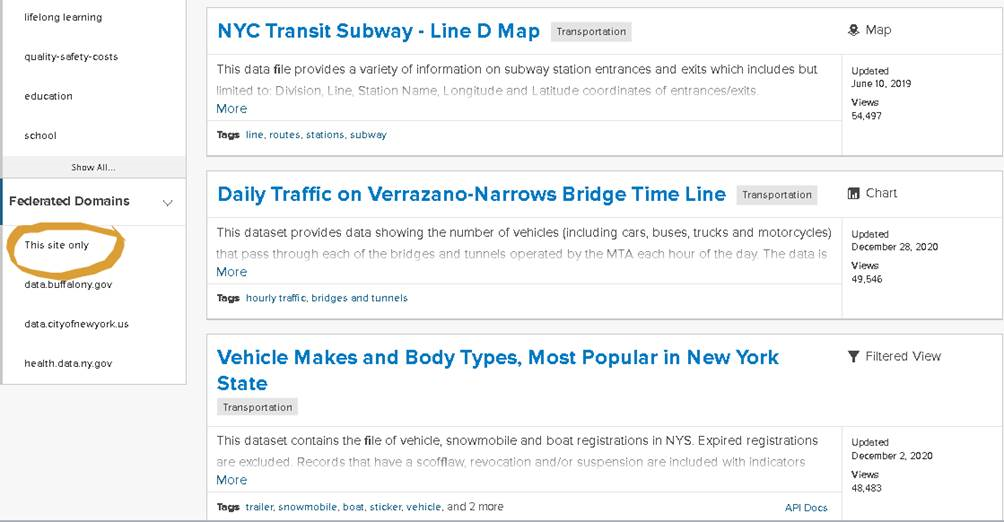
The filtering function on DATA.NY.GOV limits the search to specific domains
Plenty of geospatial data in both of these state portals albeit as the GIS community has come to know during the COVID-19 pandemic, address or large scale data is hard come by in the public health space. Respectfully a whole other discussion and until there are fundamental changes in how public health data is published, it will be difficult for non-public health agencies, advocacy groups, or the general public to access such data at units of geography smaller than the county level. Or sometimes if one is lucky, finding some at the zip code level.
For additional information on how to export Socrata data to other formats and/or platforms see this help document. Also, Koop software is an Open Geospatial ETL Engine which enables users to leave geospatial data where it lives and transform it into a variety of formats including GeoJSON, CSV, KML, a Shapefile, or Feature Service dynamically.
There is apparently ongoing work/research within the state GIS offices with regard to both mapping NY Open data using the Socrata JavaScript API as well as enabling the Socrata platform to use the NYS GIS Program Office geocoder. If successful, such efforts will greatly expand the Socrata data portals for the geospatial community.
NY Department of State Geographic Information Gateway

Launched in 2015, the Gateway is administered out of the NY Department of State, Office of Planning, Development and Community Infrastructure and is now home to over 700 datasets. The Gateway is an online mapping application that makes it possible to view geographic information in its native viewer or Google Earth and users can also download information in multiple file formats or even pull into other online mapping applications. While the original geographic footprint of the Gateway focused on New York’s offshore planning area in the ocean and State’s portion of the Great Lakes, the repository now contains a wide range of geospatial datasets covering the entire State.
The Gateway has datasets grouped thematically and made available as map services. All content includes accompanying metadata enabling users to identify which data layers to select and easily consume from within the composite map service. Perfect for desktop or web client mash-ups and analysis. The site also includes links, integration, and content with crowdsourced apps.
The Gateway is a must see site having itself apart from other NYS departments in context of building a geospatial data portal with so much functionality and content. There is a good chance you’ll find content for your GIS project here.
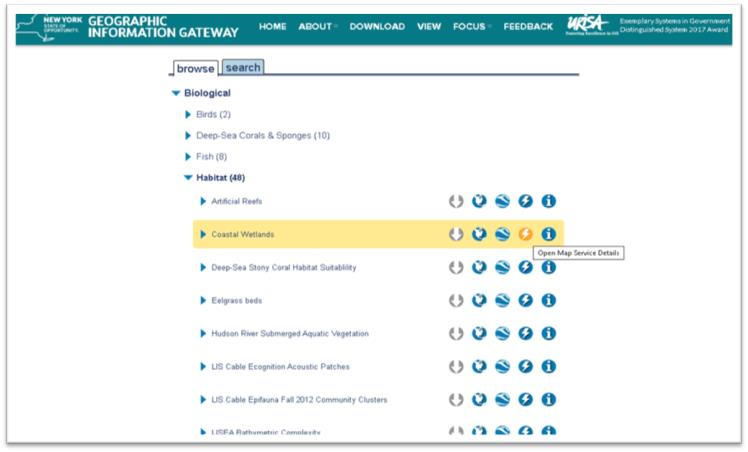
The Gateway data browser has icons for actions that can be taken with desired datasets; download, view in native map viewer, export to Google Earth, information for ingesting as a map service and metadata.
NYS GIS Clearinghouse

The Clearinghouse was originally implemented in the late 1990s to facilitate statewide data sharing. For many years it was the defacto #1 portal for all things/files GIS. The focus being based on formal/written data sharing agreements between government and non-profit organizations. Amazingly in 2021 these agreements are still part of the Clearinghouse administrative structure though it does not get in the way of non-data sharing members – even those from industry and business – from downloading many datasets. Give credit to those individuals who helped create the original Clearinghouse as it was one of the first of its kind at the time.
Much has changed since the Clearinghouse was initially launched which has impacted the data component of the site. Time itself, and in this case decades, has proven to be a major challenge. Publishers have come and gone, numerous retirements and point of contacts no longer exist, and limited metadata and datasets being out-of-date. It’s a next to impossible to manage and keep most of the data files up-to-date and uniquely different in portals like the Clearinghouse. Given the new generation of geospatial data portals that we should expect to continue to emerge (particularly at the local level), the relevancy gap of the Clearinghouse’s data file inventory will likely continue to widen. To say the least of the role of other similar data and web services available online via other free government and business sites such as The National Map, EPA Envirofacts, and ESRI’s Living Atlas.
The upside is the Clearinghouse is emphasizing and pushing data content as web services having placed this “option” at the top of the data catalog list. Seemingly to encourage users to “try this first” before sitting down and mining through the catalog on a file-by-file basis. Much of the web service content are from the go-to State GIS office program areas (imagery, elevation, addresses, geocoding services, and to a limited degree tax parcels) albeit other state agencies are contributing services as well. Kudos to the state agencies are keeping their individual file catalogs up-to-date and current albeit as earlier mentioned some of these state agencies are placing data on multiple portals requiring users to search in more than one location.
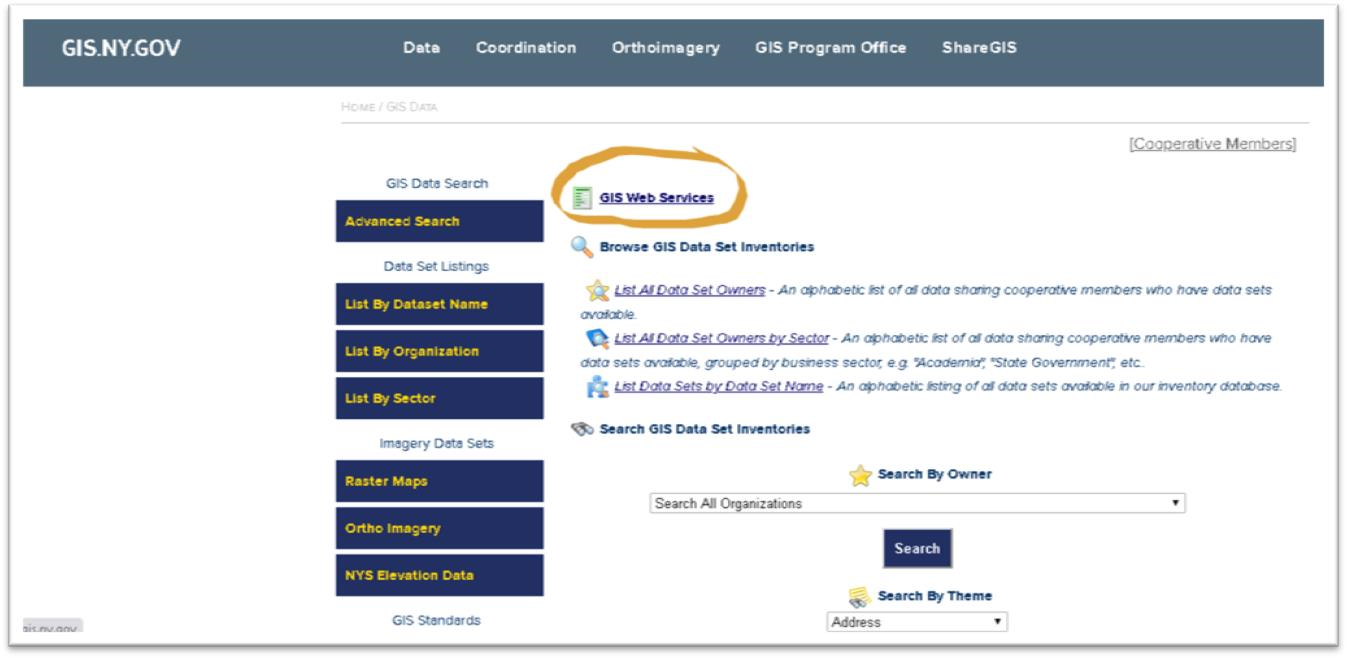
Instead of performing file based searches, users can access content via map services from a variety of state agencies
Hopefully, the legal shackles of the Clearinghouse data sharing agreement – instituted in the previous century – alone do not continue to influence the long term focus of the Clearinghouse with regard to managing and publishing individual datasets. One day, the statewide geospatial community would probably be better served when all of the remaining relevant Clearinghouse datasets are consolidated into DATA.NY.US or CUGIR. And perhaps leave the Clearinghouse to focus just on publishing data as a service with the current capacity it has built.
Municipal Government
NYC Open Data

Another Socrata site, NYC Open Data is the big kid in the statewide open data sandbox with over 3,000 datasets grouped into just five categories available from nearly 100 reporting NYC departments. In addition to just datasets, the site also includes files, documents, and external links. So, if you are looking for geospatial data for the NYC geographic footprint this is the place to go. The site has been around for several years already and is the creation of the Mayor’s Office of Data Analytics (MODA) and the Department of Information Technology and Telecommunications (DoITT). As a hub of analytics in the City, MODA advocates for the use of Open Data in citywide data analytics and in the community.
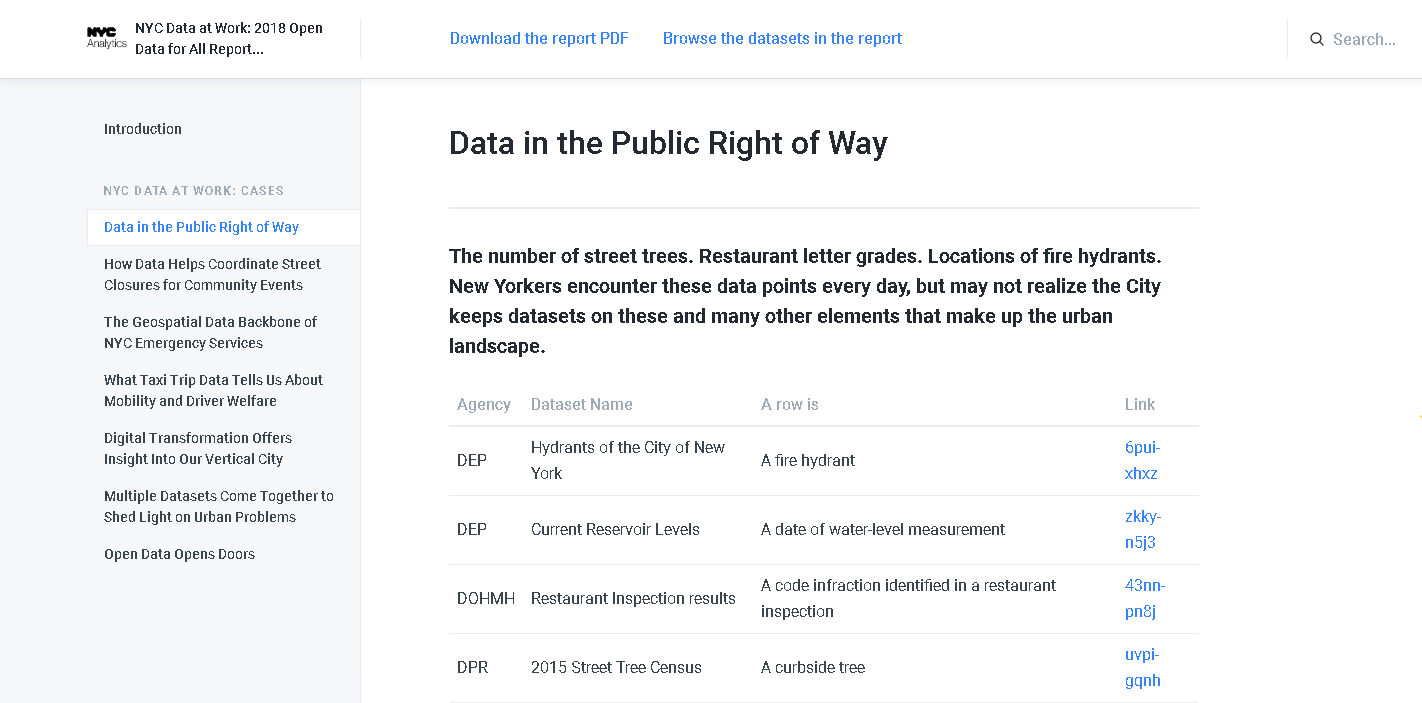
The NYC Open Data Portal also provides excellent narratives and examples of how geospatial data is used and is critical to the operations of city government.
NYC Open Data exemplifies the use of open data giving rise to a broad user community including organizations such as BetaNYC which hosts events such as the NYC School of Data, Open Data Journeys, various Open Data Classes, and in concert with the Mayor’s Office, the signature NYC Open Data Week – this year March 6 – 14. And data from the portal is routinely used in the NYC BigApps competition.
To fully appreciate how far open data has come in NYC, take a look at the list of publications and reports on this web page which chronicles its growth over the past several years. And if you need further convincing, take a look at the NYC Open Data Project Gallery.
Go to the site and drive around. Its worth the ride.
City of Rochester (DataROC)
Cities are great units of geography to build data portals in that their governments often oversee management of all the geographic features and data within the municipal boundary footprint. Albeit this does vary on occasion with regard to utilities and some infrastructure Geospatial data is consistent at the city level as government business applications are built and deployed to capture data to the same geographic extent. As city applications continue to be geo-enabled, and open data initiatives are initiated, this geofencing of the data provides a consistent geographic extent and a great framework to support a geospatial data portal.
DataROC was launched in 2020 and due to the city’s long time relationship with ESRI and staff who are statisticians and/or business intelligence analysts. “ESRI’s open data framework was a good fit for the city” according to Kate Day, Chief Performance Officer, Mayor’s Office of Data Analytics & Performance. Prior to the rollout of DataROC, the city already had both a police data portal and a map gallery of different ESRI tools, so the first major part of DataROC was to bring previously decentralized content together and make it easy to search. GIS staff in the city’s IT department assisted as change champions to make sure that the wider GIS community spread out across the City were aware of what the focus of the portal was to be and drive more traffic to the work analysts in various department had done over the years. Currently there are 203 items in the city’s open data catalog containing data files, apps, maps, documents. If you need geospatial data for a project inside the Rochester footprint, this is the portal to visit and search for data.
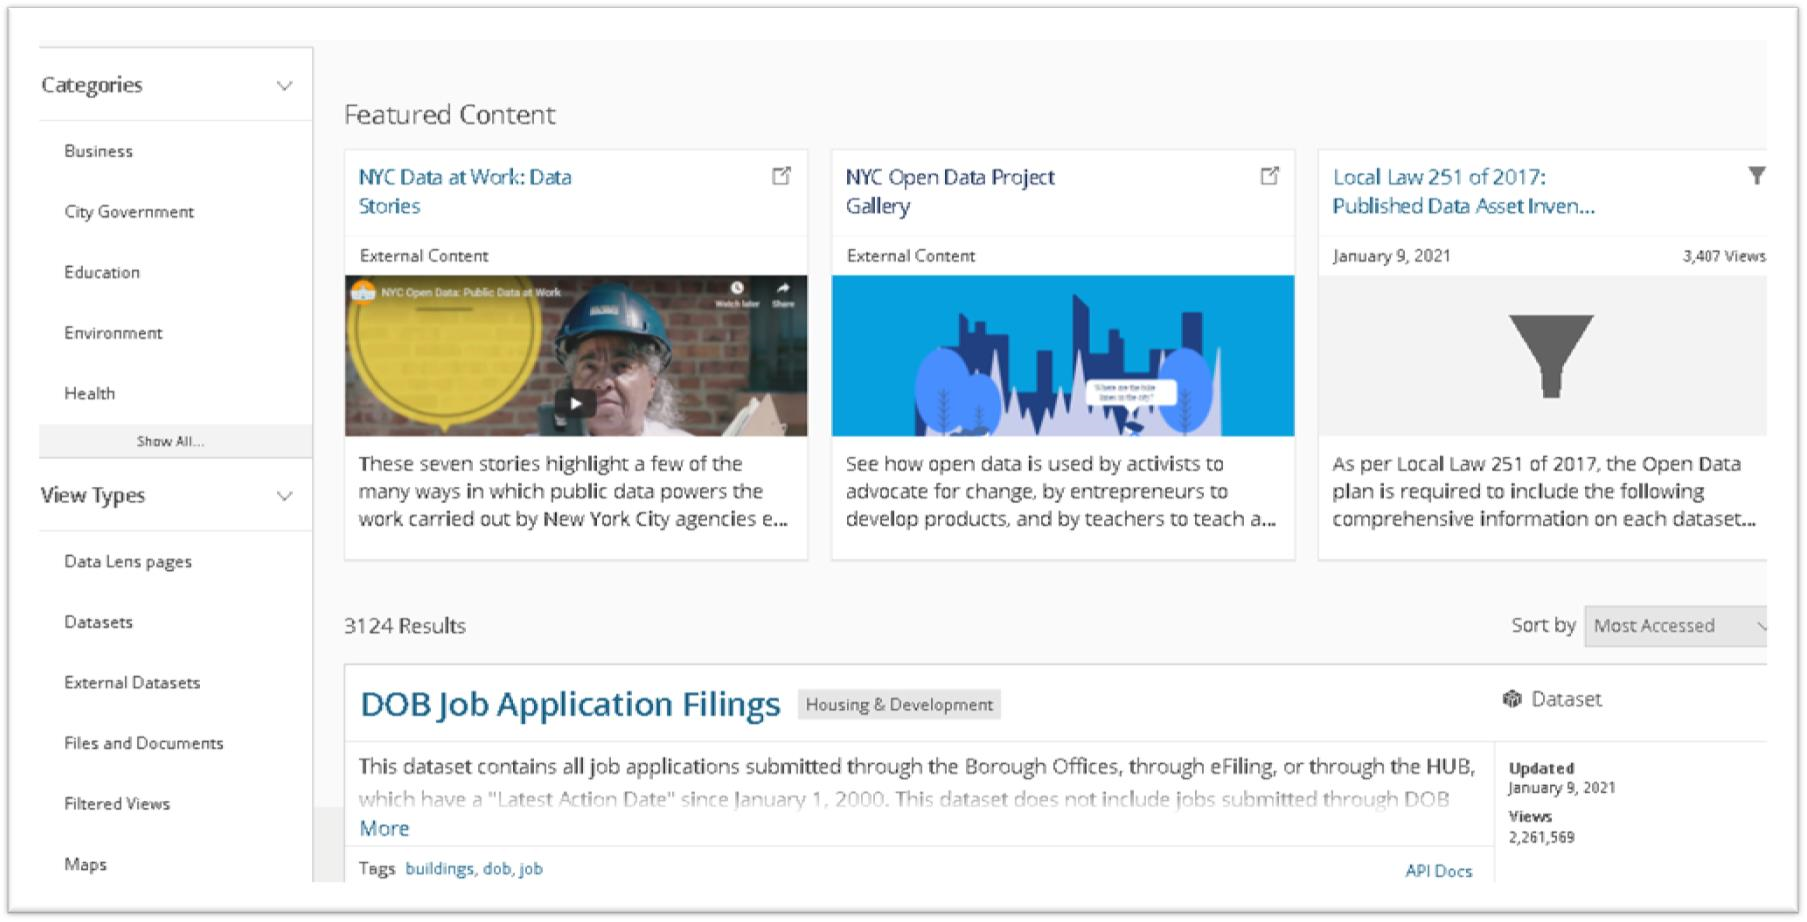
DataROC offers easy access to data, applications that feature maps curated for a specific purpose, featuring up-to-date data, and a gallery of web maps to get around the city
With regard to an “example” as how specific governments vet data to their portals, the City of Rochester “publishes anything that is classified as public data / documents / applications that have been requested to be published by an internal or external stakeholder, but only after they have been approved by a Data Governance Committee”. This committee ensures each dataset is truly for public consumption (essentially that it poses no individual or group harm for being published, that it would not violate any law/regulation to publish, and that the dataset meets quality standards to accurately represent whatever subject is being depicted or summarized).
Other illustrative statewide local government data portals include the City of Buffalo (Open Data Buffalo), City of Albany (openAlbany), Westchester County (GeoHub), and City of Syracuse (DataCuse).
Academic
Cornell University Geospatial Information Repository (CUGIR)
I’ve always been a huge fan of the CUGIR portal and related program offerings. Housed in academia and on the fringe of the statewide GIS mainstream, its original homegrown portal was built and developed in Java in the 1990s. The current CUGIR portal was launched in January 2018 and is is built on several modern open-source components. The front-end interface uses GeoBlacklight — https://geoblacklight.org/ which is a collaborative project being developed by several universities, including NYU, Minnesota, Stanford, Princeton, UC Berkeley, Cornell, and others. CUGIR has made various customizations, some of which have been incorporated back to the project.
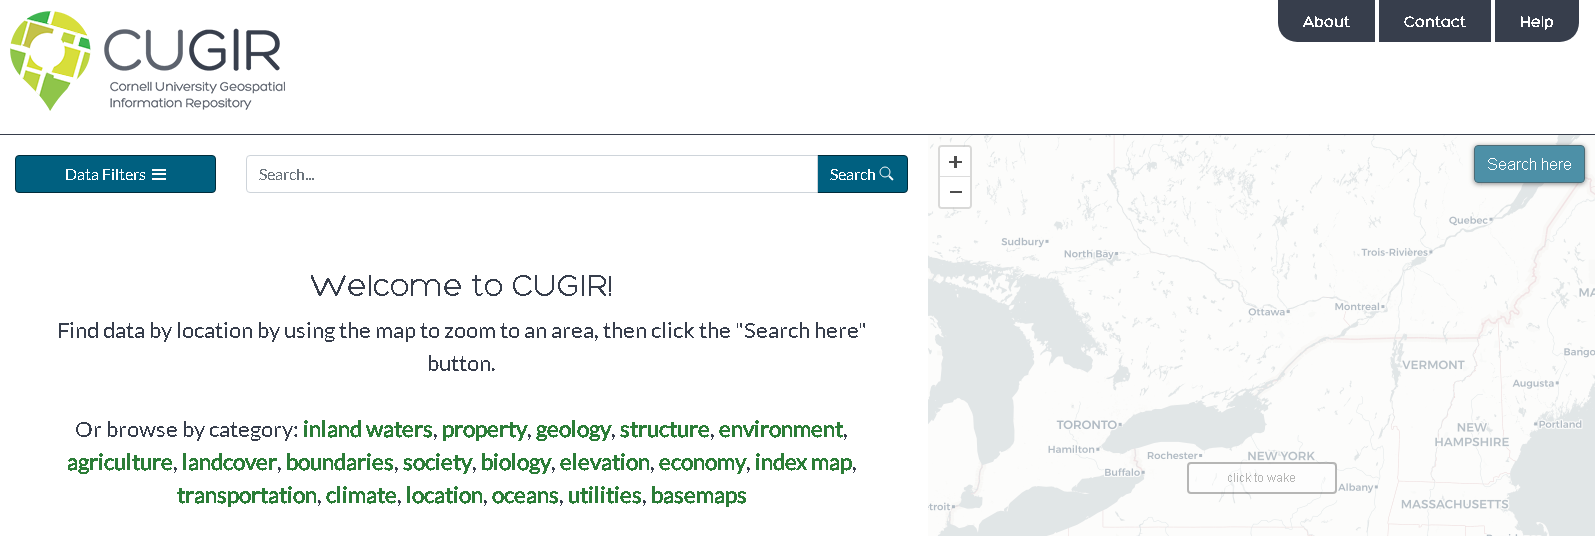
Subjects such as landforms and topography, soils, hydrology, environmental hazards, agricultural activities, wildlife and natural resource management are included in the CUGIR catalog. All data files are cataloged in accordance with FGDC standards and made available in widely used geospatial data formats.
Behind the scenes, CUGIR uses Solr for searching and faceting (also known as “data filters”). The site use GeoServer to access copies of the data in a PostGIS database to generate map previews via publically-accessible WMS/WFS web services for each dataset. Amazon S3 is used to host all the downloadable data as pre-generated zipfiles, so downloads are quick and reliable. The site uses Leaflet to display the map on top of a CARTO basemap (which is built from OpenStreetMap data the web viewer. Maintaining and supporting the site is long-time CUGIR GIS front man, Keith Jenkins.
Today, CUGIR’s datasets total about 15GB. The total number of “datasets” listed in the catalog is currently 458, which appears much smaller than the nearly 8000 it used to be because in the old system CUGIR had content split up into many smaller downloads to accommodate the bandwidth limitations of the late 1990s and early 2000s. So to leverage newer technologies and internet speeds, several data series were merged into statewide datasets. As part of the process, CUGIR also converted old formats like ArcInfo Interchange (.e00) files to shapefiles wherever possible. As part of the site upgrade, old links which had bookmarked or published were updated as well. Today, NYS DEC and USDA NRCS have the most CUGIR records with other large catalogs from NYS Department of Agriculture and Markets and Cornell Institute for Resource Information Sciences (IRIS). Data is also available from nearby Tompkins County GIS. Excellent filtering tools enable users to search data by several different categories and download datasets in Shapefile, PDF, or KML format and export to either KMZ or GeoJSON.
CUGIR focuses exclusively on geospatial data which sets it apart from other general sites like DATA.NY.GOV. The NYS GIS Clearinghouse and the NYS Geographic Information Gateway are more similar to CUGIR with each having their own unique datasets which in some instances can be confusing for someone looking for data and not sure where to look. Additional CUGIR functionality includes pointing to and maintaining an index map to external datasets such as the National Elevation Dataset (NED). Jenkins and his CUGIR team hope to build out similar functionality and integration with other Empire State geospatial portals in the future.
Like this:
Like Loading...
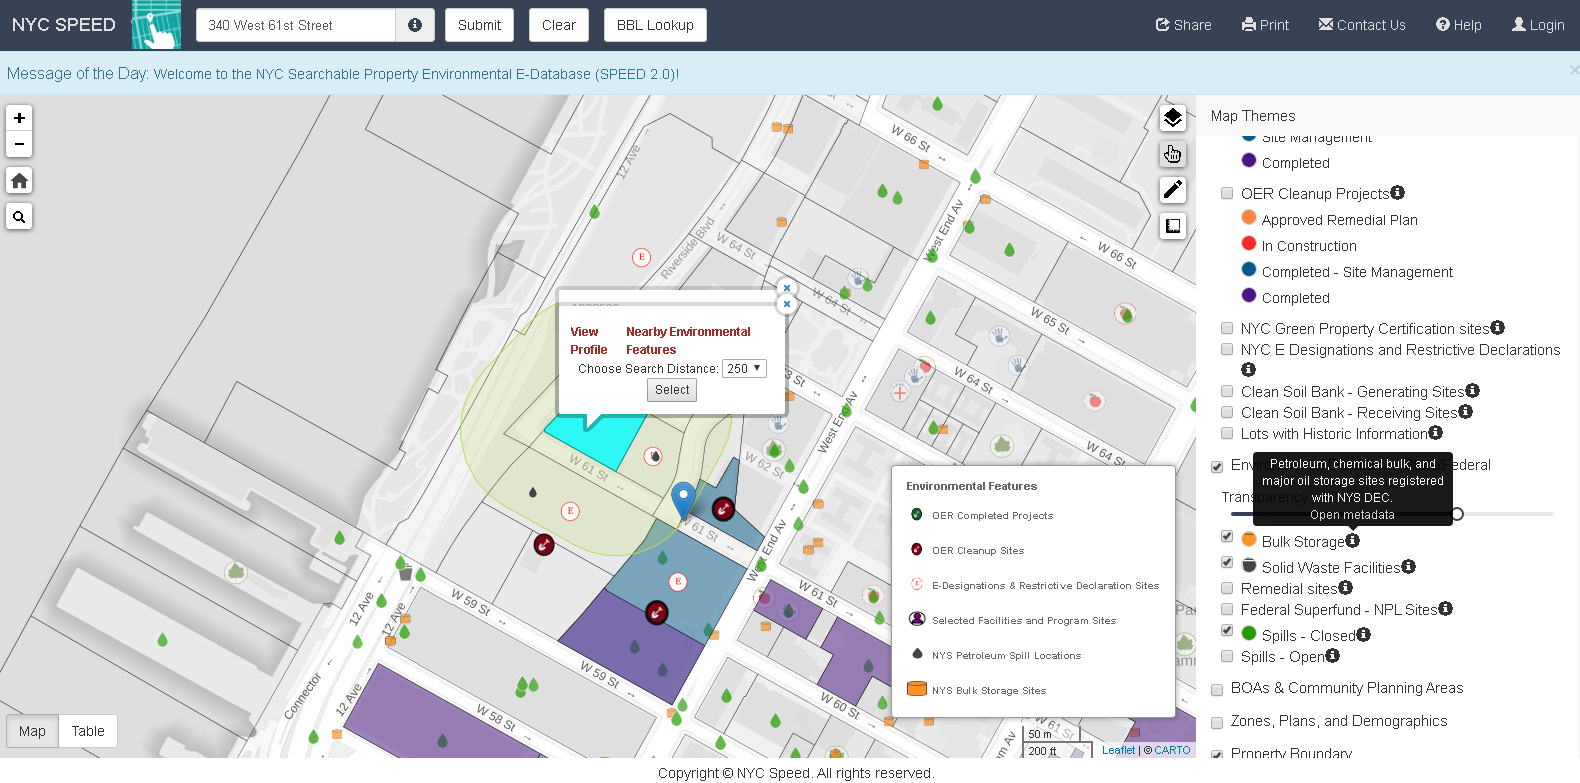
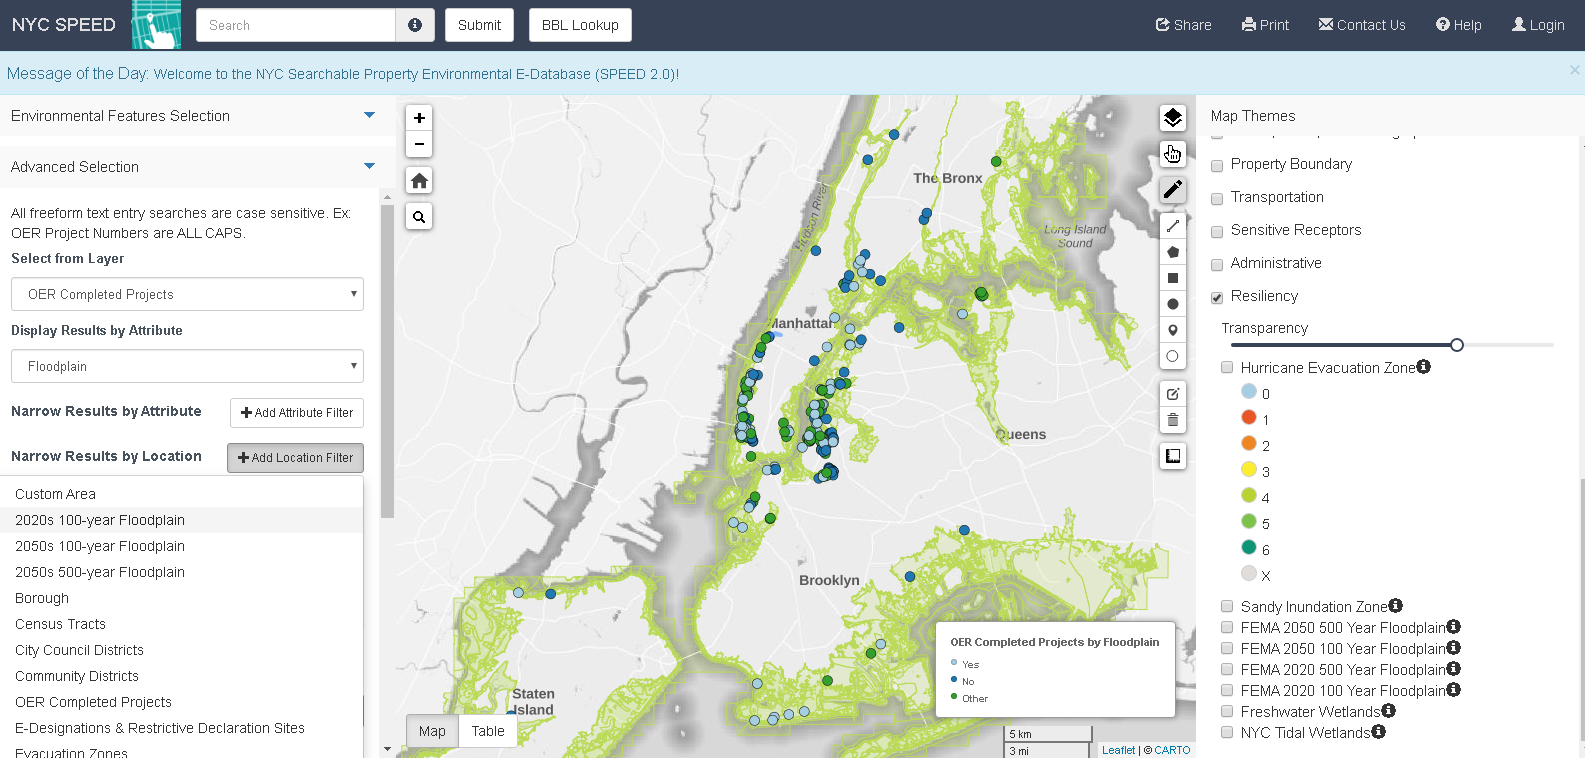
 A lot of great geospatial projects and content are coming out of the NYC OpenData ecosystem. In the same space throughout the city is the deployment of applications and viewers using open source software. One such app is the Searchable Property Environmental E-Database SPEED 2.0, built on top of CARTO and published by the Mayor’s Office of Environmental Remediation (OER). I was introduced to the application via an online presentation organized by GISMO in March of this year.