Campus Planning and Geospatial Technologies at UAlbany

GIS used in many areas alongside engineering and architectural applications

College and university campuses are the home for a vast amount of geospatial data covering both the natural and built environments.  Whereas at the beginning of geospatial era there was a clear and defined digital divide – GIS vs. CAD –  today these technologies have evolved to be used and managed together almost seamlessly.  In this space since the early 2000’s we’ve seen the evolution of the Building Information Model (BIM) in along with drone, GPS, and laser scanning technologies serving as a means to capture and generate additional types of geospatial data both indoor and outdoor.  GIS concepts are also important elements integrated into Enterprise Asset Management (EAM), Computer-Aided Facilities Management (CAFM) and Computerized Maintenance Management System (CMMS) solutions.

Built around the geospatial framework which also includes standards for both data collection and data management, GIS applications in campus settings are leveraged by both GIS specialists and engineers alike.  Common program areas include covering areas such as master plan support, space programming, work order management, asset management, emergency management, real estate and portfolio management, environmental and regulatory compliance, and site selection studies among others.

While traditional GIS and engineering software applications such as ArcGIS and AutoCAD support much of the outdoor mapping, facility managers increasingly use a more indoor specific software programs such as Revit, Autodesk BIM 360 Ops, Cartegraph, and ESRI’s relatively new entry into this space ArcGIS Indoors, among others.   In reality, automated systems at large facilities involve a combination of the programs noted above and often also integrate other monitoring and SCADA systems.   If you are new to GIS and geospatial applications to the campus setting, here is a good overview presentation.

Campus Planning at UAlbany

Many of these geospatial-related disciplines intersect directly – and indirectly-  in the Office of Campus Planning at UAlbany which is charged with the overall planning of physical space on campus (indoor and outdoor), capital and operating funding, and supporting the strategic plan of the University.   The office currently has a team of eight which includes Jessie Pellerin who serves as GIS and Signage and Wayfinding Manager.

Jessie is involved with several elements of GIS data collection and cartographic products associated with the UAlbany facilities for the uptown, downtown, and Alumni Quad campuses – including the production of hardcopy maps which are still an important communications and outreach component for visitors and students new to campus.   Nearly all of her day-to-day work is done with ArcGIS Pro.  Field data collection is normally supported with Collector for ArcGIS on an iPad and for offline viewing.

Jessie produces all of the UAlbany maps using just ArcGIS Pro without the use or addition of any desktop publishing software

With regard to above and underground features on, the 500-acre uptown camps, she helps manage a GIS database which includes 122 emergency blue light phone locations, 16.5 miles of storm sewer pipes and 760 catch basin, 6.4 miles of sanitary sewer pipes, 1500 light poles and 12 miles of roads among dozens of other features. Jessie also oversees individual data collection projects conducted by vendors such as the campus wide light poles and irrigation system.   She serves as the ArcGIS Online Administrator for the Office supporting and maintaining several customized viewers for 50 staff across campus in specific work program areas.
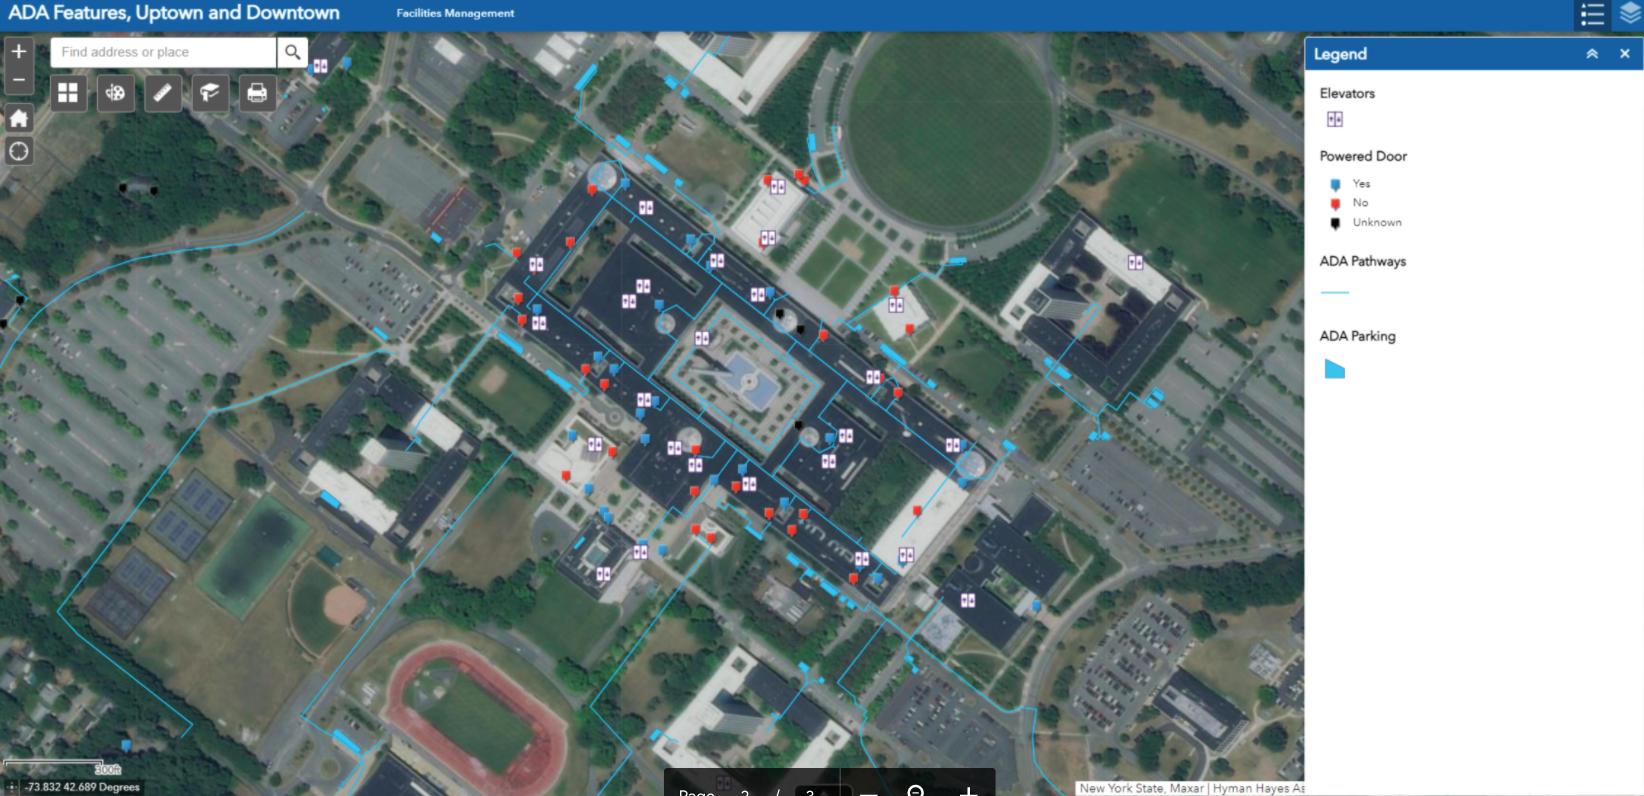
One of internal AGOL viewers Ms. Pellerin supports focuses on the locations of accessibility features on the Uptown and Downtown Campus. Pop-ups include more information for each feature. Data was developed from a campus-wide accessibility study.
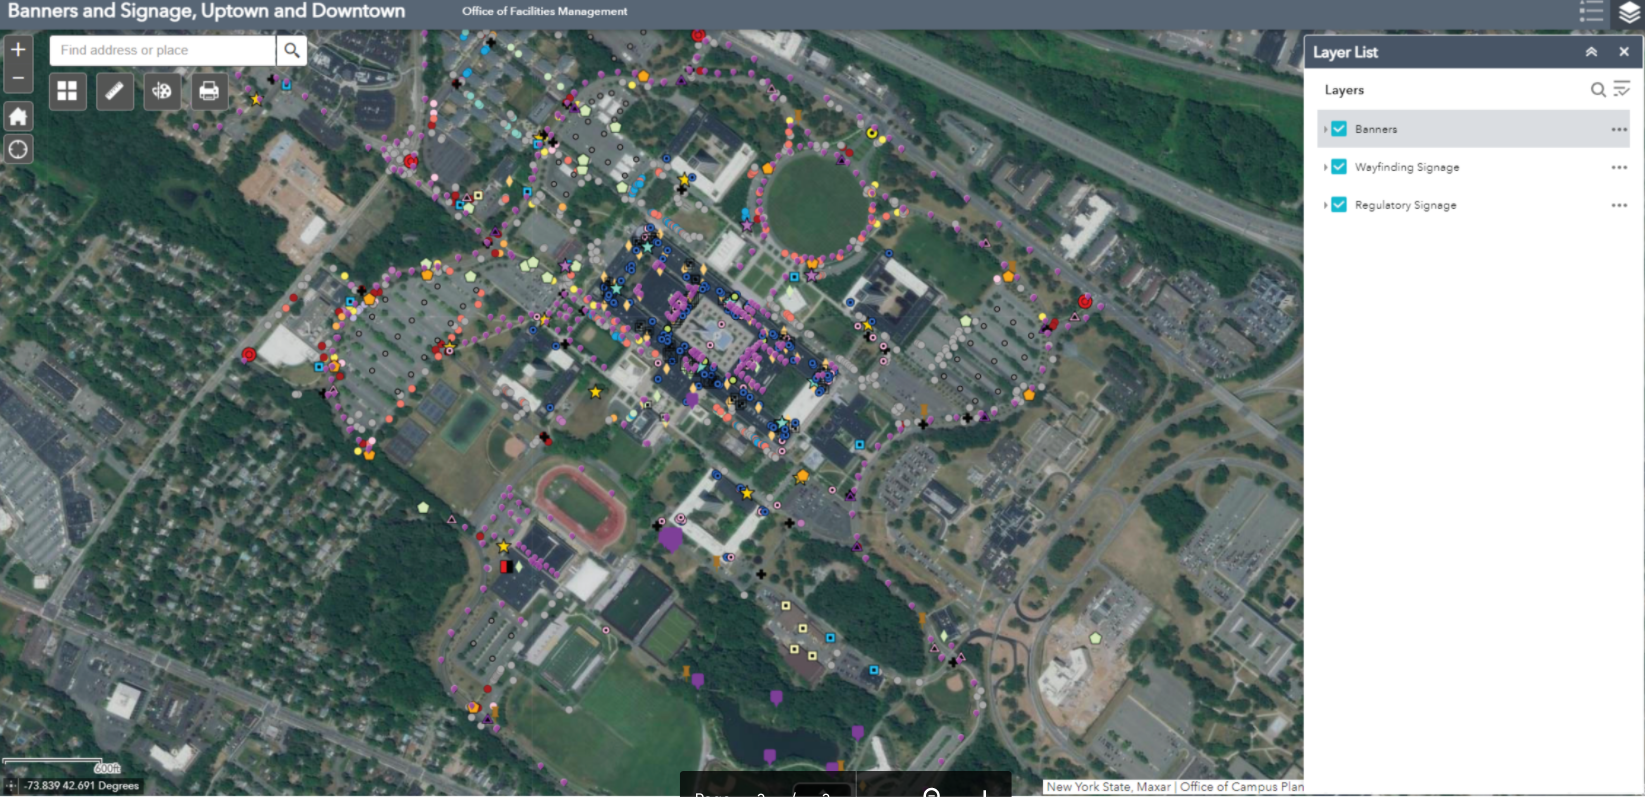
Another viewer shows the location of the exterior wayfinding and regulatory signage and banners on campus. With over 500 exterior wayfinding signs, 750 regulatory signs, and 550 banners, GIS has been essential in keeping track of sign content and condition for aiding in preventative maintenance, site planning, and branding initiatives. Both of the above viewers were built with Web App Builder.
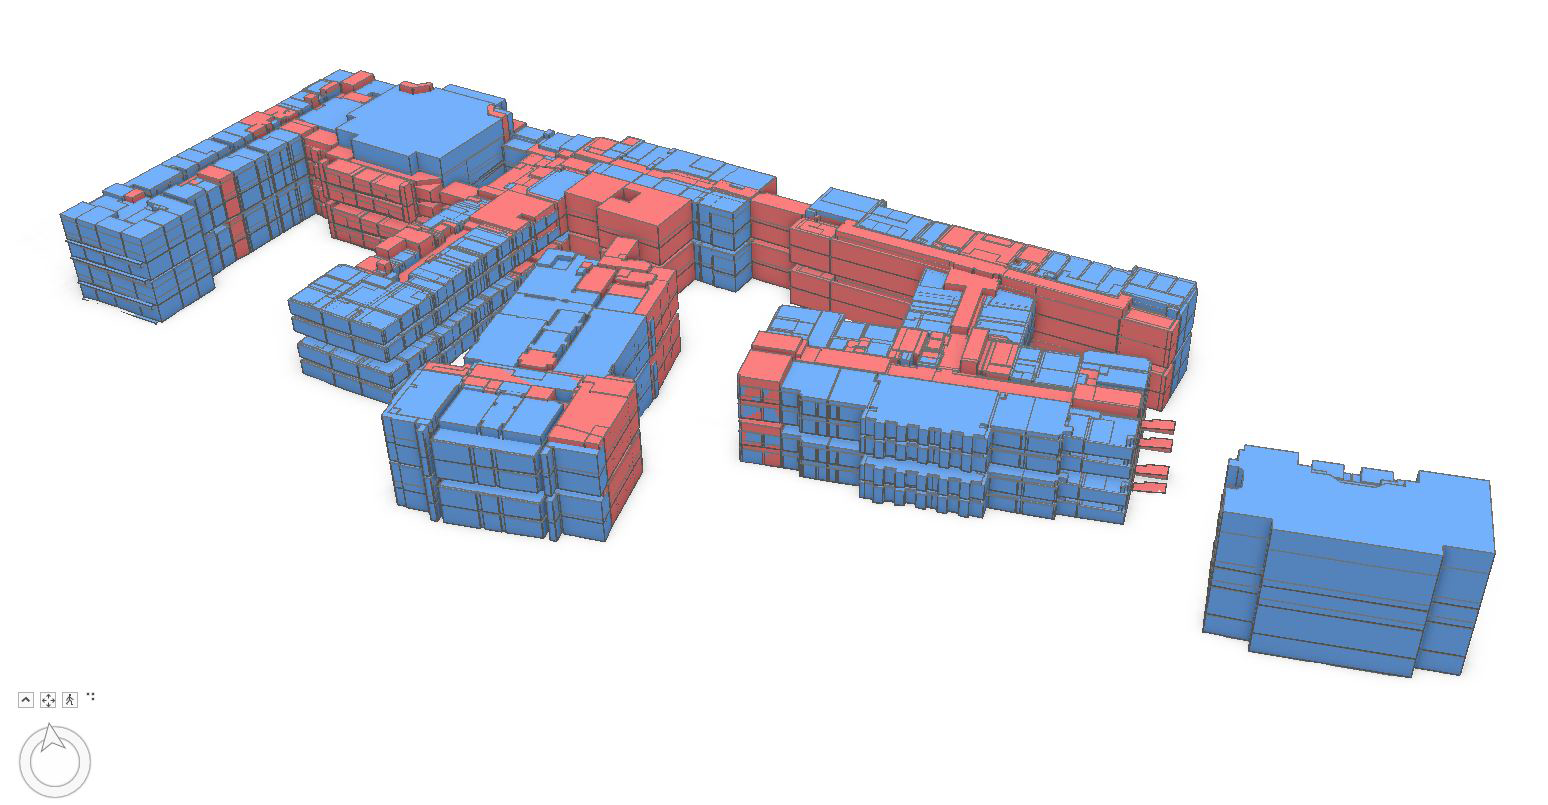
An example of how space planning is supported using GIS at UAlbany. This graphic shows a 3D visualization of assignable space on the Downtown Campus

As part of supporting the university’s COVID-19 response, Jessie assisted with others by using combining mapped sewer line and manhole data with the occupancy count of each of the residential dorms, to determine the optimal locations for the waste water testing sites in 2020. There ended up being six manholes selected (out of the 282 on campus). Maps were shared with other stakeholders in the project.    

As it relates to campus settings, GIS use is growing and being used more often in buildings and facilities planning by campus staff” notes Stu Rich, Director, Buildings and Infrastructure at Cartegraph.  Initially, as outdoor GIS concepts and technology were beginning to be applied to the indoor environments, cost was often a barrier to get started in building BIM and interior models for many organizations.  “Those barriers are beginning to change” Rich further adds, “While precision indoor mapping will always require higher-end instrumentation, recent products such as MagicPlan and IndoorVu, as well as falling software prices, are making interior mapping and data capture more affordable for large facilities management programs.   All of these products and technologies are now broadly used in facilities management and integrated with GIS applications.”

Recognizing the importance and growth of using digital data both in-house and with the numerous engineering companies performing work on campus, both the Office of Campus Planning and the Office of Architecture, Engineering, & Construction Management (AECM) have developed digital data standards for BIM, GIS, and AutoCAD.

Summary

Large campus facilities such as SUNY Albany bring together the intersection of several geospatial technologies.  Individually each seemingly used or applied for one specific purpose (and often at varying levels of spatial accuracy) but when mashed together in a just web viewer, provide easy access to a wide range of authoritative digital content for decision-makers. Sure signs of the growing maturity and acceptance of geospatial technologies.

Contact:

Ms. Jessie L. Pellerin
GIS and Signage and Wayfinding Manager
Office of Campus Planning
University at Albany, State University of New York
jpellerin@albany.edu

Google Earth in the Classrooms

Chromebooks, Google Classroom and Google Earth Together Provide a Framework for Teaching Geography and many other subjects in K-12

I actually started drafting an article on Google Earth in the classroom last fall but since then it’s been one thing or another pushing things to the back burner.  Mostly work priorities but then COVID-19 sent everything sideways.  Seemingly pointing us all in a new and uncharted direction.  A new and greater reliance on the internet as many of us found ourselves working remotely.

The remote work force in many of our extended families includes teachers of whom I now have even greater respect after watching what is involved in teaching remotely and online.  The lesson plans, prep work, surgically attached to the computer, and the seemingly endless hours of the encompassing interaction with students – and parents – well beyond the normal eight-hour work day.

In a roundabout way watching this teaching workflow unfold during the COVID lockdown brought me back to the Google Earth article.  Google’s presence in the classroom is ubiquitous built around Google Classroom which I can only imagine will grow immensely as remote K-12 education expands in the future.  Wrapped in with kabillons of lesson plans, templates, covering every education topic, discussion groups, forums, and blogs from around the world – everything built on top of Google technology.  Easily delivered and made available to the masses at all levels of the educational spectrum with the uber cheap and incredibly functional Google Chomebook.  (btw – using one as I type).   And easily accessible within this framework – and bringing me back to the beginning of this article – is the Google Earth product for use in the classroom.  It’s an incredible product to augment K-12 classroom teaching and not just for geography.

Continue reading

The Geography of an Adirondack High Peaks Unsupported Thru-Hike Record

Background

Since early July this summer when our youngest son Lukas and close friend Mike Jock completed and established  a new record for an unsupported thru-hike of the 46 Adirondack High Peaks, I’ve been asked by various friends and colleagues across the region (who became aware of the accomplishment) as to whether or not any professional geospatial/GIS technology was used in some capacity in supporting the effort.   Each time my humbling answer has been pretty much the same:  Not Really.  However, they did carry some new gadgetry which is currently used ubiquitously across the adventure and extreme sports landscape to collect data that was used to authenticate their achievement.  But more on that later.

Starting their trek at the trail head to Seward Mountain at 3:30 AM Thursday, June 27th on the west side of the Adirondacks, the two covered the 46 High Peaks in 7 days, 2 hours, and 52 minutes finishing by summitting Mount Esther, on the northern shoulder of Whiteface shortly after 3 AM on July 4th. Ultimately making it down to the Mount Ester trail head at 6:20 AM to complete the trip.   All said, nearly 212 miles and 70,000 feet gained in elevation – more than twice the elevation of Mt. Everest.  They averaged well over a marathon a day, covering some 25-30 miles. On the final day they kept moving for more than 23 hours covering 45 miles.

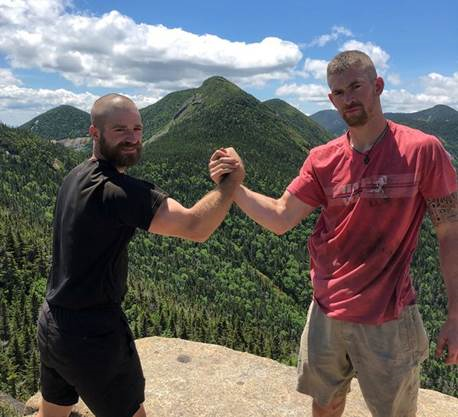
Michael, left, and Lukas at the summit of Armstrong Mountain with Gothics Mountain in the background. The two were soccer teammates at SUNY Cortland. Mike King photo.

Preparation was more old school than one would think.  Nothing in this space replaces on-the-ground knowledge of the trails, trail junctions, where and when to bushwhack, locations of rock cairns for reference points, as well as planning and hiking/testing certain stretches of the route ahead of time.  Yeah, practice runs.  Luke had the benefit of many years of experience having first started ADK trail hiking since he was barely in kindergarten.  Like many other young children, his first “mountain” being Mt. Jo overlooking Heart Lake adjacent Adirondack Loj.  Safe to assume that through the family ties, his spatial orientation has always been pretty decent. Mike, a local boy, grew up in the Plattsburgh area.

This was their third attempt.   And such accomplishments don’t come without the element of good fortune avoiding injuries (which was the case in 2018) and a bunch of days with generally decent weather.  The 2018 attempt was also impacted due to an encounter with a black bear.  Yet another ADK backcountry hiker lesson in overnight food storage.

Given the enormity, location, and challenges of the effort, it would clearly not be safe, if not irresponsible,  to rely solely on the new generation of lightweight/handheld navigational devices as a means to lead one through the Adirondack Mountain wilderness.  There is no substitute for first-hand knowledge of the trail network and a pre-determined plan.  They carried only the essentials such as lighweight sleeping bags, tents, change of clothing, raingear, first aid/basic emergency gear, water filters,  and food.  Counting every ounce in keeping their backpacks to about 40 pounds.  Even omitting the weight of gas canisters/gas stove and in doing so did not prepare anything hot the entire trip.  Zero assistance.

Cool Gadgets

It’s amazing how far the adventure mapping and video/data collection market has evolved since GoPro technology was introduced nearly a decade ago, if not earlier.  The ability to playback Mike and Luke’s accomplishment – made available below via a series of links – is amazingly made possible by just a one simple mobile (wearable) component.  They used a Garmin Fenix 5 GPS Watch to collect X,Y and elevation data which, based on wireless connectivity, automatically uploads to Garmin Connect.  Upon completion of their hike, the entire trip dataset was downloaded to Relive an outdoor 3D video website which allows further rendering and interactive use of the data.    Two Anker PowerCore 26800 pre-charged power banks kept their phones and Garmin device charged.   Of sufficient size to recharge their phones/devices numerous times over.  They took two but in fact only needed one.   The Garmin app also collects heart rate, estimated calories burned, pace (minutes per mile), elevataion gain/loss, and total daily distance – all of which is made available in interactive and graphic form.  In addition to the default Google basemap, data can be rendered on other base maps including satellite, terrain, OpenStreetMap, and Here.  Amazingly compact, yet powerful tools.

The Daily Numbers

The following section includes a brief narrative – Mike’s own words- and links which can be used to highlight trail and body metrics as well as mapping visuals for each hiking day.  For those familiar with hiking and trekking in the Adirondacks, the visuals certainly help put Luke and Mike’s daily segments in better perspective.

Hold on to your seats.

Thursday June 27

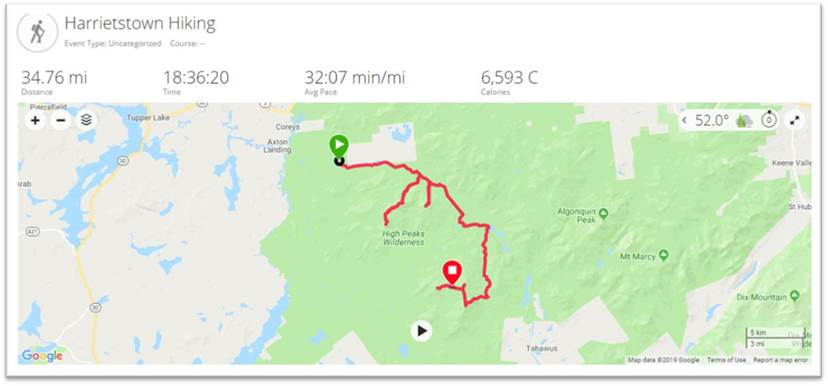
Hiker Notes: 3:30 am depart from Corey’s Road.   Day consisted of seven mountains: Seward, Donaldson, Emmons, Seymour, Santanoni, Panther & Couchsachraga. Out and backed the first four.  Trekked approximately 10 miles to Santanoni range.  Set up camp at the base, then we went up the expressway to summit Santanoni first, followed by Panther, and then finished with Couchsachraga. We came down the Panther brook trail before staying at camp at base of expressway again. Approximately 37.84 miles.

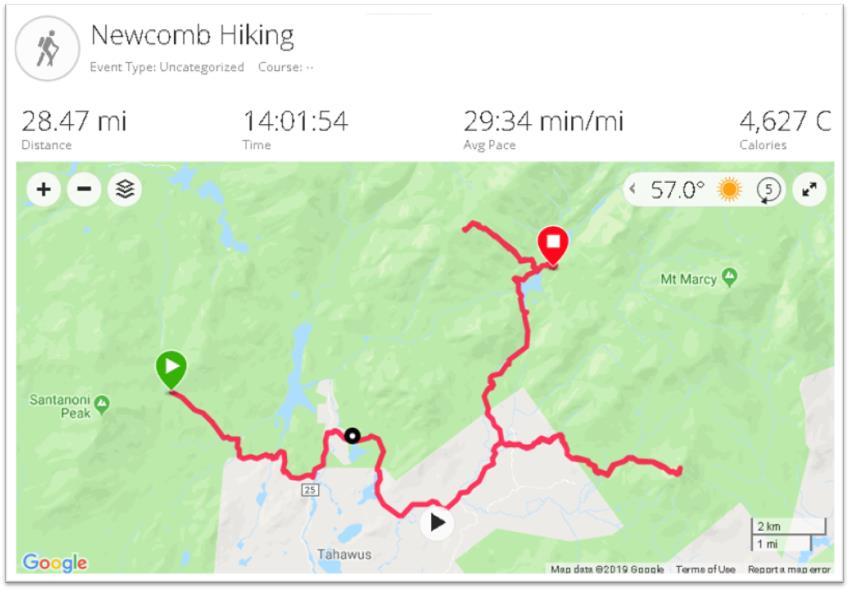
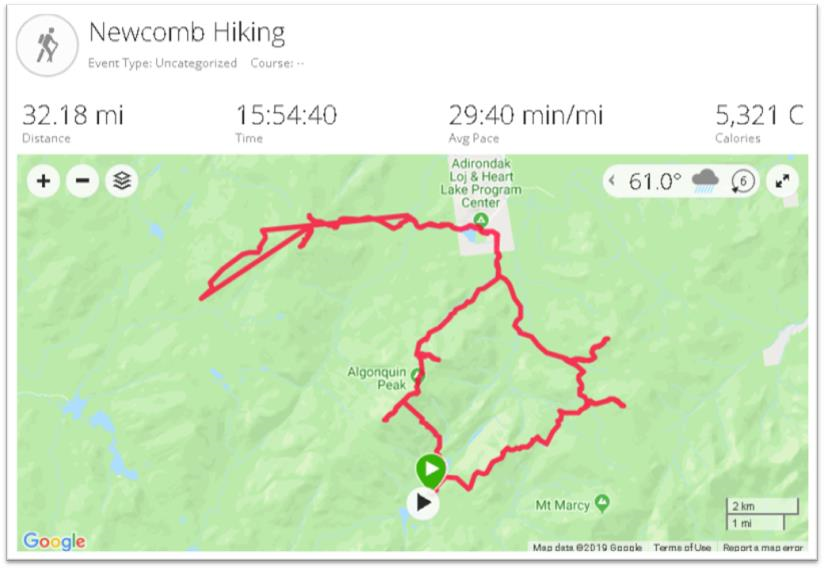
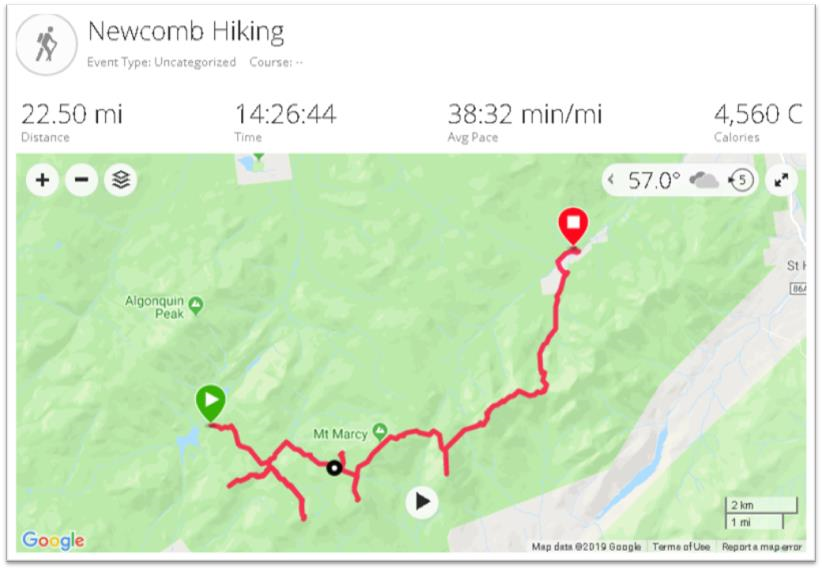
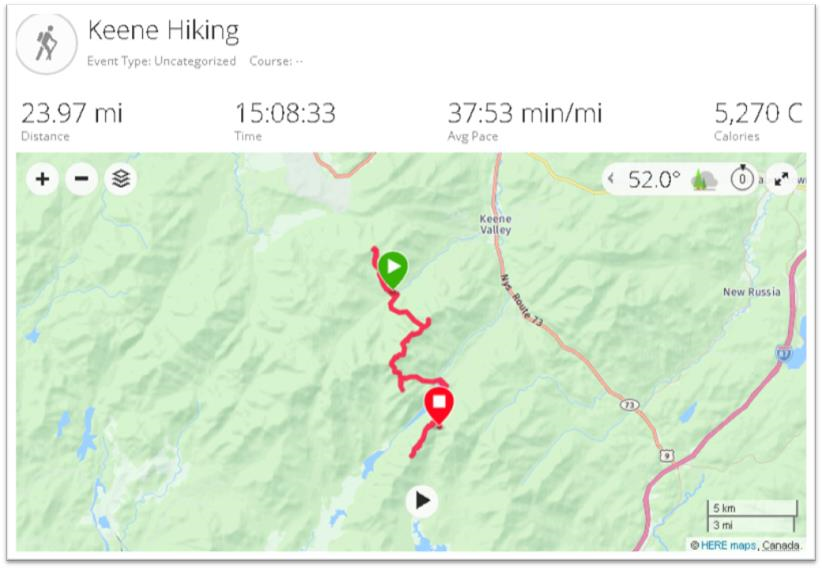
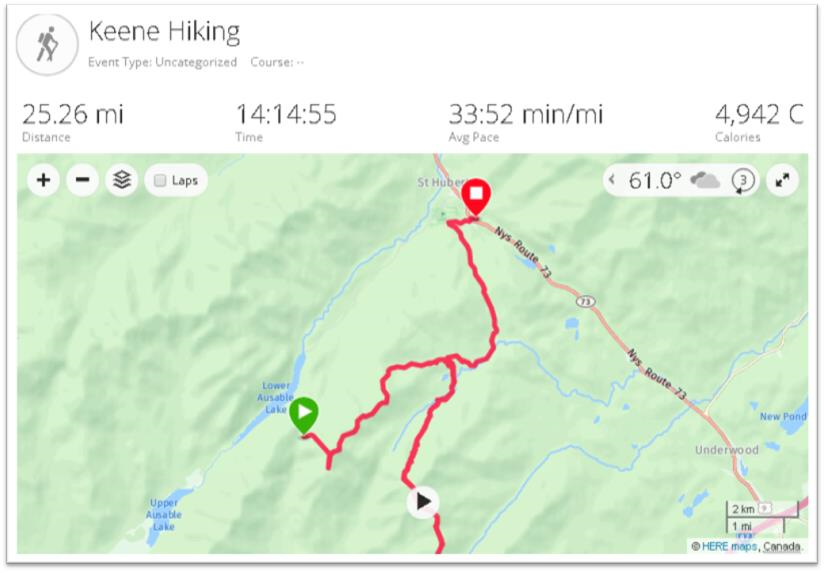
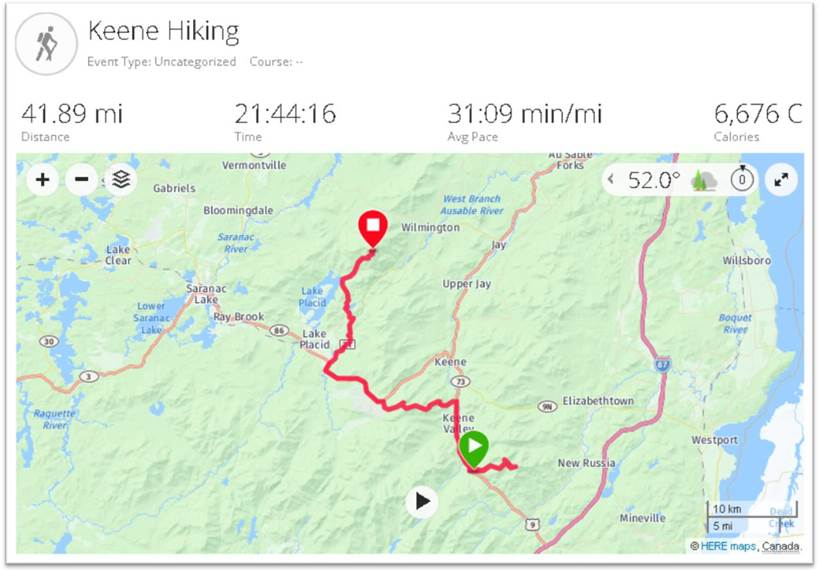
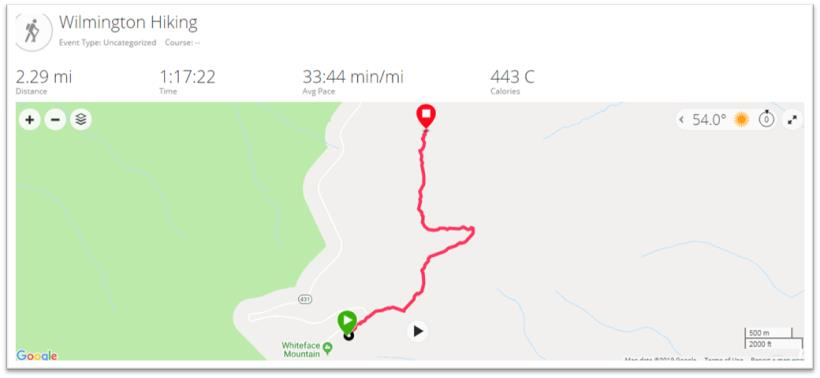
Instructions for all similar images below: Click on map for additional graphics and daily metrics. Or click the black triangle button at the bottom of the screen to see hiker movement over the course of the day.

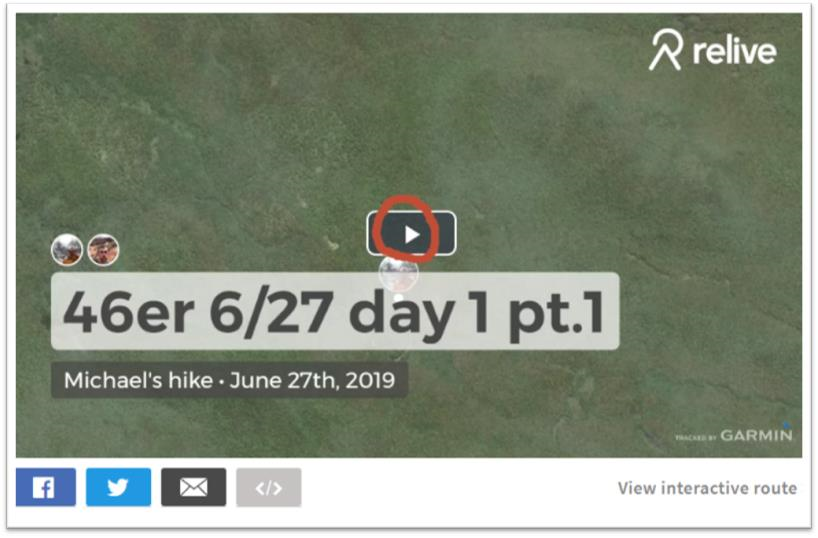
Instructions for all similar Relive 3D Interactive links below: Click on the icon circled in red to see daily hiker movement on top of a 3D base map and associated photos. Clicking on the “View Interactive Route” button enables the ability to interact with the map and trail data “twirling” the image to see from the north, east, south, and west perspective.

Friday June 28

Hiker Notes: From camp, hiked over to Allen mountain, out and backed it before moving up towards Colden/Avalanche Lakes. We out and backed Mount Marshall before setting up camp over the dam at Lake Colden. We summited two mountains and covered approximately 28.47 miles.

June 28thRelive 3D Interactive

Saturday June 29

Hiker Notes: The ADK Loj Loop day. Summitting eight mountains and doing a big circle before returning to the same place we camped the night before. We started by going up the backside of Colden, then Tabletop, Phelps, Street, Nye, Wright, Algonquin and finishing on Iroquis. Approximately 32.18 miles

Note: The only day “noise” was either user generated or introduced by the Garmin device itself. In the vicinity of Street and Nye – Illustrated by the “straight” additional red line. Also reflected in the Relive 3D viewer.

June 29thRelive 3D Interactive

Sunday June 30

Hiker Notes:   Audible day. Started by moving to the base of Cliff and Redfield (out and bacs), then trekking up towards Gray, Skylight, Marcy, Haystack, Basin and finishing with Saddleback. Due to it raining all day, made the game time decision to check out and head towards Johns Brook Lodge where we camped at the trailhead of Big Slide Mountain (setting ourselves up the next day to finish the Great Range and start moving east). Summitted eight mountains and covered approximately 22.5 miles.

June 30th:  Relive 3D Interactive

Monday July 1

Hiker Notes:  Out and backed Big Slide early in the AM, before climbing up towards Great Range. First we summited Lower Wolf Jaw, then Upper Wolf Jaw, Armstrong, Gothics and Sawteeth. We then headed down trail to Lower Ausable Lake. Next we did Colvin and Blake before camping between those two mountains.   In total we summited eight peaks again and covered 23.97 miles.

July 1st:  Relive 3D Interactive

Tuesday July 2

Hiker Notes: Started by ascending Nippletop, moved on over to Dial, then bushwhacked down towards the Dix Range. Once we got down from bushwhack/brook we dropped bags and then out and backed the entire Dix Range: Dix, Hough, South Dix, Grace Peak & Macomb. From there we got our bags again and then moved our stuff over to Roaring Brook and the base of Giant Mountain. In total we covered 25.26 miles and summitted seven peaks.

July 2nd:  Relive 3D Interactive

 Wednesday July 3

Hiker Notes:  The 24 hour day. Woke up at 3 am and went to get Giant and Rocky Ridge Peak (out and backs). From there we picked up our stuff again and schlepped ourselves 5.5 miles down route 73 toward Marcy airfield. Next up was cutting from one side of 73 to the Lake Placid side of 73 along the ridge trail that summitted Porter and Cascade Mountains. Off of those we had then a 10 mile stretch on route 73 and then River Road towards the trai lhead to Whiteface mountain. Using the trail by Connery pond we entered that portion at 1030 PM and was able to summit both Whiteface and then Esther by 3:15 am. About 23 hour and 30 minutes of moving time we summitted our final 6 peaks and covered 44.18 miles. Passed out for an hour and reached Memorial Highway by 06:22 AM, where a time-stamped photo was taken.

July 3nd:  Relive 3D Interactive (Part 1)  Incredible day!!

July 4th:  Relive 3D Interactive (Part 2)

Summary

Quite an effort  and on top of setting the record, between this trip and last year’s attempt, the two helped raise nearly $18,000 for the Dubin Breast Center at Mount Sinai Hospital in New York.  Their accomplishment was covered by Backpacker Magazine as well as a selected number of upstate New York online publications (UpstateNewYork and NNY360) among others.  The articles are generally similar in content though do offer more details about food and other daily nuances/items which I omitted here.  Choosing rather to highlight and focus on the immense geographic element of the effort.

Both Luke and Mike are personal trainers living and working out of New York City.  More information can be found on their website Team Adventure Portal.

Wayfinding: Geospatial Goes Indoors with Connexient

As GIS and mapping technologies evolved through the later part of the 20th century focusing mainly on the physical(outdoor)  landscape, the digital mapping of the  built/interior environment continued to focus on the use of AutoCAD/Revit and related CAD technologies.  With exceptions, there were two definitive geographic mapping camps:  Geographic Information Systems (GIS) software vs. Computer Aided Design (CAD) software.   One or the other.  And with little integration of both.

As both technologies matured, integration between the two computing environments became more common and the lines of division blurred.  New technologies including, but not limited to Global Positioning Systems (GPS), Laser Scanning, Building Information Modeling (BIM), and drones, as well as advancements in 3D modeling and increased desktop and internet capacity aided to the continued integration of the software platforms. GIS and BIM Integration Will Transform Infrastructure Design and Construction is a very recent and quick read from Autodesk charting the path of this flourishing market.

Fast forward to 2018 and the evolution of indoor wayfinding which leverages many of the components of these same outdoor and indoor mapping concepts.   Based on a similar spatial data model, Wayfinding applications are now found in a wide range of public spaces, educational and industrial campuses, entertainment and athletic venues, buildings, and healthcare facilities.  Offering indoor maps for handheld mobile devices is becoming more and more common, as are digital information kiosk systems in office complex lobbies, and as part of web mapping applications. (It is often recognized that The Americans with Disabilities Act of 1990 (ADA) represented a milestone and was instrumental in helping to make spaces universally accessible and improving wayfinding for all individuals.)

Connexient

New York City-based Connexient was formed in June 2012 with the vision that indoor GPS and navigation will become as widespread inside as it is outside.

With over 60 licensed hospital client sites and a total square footage over 70 million square feet mapped, Connexient is a market leader in healthcare in providing  smart phone based turn-by-turn indoor navigation and all screens digital wayfinding solutions.   Leveraging significant breakthroughs in the ability to implement low cost, navigation quality indoor positioning, users can now expect the same kind of functionality –  intuitive, reliable and accurate maps, directions and turn-by-turn navigation which is commonly available from outdoor world mapping and navigational companies such as Google, Apple and Waze.    The same user experience can be available via a mobile app for any large, complex indoor facility or campus that they enter.  Today, these capabilities are highlighted in Connexient’s flagship product MediNavTM.

Selected MediNav functions include:

  • Multiple levels of zoom and detail
  • 5D visualization and 360 degrees of freedom of camera control
  • Detailed routing network and intelligent routing
  • Turn-by-turn instructions
  • Visual landmarks (signage) to provide locational reference
  • Visual and audio turn prompts
  • Off-route notification & route recalculation
  • “Balcony view” route visualization – what is coming next
  • 1 to 2 meter accuracy
  • Dynamic refresh of user position
  • Parking Planner, Find my Car and Meet Me
    Continue reading

Jonathan Levy: Cartography Remixed

Jonathan Levy is yet another geospatial enthusiast I have made contact with via the burgeoning GeoNYC Meetup group. It’s a small world indeed as Jonathan and I share some common interests including music, sports, and time spent in one of my most favorite spaces: Idaho. His path down the cartographic road might be considered a bit different than the conventionally trained geospatial professional.  However, what is coming out the other end today is a wide range of interesting cartographic products and services.  Enough for an interesting dialog and blog post – including some interesting personal stuff on the side.  Enjoy.

Jonathan Levy grew up in the Durham and Chapel Hill areas of North Carolina spending lots of time running around in the outdoors.  His dad was a huge fan of National Geographic exposing Jonathan to both the beauty and vastness of the publication’s cartographic products and at the same time taking him camping and trail hiking around  in the Appalachian Mountains.  In his teens, he completed an Outward Bound course which introduced him to orienteering and using maps for navigation and survival.

After graduation from high school, Jonathan attended Brandeis University majoring in Near Eastern and Judaic Studies with a minor in Environmental Studies focusing on conservation biology and environmental politics.  After finishing his undergraduate work he traveled to Grenada, West Indies, to teach environmental/social science to children with Dr. Dessima Williams.   Afterwards, he worked for Polaroid’s Corporate Environmental Department in Boston, MA for nine months before heading to Salmon, Idaho as part of the Student Conservation Association working with the U.S. Forest Service in the Frank Church Wilderness Noxious Weed Inventory program.  It was here he was introduced to Global Positioning System (GPS) data collection concepts and GIS software to make maps of field guides of rare plant species in the wilderness area.

Completing his internship work in Idaho in 2002, Jonathan was  given a grant towards graduate study at at Hunter College in New York City in the MA program specializing in Geographic Information Systems (GIS)  and Media during which time he was able to intern at the United Nations and the New York City Office of Emergency Management.  He received his Masters from Hunter College in 2005.

Getting Started

His first job out of Hunter College was with the NY State Legislative Task Force for Demographic Reapportionment which Jonathan notes “was very GIS heavy and really interesting”.  At this point he began picking up freelance work on the graphics side of things with TED.com, Maps.com and Not For Tourists – the latter of which was has continued to be a successful long term contract.

Along the way he has continued to expand his use of the ESRI software particularly with regard to the spatial/network analyst extensions as well as becoming proficient in QGIS and Carto. Because he extends his cartographic product beyond the what is available with GIS software, Jonathan uses Adobe Illustrator and Photoshop for graphics processing, texturing and post production. For 3D renderings he uses Cinema 4D, After Effects, and Sketchfab.

Sample Cartographic Products

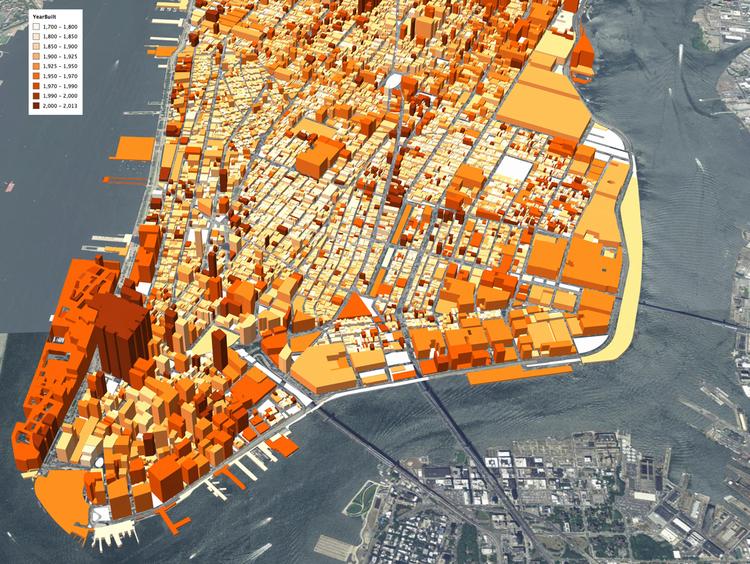
Lower Manhattan Buildings:

This 3D rendering of buildings in Lower Manhattan show the years in which they were built from 1700 to the present. The gradations of dark orange to light orange correspond to the newest to the oldest buildings. The data used to create this map came from NYC Open Data.

Environs Map Series:

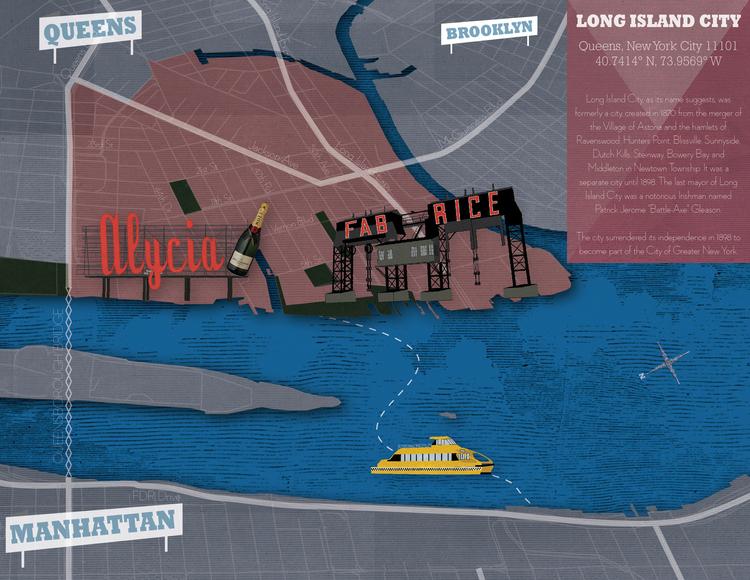
This series is a way of sharing Jonathan’s life experiences of favorite places and spaces in his  life through map renderings and illustrations.  It is his personal experience of specific places and the personal “visions” of that space.  He gets requests to produce custom maps for friends, family and clients who want their town or neighborhood mapped in this style. He’s currently working on a Valentine’s day gift for a client who wants a map of Roncolo di Quattro Castella in this style.  These images are created using: Photoshop, Adobe Illustrator, scanned textures and GIS data.

Jonathan notes: “I love seeing Long Island City from across the East River. The Pepsi and Long Island City signs are featured prominently although here I’ve replaced them with my sister and brother in law’s names in lieu of their recent marriage.”

Airbnb:

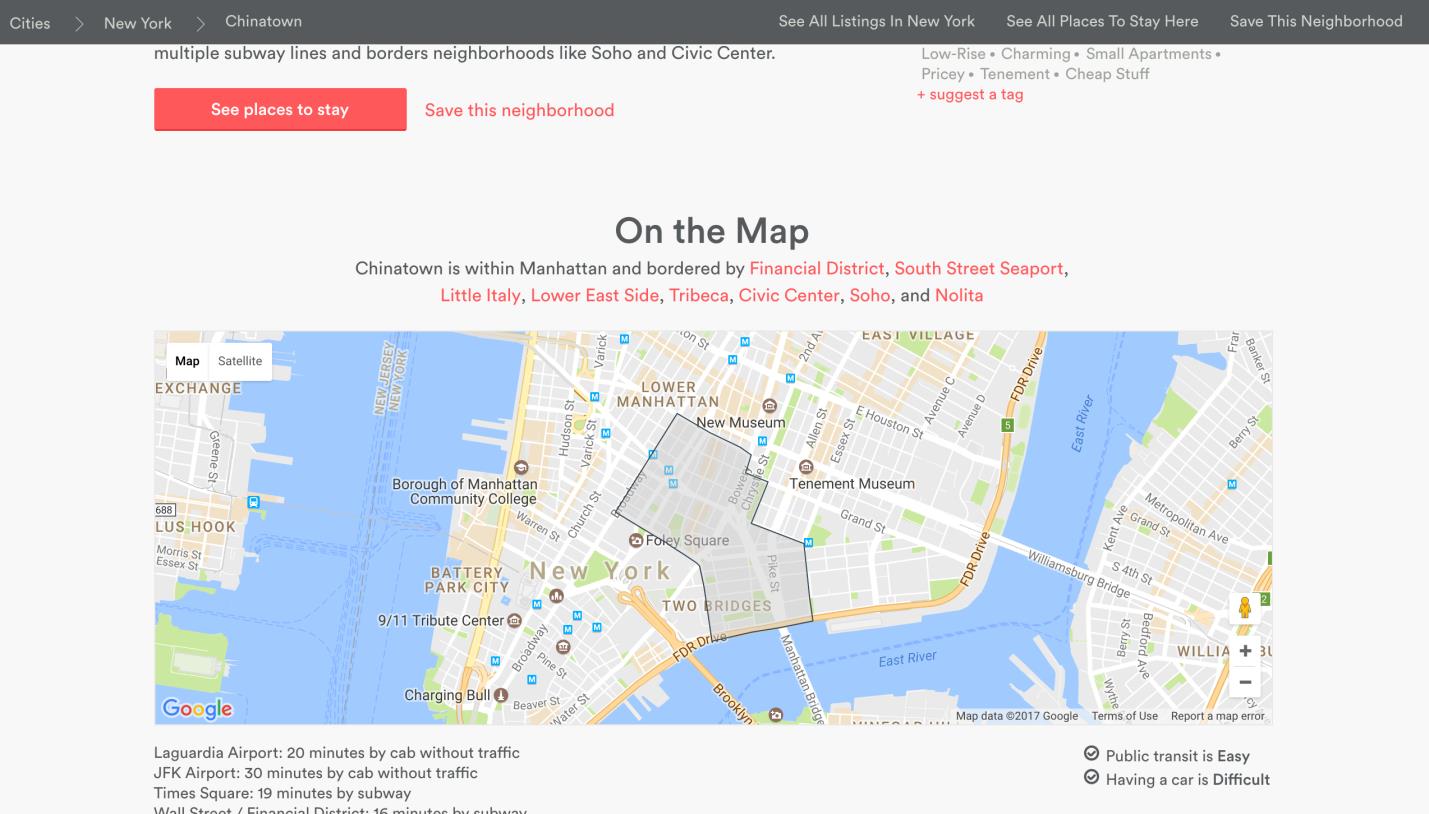
Jonathan notes this was a “fun” project. Using some fancy internal tools Airbnb developed, Jonathan helped map out neighborhood boundaries in 20+ cities across the U.S – including New York City.   It involved lots of research and involvement with city planners, residents and/or a combination thereof to get a feel for the individual city.

Sample of one NYC neighborhood maps – Chinatown – Jonathan researched and created for Airbnb helping users better define which areas and neighbors they are looking for lodging and accommodations.

Montauk 3D:

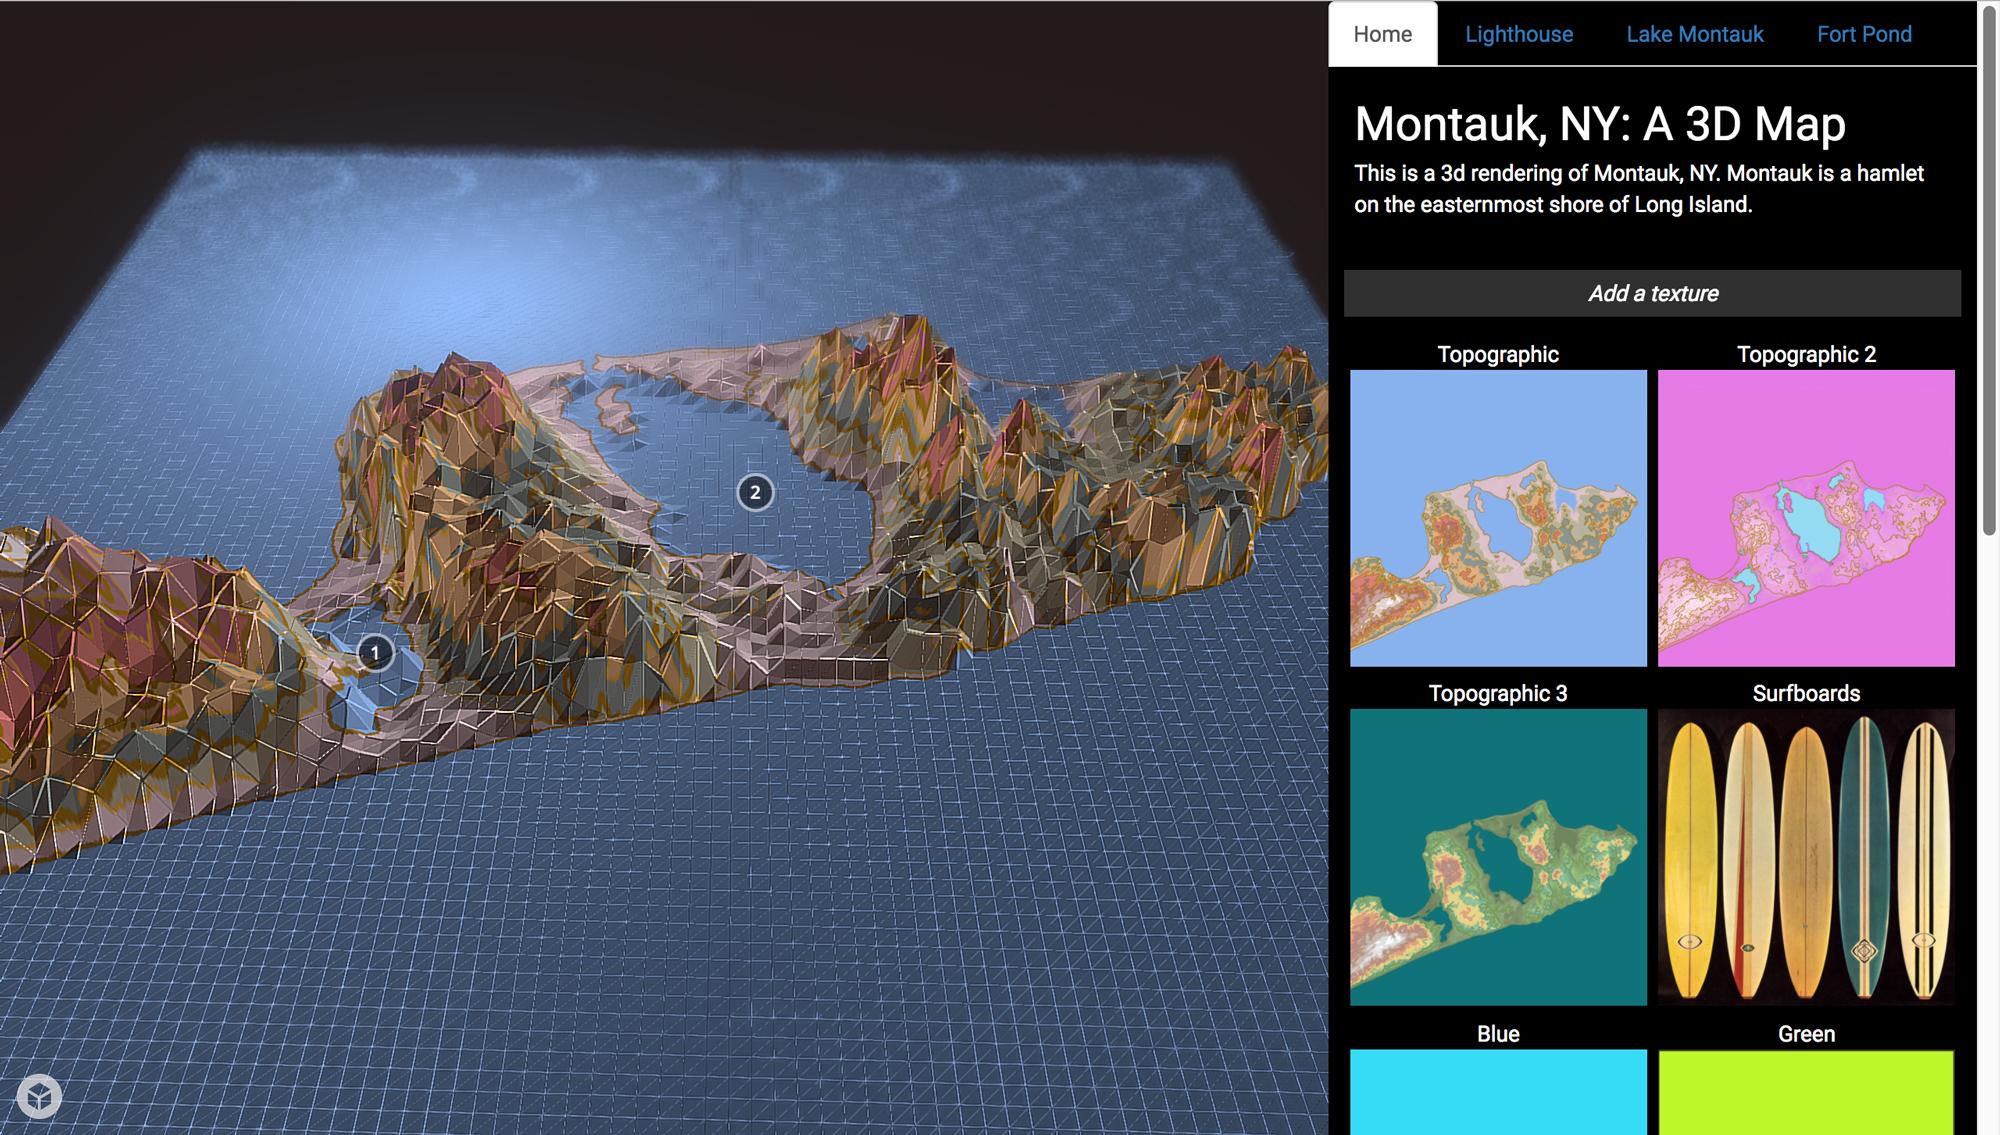
This was a personal project that was inspired by his time this past summer learning to surf in Montauk. He was struck by the interesting topography of the area. He took digital elevation model (DEM)  data, exaggerated the contours in Cinema 4D for effect, created custom topographic palettes and created a website that uses Sketchfab’s API to switch out textures on the 3D surface. Link to website: http://aws-website-montaukd-vr1zr.s3-website-us-east-1.amazonaws.com.  (Note:  Sketchfab recommends WebGL to display 3D content in real-time  which is a standard in most modern browsers.  Check your browser for compatibility at http://get.webgl.org/).

Amped Topography of Montauk: If you know the Montauk landscape and locations of specific geographic features (i.e., Lake Montauk and the Lighthouse – chances are you would find these renderings of the area very interesting – and different.

Loud Noise/Noise Complaints:

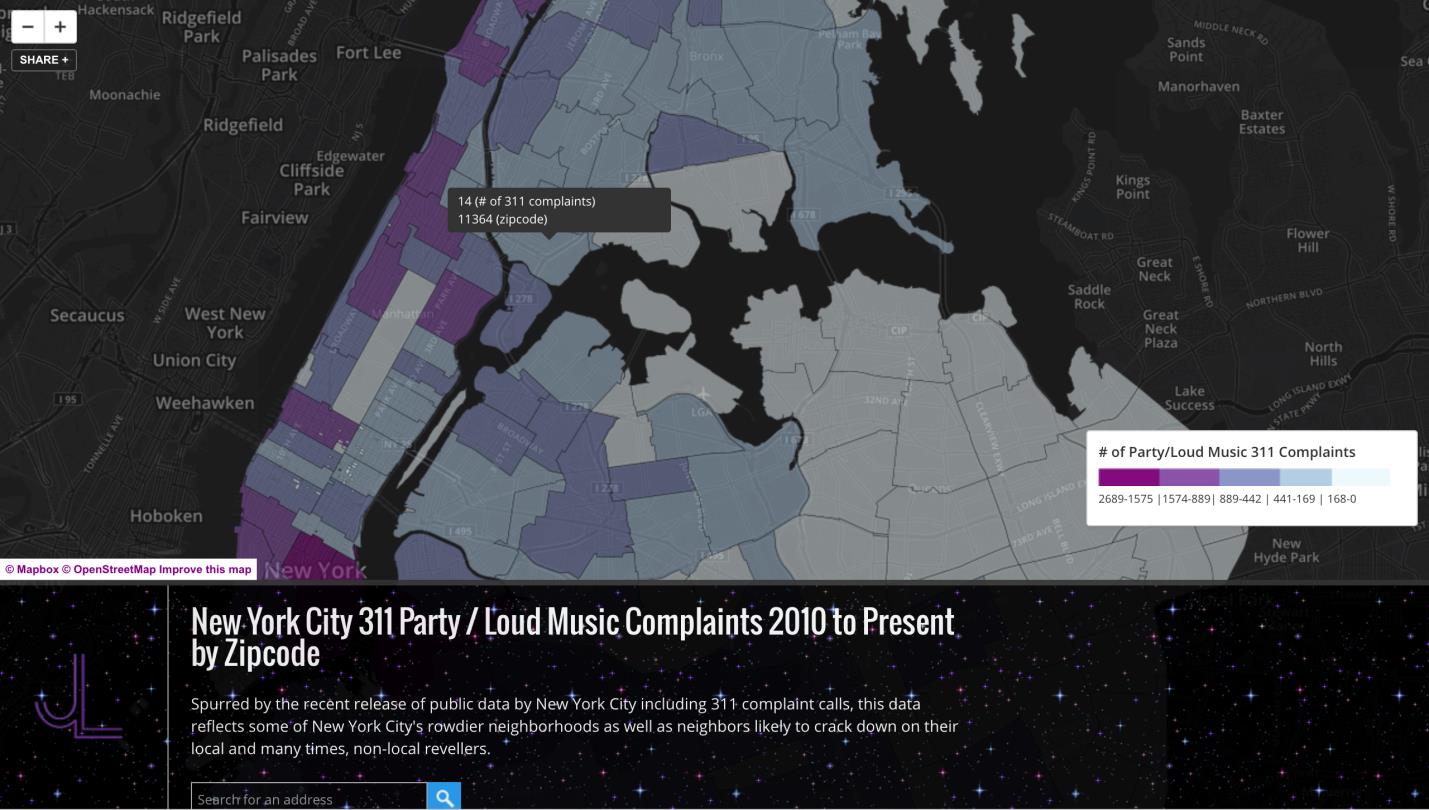
Jonathan also enjoys scrapping data from public web sites to develop maps and visuals.  While living on the Lower East Side of Manhattan, Jonathan created a Party/Loud Music Complaints map based on 311 data obtained from New York City’s Open Data Portal. These maps include and reflect his interest in rendering the “personality” of geospatial data through design choices – as illustrated in this map/web map – including a dark background, a purplish nighttime color palate and star animated Gifs.  Indeed an interesting map from a person who loves loud music and spends his spare time playing in a metal band!

Built with OpenStreetMap, this interactive map allows users to pan around Manhattan to see which NYC zip code has the largest number of noise complaints as filed through 311.

The Other Stuff

Jonathan always finds his legal mapping client work interesting as it requires mapping and data development to such a fine level of detail.  Often such work involves boundary disputes requiring the review of historical deeds and historic photogrammetry to determine boundary line changes. Looking forward he continues working with Sketchfab in context of mapping in the 3D space.  He supports Sketchfab because it is “accessible, light and has a community for sharing 3D models with annotation”.

As a one person shop, Jonathan does not have a large marketing and public relations budget and as such all of  his business development is  word-of-mouth.  He’s recently created an interactive presentation for a close friend and chef/owner Will Horowitz (Duck’s Eatery / Harry & Ida’s) which he presented at the Food on the Edge conference in Ireland. He’s working on an online platform, Common Scraps, which addresses the issue food waste.   As an extension he has produced some animated maps that show how food scraps can be saved and reused in an exchange system between local farms/suppliers and restaurants.

Jonathan covers a lot of ground and styles in his work which is more detailed and described on his website. Take a look, and if you are really lucky you might find him playing at a local club down the street with his band Autowreck.  Go check them out.

Though take some ear plugs and hold on.

Contact:  Jonathan Levy @ jl@jlcartography.com