Warren County GIS: A Showcase of Geospatial Content for County and Local Government

Program’s modest beginning started in the late 1990s with AutoCAD files and a copy of ArcInfo

Now spending a significant amount of time upstate New York in Essex County, we now find ourselves looking for different routes to take back and forth from southeast New York State instead of the “go-to” I87/Northway option every time.  Just to mix things up – the four-plus hour drive going the normal route can get to be a bit monotonous.

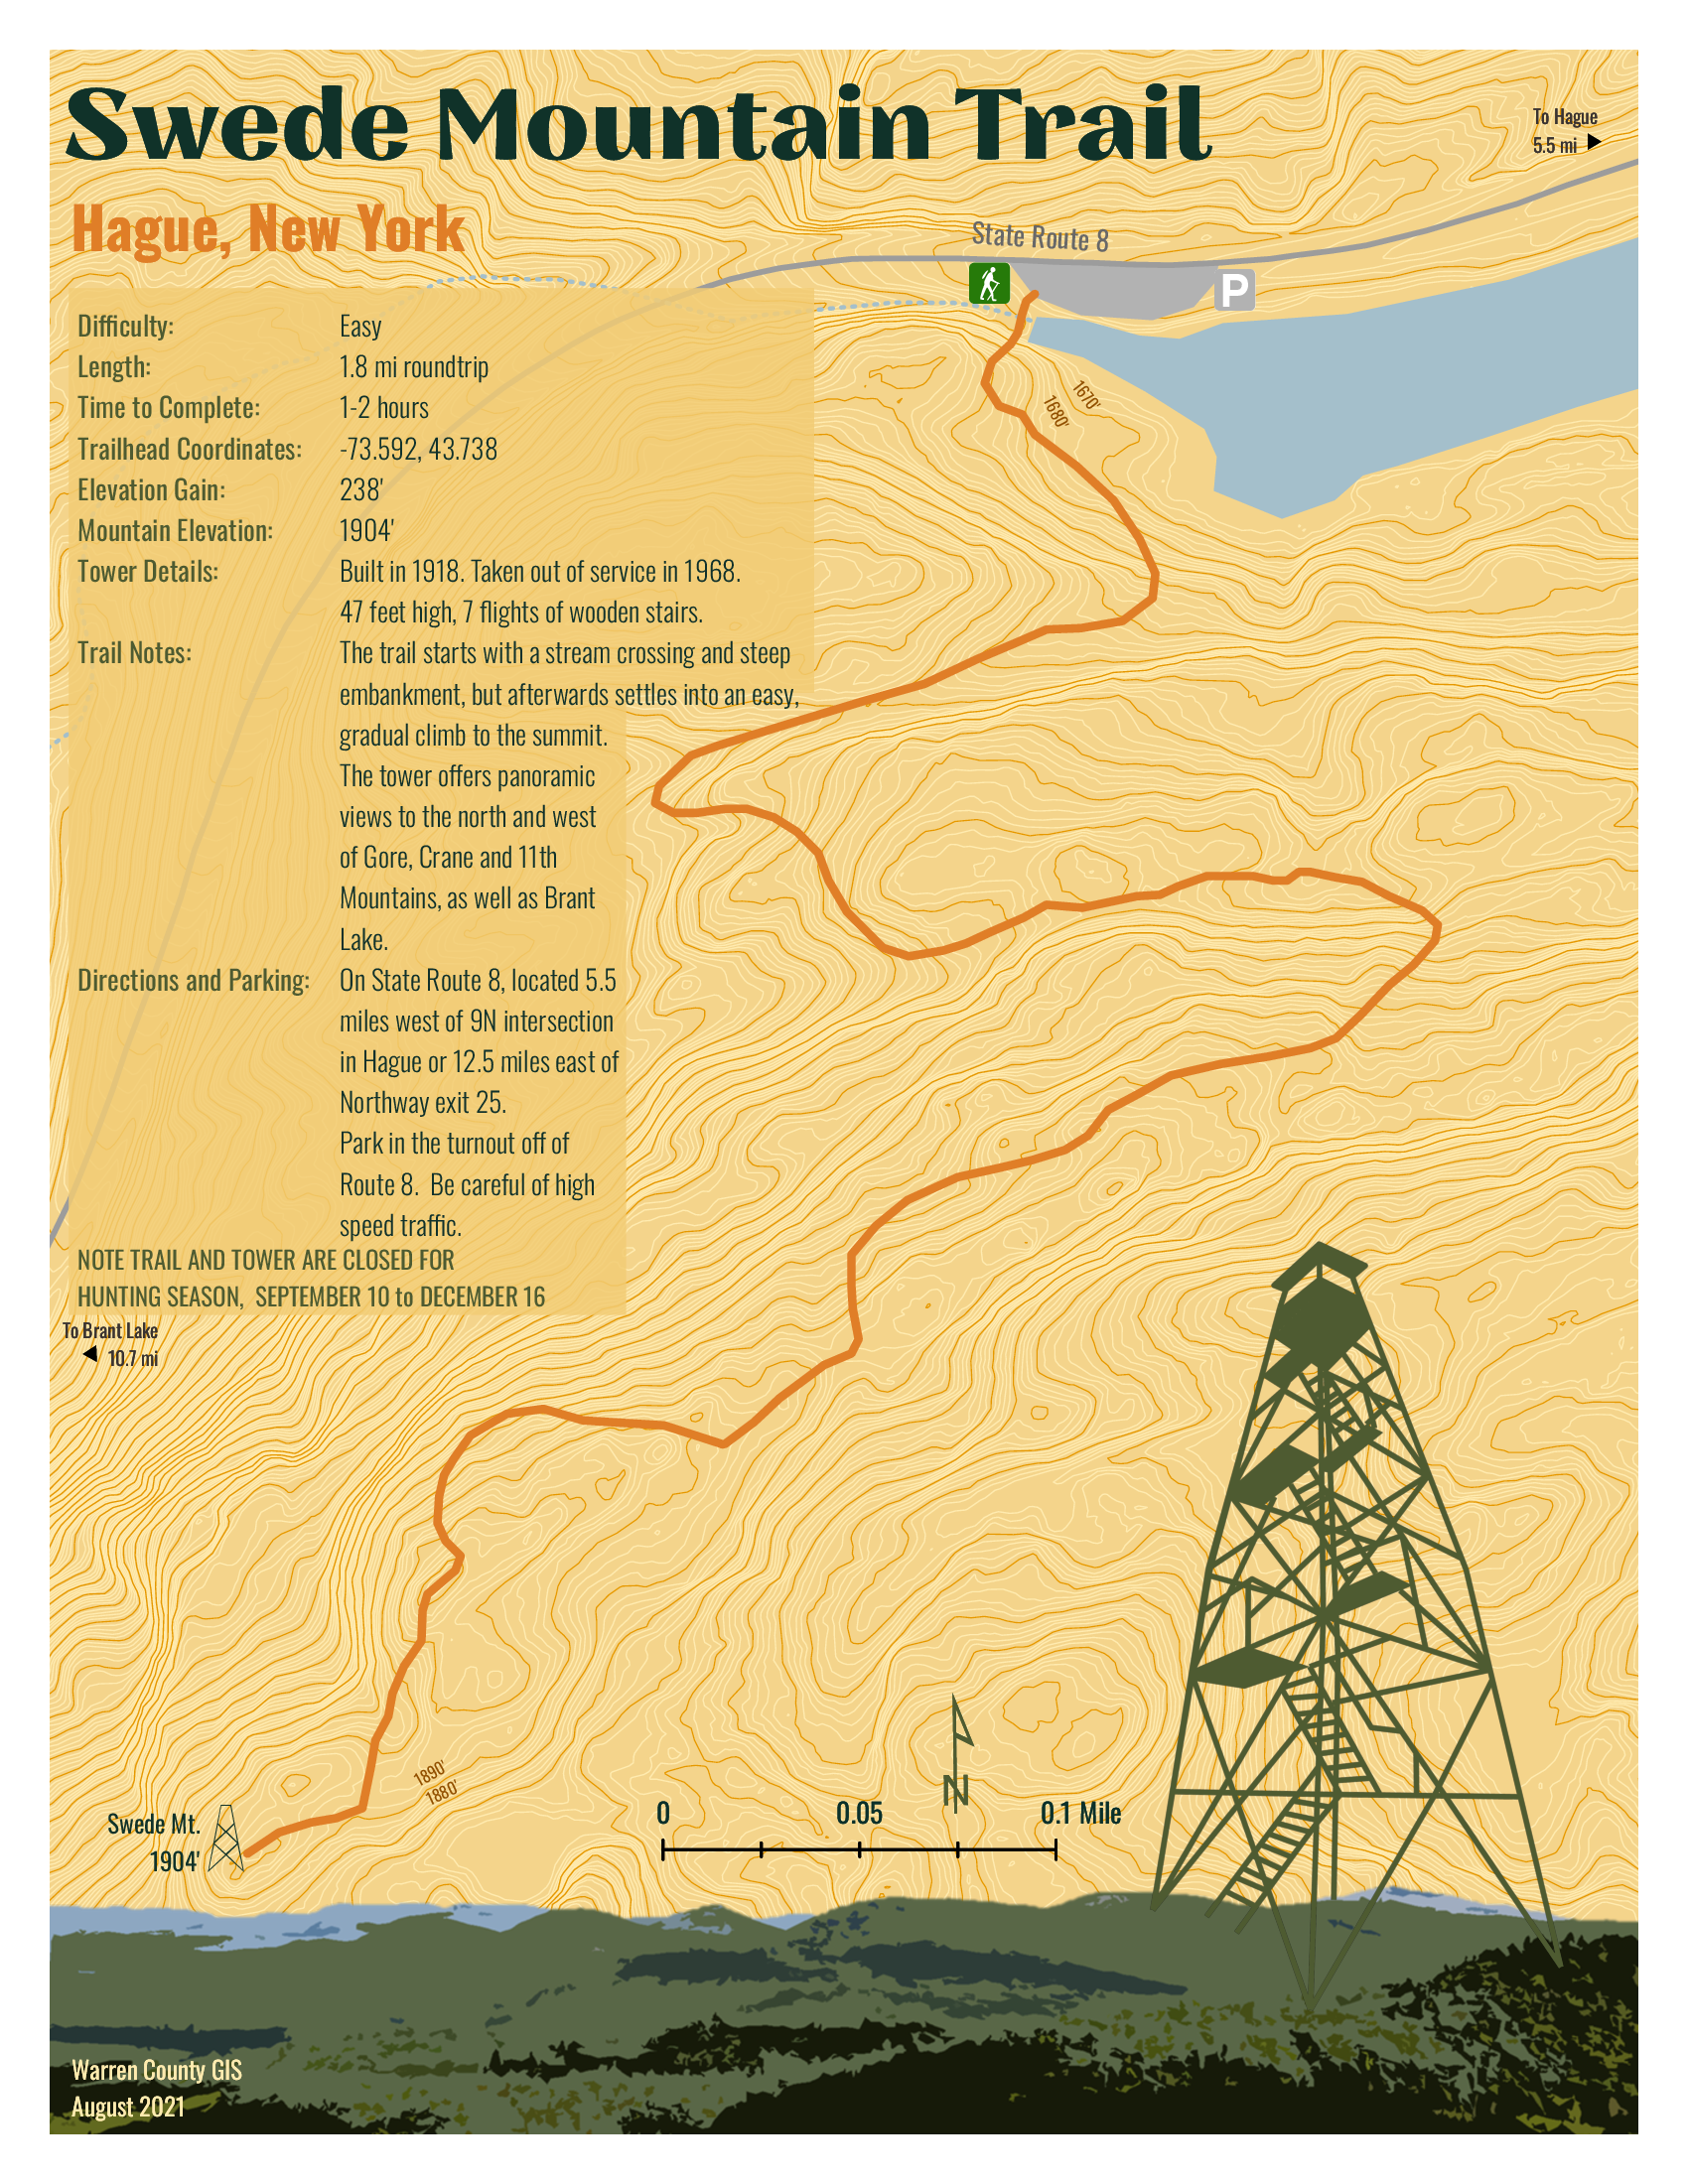
So it was in September I came south out of Ticonderoga headed to Hague (yes, named after The Hague in the Netherlands) on the northern end of Lake George – an area I had never been to.  And it did not disappoint.  Though ultimately to State Route 8 (aka Graphite Mountain Road) to a new Adirondacks trailhead:  Swede Mountain Firetower.  Even though the round-trip hike isn’t that long and relatively easy, it was getting late and I didn’t even get out of the car while in the trailhead parking lot.  Instead, making a note to print out a trail map when I got home.  A couple days later and not having a clue what trail maps were actually available, I Googled “Swede Mountain Firetower trail map” and a candidate list of URLs and image options were immediately returned.  Randomly selecting the one below,  the cartography caught my eye and I quickly looked for the map’s author.  There on the bottom left:  Warren County GIS.  

It was quickly then off to the Warren County GIS website.  Which became the genesis of this article.

Warren County GIS
Just by coincidence, this article coincides with the release of the new Warren County GIS Hub as announced by long-time county GIS Administrator, Sara Frankenfeld.  Overseeing a countywide GIS program judiciously developed over the course of more than two decades – from the days of ARC/INFO coverages to 2022 mobile field apps and interactive online viewing applications.  Also available through the program and Hub is a rich repository of dozens of hardcopy maps available for download covering areas such as countywide outdoor recreation, history, demographics, municipalities, planning and the environment and much more.   An amazing amount of content bundled into three main categories:  Web Maps and Apps | Maps for Print | Download Data.

Background

Originally from the northside of San Francisco Bay in Marin County and earning a degree in Geography from Northern Arizona University, Frankenfeld came to the east coast to initially start work with Dutchess County.  After a short stint with NYSDEC she ultimately made her way to Warren County in 1999 where she got started with a copy of ARC/INFO on a standalone computer in the county building basement.   The county had created a new GIS position in the Planning Department to help convert the tax maps to AutoCAD and then over a period of time converting from AutoCAD to ARC/INFO and then later to geodatabase. 

Over the next four years, she was successful in winning over several other departments on the value and usefulness of GIS technology which she accomplished by focusing on easy, visible “wins” such getting people to use the newly available digital tax parcel data (linked to the RPS data) as quickly as possible and making hardcopy maps.  Lots of maps.  The visibility of the Warren County program also expanded by her working with municipal government zoning administrators and assessors and providing access to the new digital parcel data and including zoning maps,  wetlands data, and FEMA floodplain maps.  A New York State Archives and Administration (SARA) grant enabled the development of a parcel viewer app sby AppliedGIS – where she would later go to work for several years – called the Spatial Data Viewer.  The groundwork was also laid for the implementation of ArcIMS and Imagemate Online.  Somehow she also found time to include outreach programs to local schools and GIS Day.  

After a period in the private sector with (then) AppliedGIS/Fountains Spatial, she returned to Warren County in 2013 where she remains today.  

Today’s Environment

In 2022, the Warren County GIS program is built totally around the ArcGIS Online (AGOL) environment.   Frankenfeld states AGOL has “totally transformed the workplace” and furthers her two main goals of (1) improving public access to data and (2) streamlining/improving processes for county departments and organizations the GIS program supports.  She, along with GIS Specialist Amanda Beck, have embraced StoryMaps, Dashboards, Hubs and Survey123 in ways to make it easy for non-tech users to create and maintain data and access it.  While many of the combo Survey123/dashboard applications are internal facing, others, like the Lake George Milfoil Harvesting real-time app is available to the public.  And so is the Capital Improvement Project Planning viewerBoth respond to GIS requests from local municipalities, local organizations including  the Adirondack/Glens Falls Transportation Council (AGFTC), Lake George Park Commission and the Lake Champlain Lake George Regional Planning Board – all of which have tech support contracts the County.  Projects range from data compilation to hardcopy map preparation to creating and supporting online apps.  Usually these three organizations know exactly what they want, but GIS staff we do often try to suggest ways to streamline or improve their requests.  For example, County GIS staff helped AGFTC come up with a method to inventory sidewalk/crosswalk/curb ramps for ADA transition plans that proved really popular and resulted in a training session for all the Metropolitan Planning Organizations (MPO) in the state.
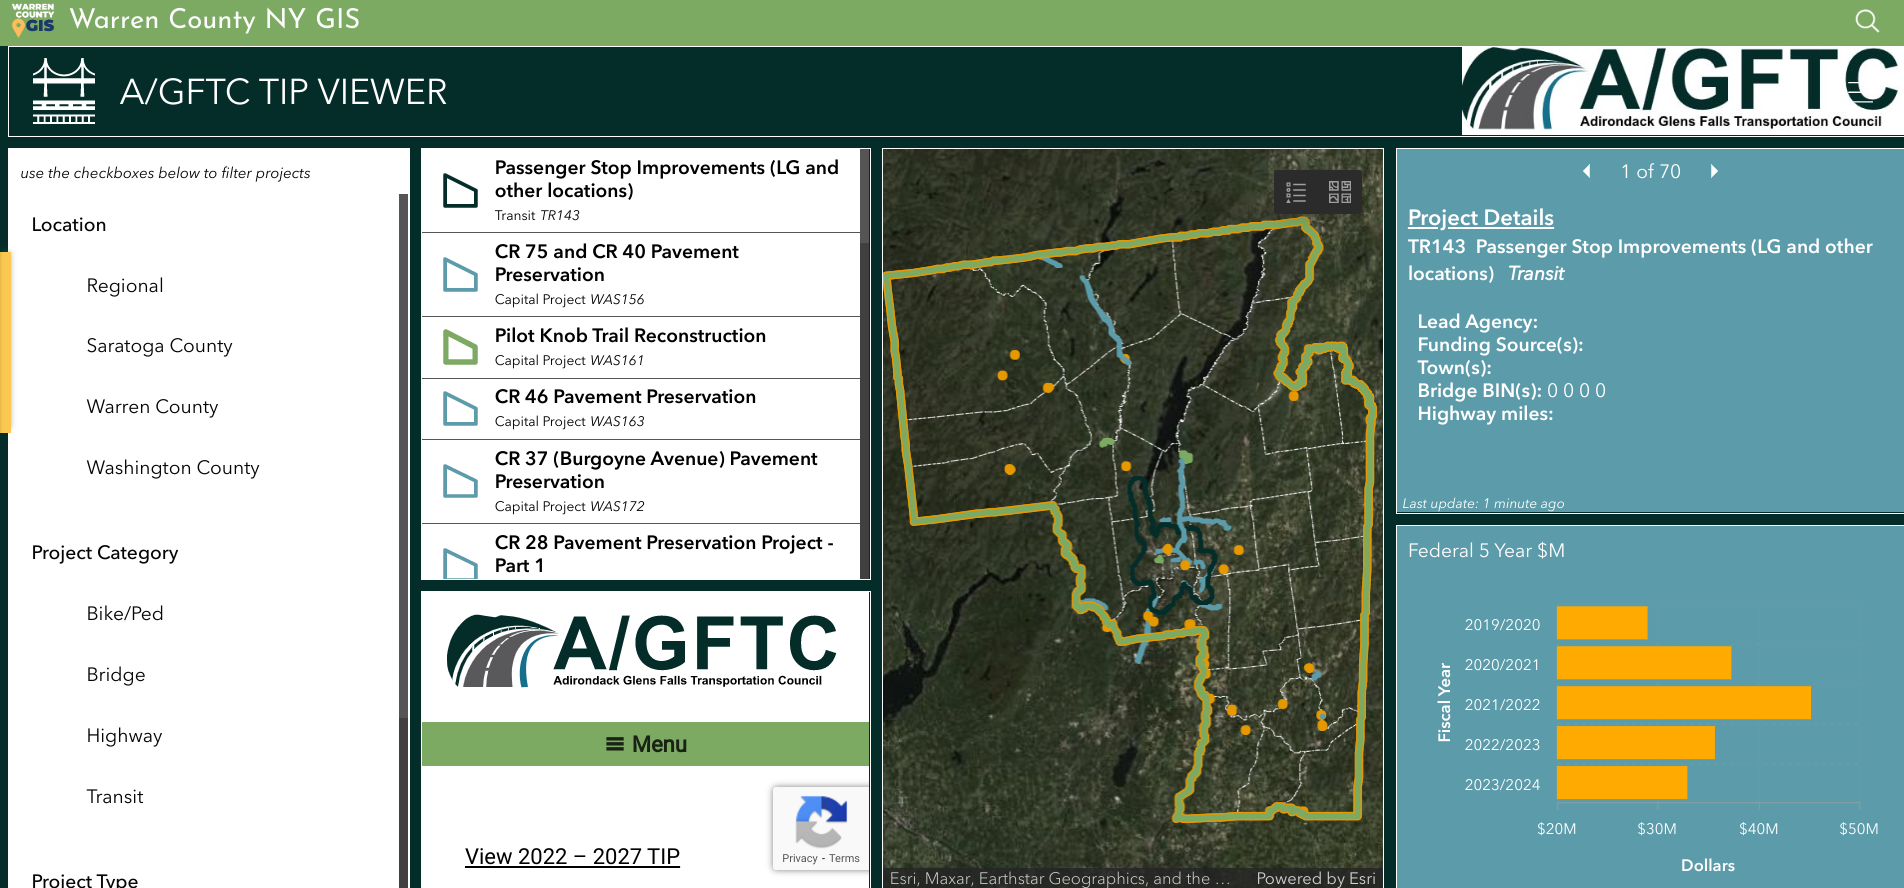
Dashboard for Adirondack/Glens Falls Transportation Council’s Transportation Improvement Program projects.

Having transitioned to ArcGIS Pro to support data editing, cartography and more complex analysis, Warren County GIS staff do a majority of their work in AGOL which includes the mobile pieces Field Maps and Survey123.  They still collect GPS data as needed (usually related to recreation or e911) and support field operations, such as collecting milfoil harvest or infrastructure data, for other users.  They also have Trimble boosters and cell phones which can be checked out to both county staff and municipalities for field data collection along with field worker licenses.   While there are still a few remaining ArcGIS desktop users, most users are using AGOL with named users in Planning, Soil and Water, Public Affairs, the Sheriff’s Department, Office of Emergency Services, Public Works, and Parks and Recreation.  Address and road centerlines are uploaded to the state twice a year and parcel data once a year.  A large current project Sara and Amanda are currently working on is building additional GIS capacity and functionality in County Department of Public Works.

Except for Queensbury which has its own full-time GIS staff person, Warren County GIS supports all municipalities in the County.  At the beginning of the program, Sara had  set up each municipality with desktop GIS as well as providing training and support.  In hindsight and it comes as no surprise this desktop support  was the most time consuming element of her job in the early years.  With the advent of online GIS, County staff has transitioned most of the towns off of desktop GIS, although there are a small number of towns which still use the desktop client.  Most local communities across the County now utilize new AGOL applications.   “We often will take the initiative with projects for the towns that relate to work the County Planning Department is doing such as the Warrensburg buildout analysis“, notes Frankenfeld, “as well advocating the adoption of Field Maps for maintaining water and sewer data.”

New GIS Hub

As noted previously, the new Warren County GIS Hub contains three main areas of content:  Web Maps and Apps | Maps for Print | Download Data.  Each area is then broken down further thematically into categories such as recreation, environment, transportation and infrastructure, planning and zoning, history, citizen reports and more.  With an established user community in County government, most of the time departments and organizations now approach GIS staff directly with applications to develop to support their business needs such as the Safe Pace, Opioid Dashboard, Storm Reporter, TIP viewer, etc).  Other projects have been initiated by GIS staff themselves such as the covid hub and election polling locator.   GIS staff work frequently  with other Planning Department and and apply grant funding to create projects such as History Mapper and the letterboxing challenges (Letterboxing Trail and Historians’ Challenge).
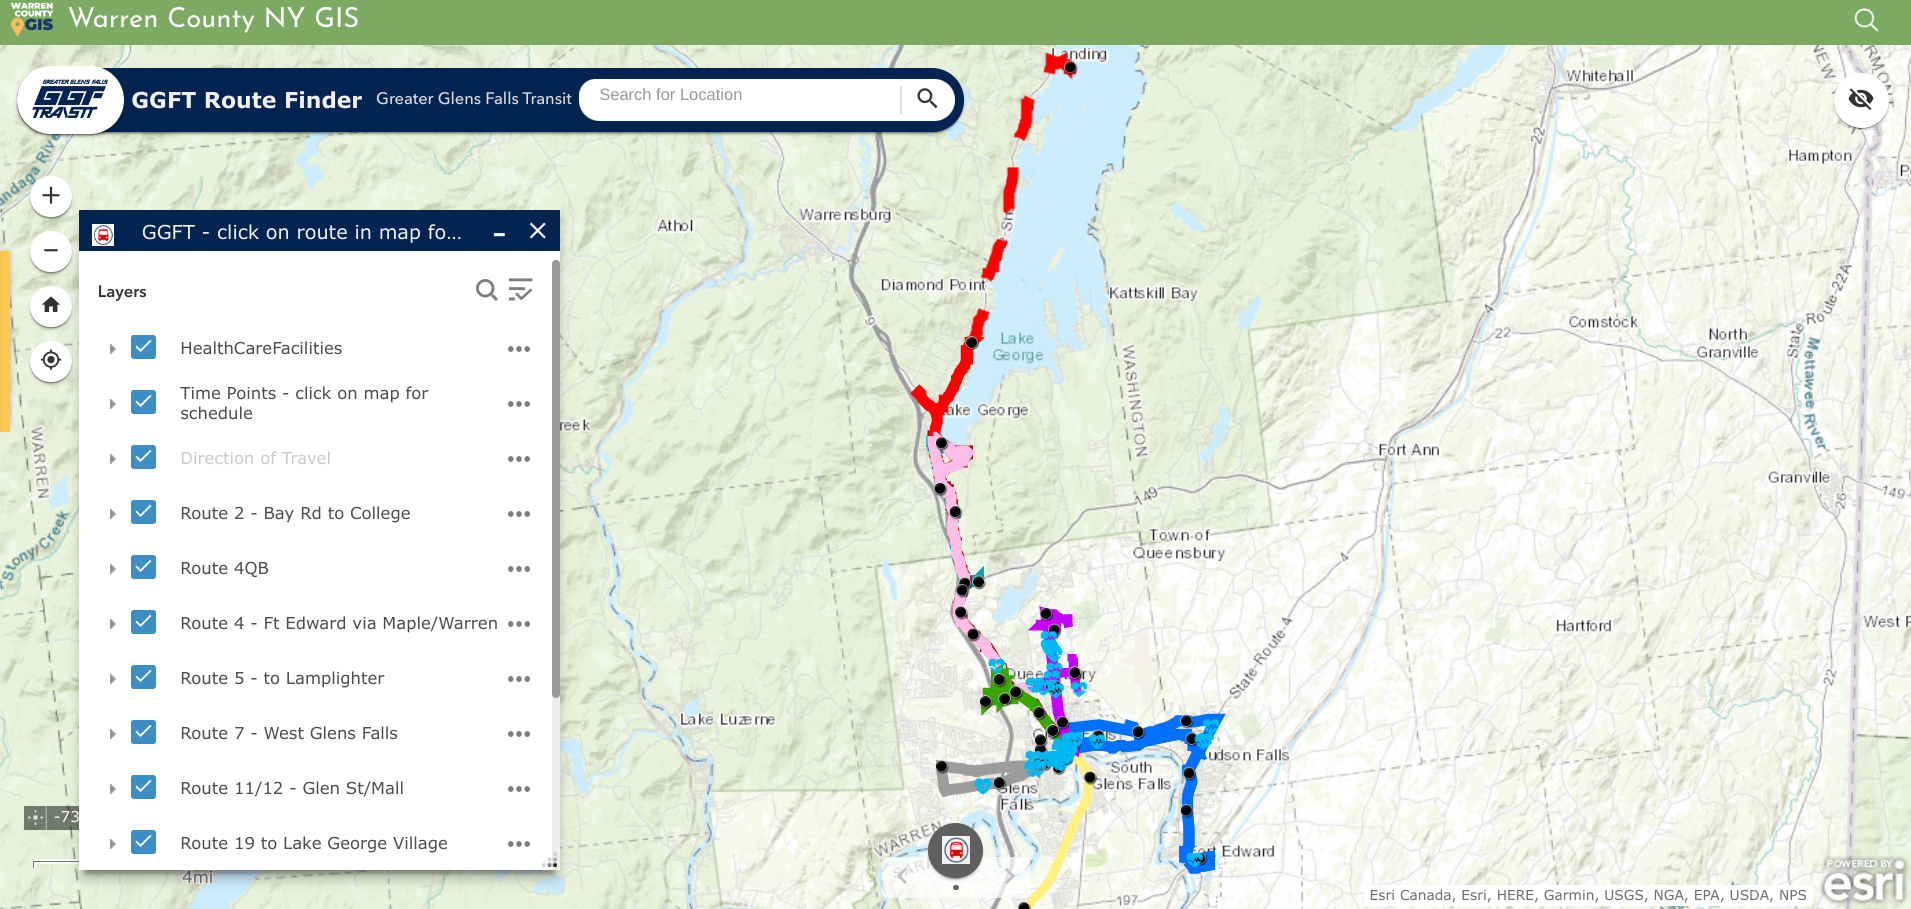
Geospatial viewers are excellent for publishing public transportation systems content. In addition to making time tables and schedules available, ones such as the GGFT also include important public sites such as health care facilities.

Today the COVID Hub is the most popular app though much simplified from early COVID and no longer maintained by the GIS team.   It’s had around 1.5 million views  since its inception in April 2020 – not bad for a county with a population of 64,000   The next most popular is the parcel viewer app (Community Map), which gets about 12k views a month.  After that, the First Wilderness website (about 7k views a month) and the Recreation Mapper which gets a couple hundred views a day, higher in the summer.  Warren County’s primary industry is tourism and is an outdoor recreation destination, so trail maps and recreational resources are popular content and Sara and Amanda spend a substantial amount of time creating and maintaining recreation data and providing access to it.
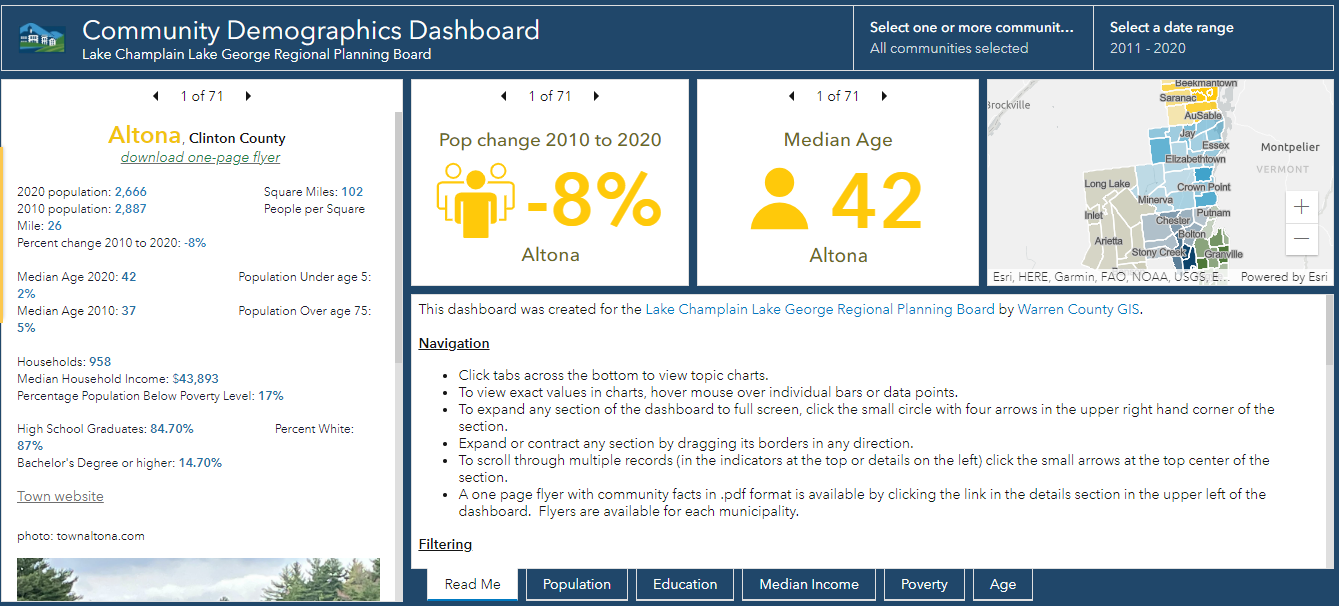
Warren County GIS provides technical support to the Lake Champlain Lake George Regional Planning Board which extends beyond the Warren County footprint. This viewer contains both American Community Survey and 2020 Census data for areas in the five north country counties covered by the Regional Planning Board

Though the application was closed in August, another public facing app focused on the American Recovery Plan Act (ARPA).  Survey123 was customized to create an application for those organizations interested in applying for ARPA funding.  The applications were made available to committee members for review through a Dashboard, and scoring was completed using another Survey123 form.
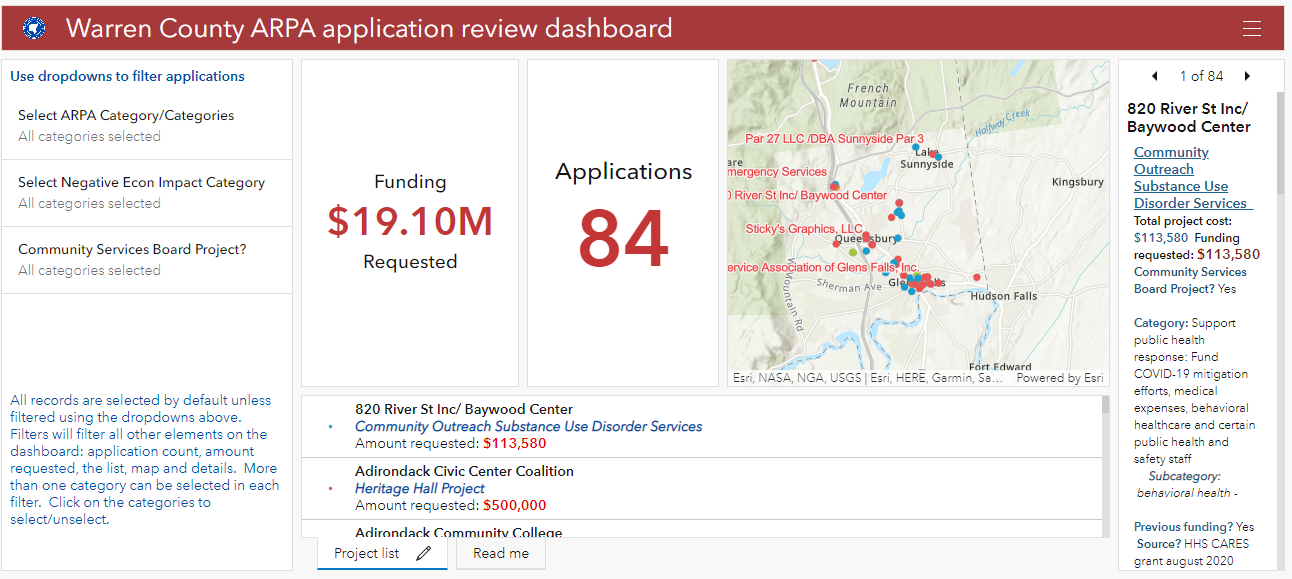
American Recovery Plan Act (ARPA) grant monies provides funding for investment in a wide ranges of community programs and services including geospatial efforts in the rehabilitation and mapping of infrastructure systems.

Sara’s Law

There probably aren’t many geospatial professionals working today across the Empire State that are familiar with Sara’s own little piece of New York State GIS history.  The year was 2002 and it was during her first stint with Warren County.  While using a GPS unit to map the locations of fire hydrants in the North Creek area, she was “challenged” by the professional surveying community of mapping features in a manner/way she was not qualified to do so.   Her post to New York State GIS listserve at the time describing the events read:

“In January, I(Sara) was contacted by an investigator from the New York State Education Department’s Office of Professional Discipline.  They had received a complaint from a surveyor stating that I was surveying without a license.  I was using a Trimble Pathfinder Pro XR GPS unit to collect fire hydrant locations and then plot them on a reference map.  Two investigators met with myself, our planning director, and our county attorney.  The investigators were unfamiliar with GPS and GIS and were basically on a fact-finding mission.  The investigation has progressed, and today we met with the two investigators, an attorney from the Office for Professional Discipline and a surveyor from the New York State Board of Licensed Engineers and Land Surveyors.  The state’s attorney told us at the beginning of the meeting that after reviewing the facts in the case, they do feel that we are guilty of practicing surveying without a license.  She then gave our county attorney a chance to state our case, which I thought he did very well. We were informed that the board will make a decision within the next week.”

At the time, it WAS a really big deal in the statewide geospatial and surveying communities – particularly New York State Association of Professional Land Surveyors (NYSAPLS) and the subject of much discussion and debate.  Significant in that it marked, for the first time, the visible intersection of emerging GIS/geospatial technologies and the professional discipline of surveying – and by extension, engineering in New York State.    While legislation (A01927 & S04396) was proposed in the 2007/2008 timeframe looking to “enhance the definition of land surveying with current standards and tools, i.e., GPS”, nothing was ultimately passed.  And along the way over the course of several years, the discussion and the proposed legislation became known as “Sara’s Law”.  

Little did she know the backpack GPS unit she was using in 2001 in North Creek would one day be the beginning of bringing these different, but similar geospatial technologies together as they are today.   Sara’s place in NYS GIS lore is secure.  

Summary

In addition to the broad presence the Warren County GIS program has throughout county government, it also represents the great relationship and guidance county geospatial programs can provide and offer to local governments.   Local governments that often have both limited financial and technical resources can benefit greatly from county GIS which have technical expertise and infrastructure in place.  A model that can be replicated in other areas across New York State.   

Contact

Sara Frankenfeld
GIS Administrator
Warren County GIS
Warren County Municipal Building
Lake George, NY 12845
frankenfelds@warrencountyny.gov
518-761-6410

Geospatial Business Spotlight: Adirondack Research

Location:                      Saranac Lake, New York

Website:                       https://www.adkres.org

Employees:                  3 Full-Time / 6 Seasonal

Established:                 2012

The Company

Adirondack Research is a small business located in Saranac Lake which focuses on building expert-backed and science based geospatial solutions.  Currently the firm’s primary focus is on applications and work involving invasive species, climate change, and socio-economics.  Adirondack Research staff includes GIS specialists, web developers, and field technicians and the company produces a retail line of recreation and way-finding maps under the brand Green Goat Maps.

Geospatial software used inside the company  includes ArcGIS Pro on the desktop and ArcGIS Online for a variety of web maps and viewers.  Field data collection is also supported by ESRI tools including Collector and Survey123.  For hardcopy map production both, Adobe Illustrator and Adobe InDesign are used.

Adirondack Research’s Director is Ezra Schwartzberg who received his undergraduate degree from SUNY College of Environmental Science and Forestry (ESF),  graduate degree from University of Kentucky, a doctorate in Entomology  from Penn State and additional post-doctorate work at the University of Wisconsin.

To date,  Adirondack Research clients include the U.S. Forest Service, Adirondack Council, Lake Placid Land Conservancy, Food and Agriculture Organization of the United Nations, U.S. Department of Agriculture, ADK Action, the New York State Department of Environmental Conservation which it has contracted for several invasive species projects, and others.   While most of Adirondack Research’s work is focused in New York State and across New England, their work has taken the firm to Lebanon as well as assisting to the development of a science curriculum for elementary schools in China.

Geospatial Products and Services

  • Environmental mapping using geographic information systems (GIS)
  • Biological inventories
  • Field experiment logistics
  • Ecosystem services assessment
  • Long-term ecosystem monitoring
  • Invasive pest management planning and analysis
  • Comprehensive management plans
  • Public outreach and stakeholder engagement
  • Citizen science
  • Grant writing
  • Expert witness testimony

Schwartzberg uses research expertise to guide processes, including program design, data analysis and project evaluation.  By combining ecological research with print and digital media, Adirondack Research is able to communicate science to help our clients reach their policy goals.

Illustrative projects include:

Surveying Adirondack Lakes for Invasive Species

Over the past several summer field seasons of 2018 – 2020, Adirondack Research was contracted by the Nature Conservancy’s Adirondack Park Invasive Plant Program (APIPP) to survey lakes throughout the Adirondacks.  Data collected during these surveys was used to produce individualized lake maps of aquatic invasive species (AIS) distribution. Objectives for these efforts were twofold:

  1. Detect and delineate any new or existing invasive plant or animal infestations within prioritized lakes.
  2. Utilize a Lowrance ELITE-7Ti fishfinder to map the vegetation beds, contour lines and bottom substrate hardness of a select set of those lakes as a way to gather important data on plant distribution and other physical parameters that influence aquatic plant invasion.

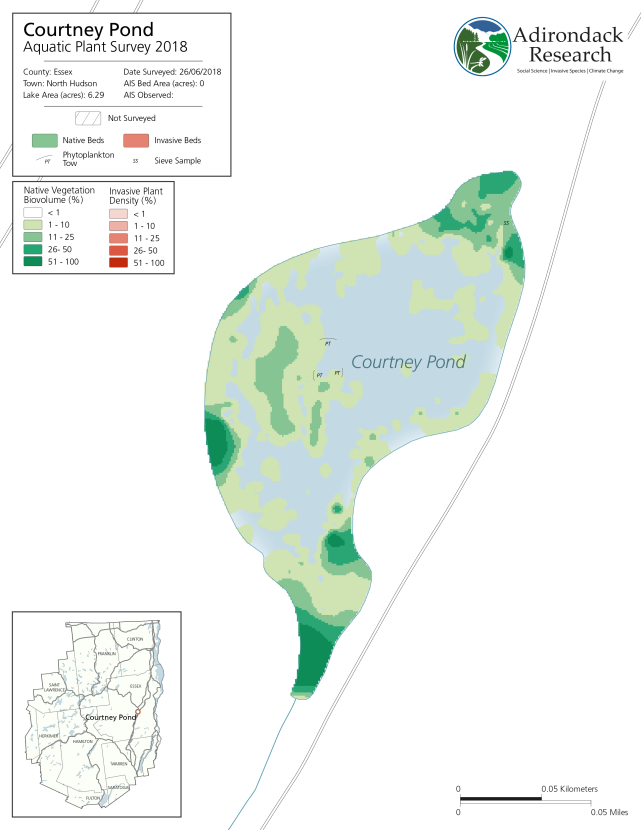
In 2018, Courtney Pond in Essex County was the first year this pond was surveyed and no AIS  detected.

Mapping invasive plant beds is accomplished using a suite of software and hardware tools including GPS, sonar detecting units, C-Map by BioBase, and ArcGIS Pro.  Data from sonar units such as Lawrance Fishfinders can be translated using third party software platforms, including C-Map BioBase and ReefMaster into a format which can be interpolated with ArcGIS Pro to create visualizations of the lake bottom.  This enables staff to assess exactly where an AIS infestation is located within a larger bed of native plants and useful overtime to monitor AIS beds and their spread.  Raster layers generated as part of the work flow are then used to generate maps in ArcGIS Pro and Adobe Illustrator for final reports.  The 2019 report is complete with maps of all lakes or ponds surveyed and can be downloaded here.

Additional information on this and similar Adirondack Research invasive species projects, visit this page.

Lake Placid & Saranac Lake Winter Trails Map

While Adirondack Research makes maps for a variety of purposes to support  geospatial analysis,  ecological species distributions and for land acquisition and conservation easements, the firm also produces a line of recreation and way-finding maps under the brand Green Goat Maps.

As part of this effort, Green Goat Maps emphasizes responsible recreation and environmental stewardship by partnering with organizations to promote principles like Leave No Trace.  Maps also make reference to the proper etiquette for publicly accessible trails, how to prevent the spread of invasive species, and information and regulations specific to the areas covered in each map. Green Goat Maps has  partnered with organizations such as Barkeater Trails Alliance, the Adirondack Land Trust, and The Nature Conservancy Adirondacks in these efforts.

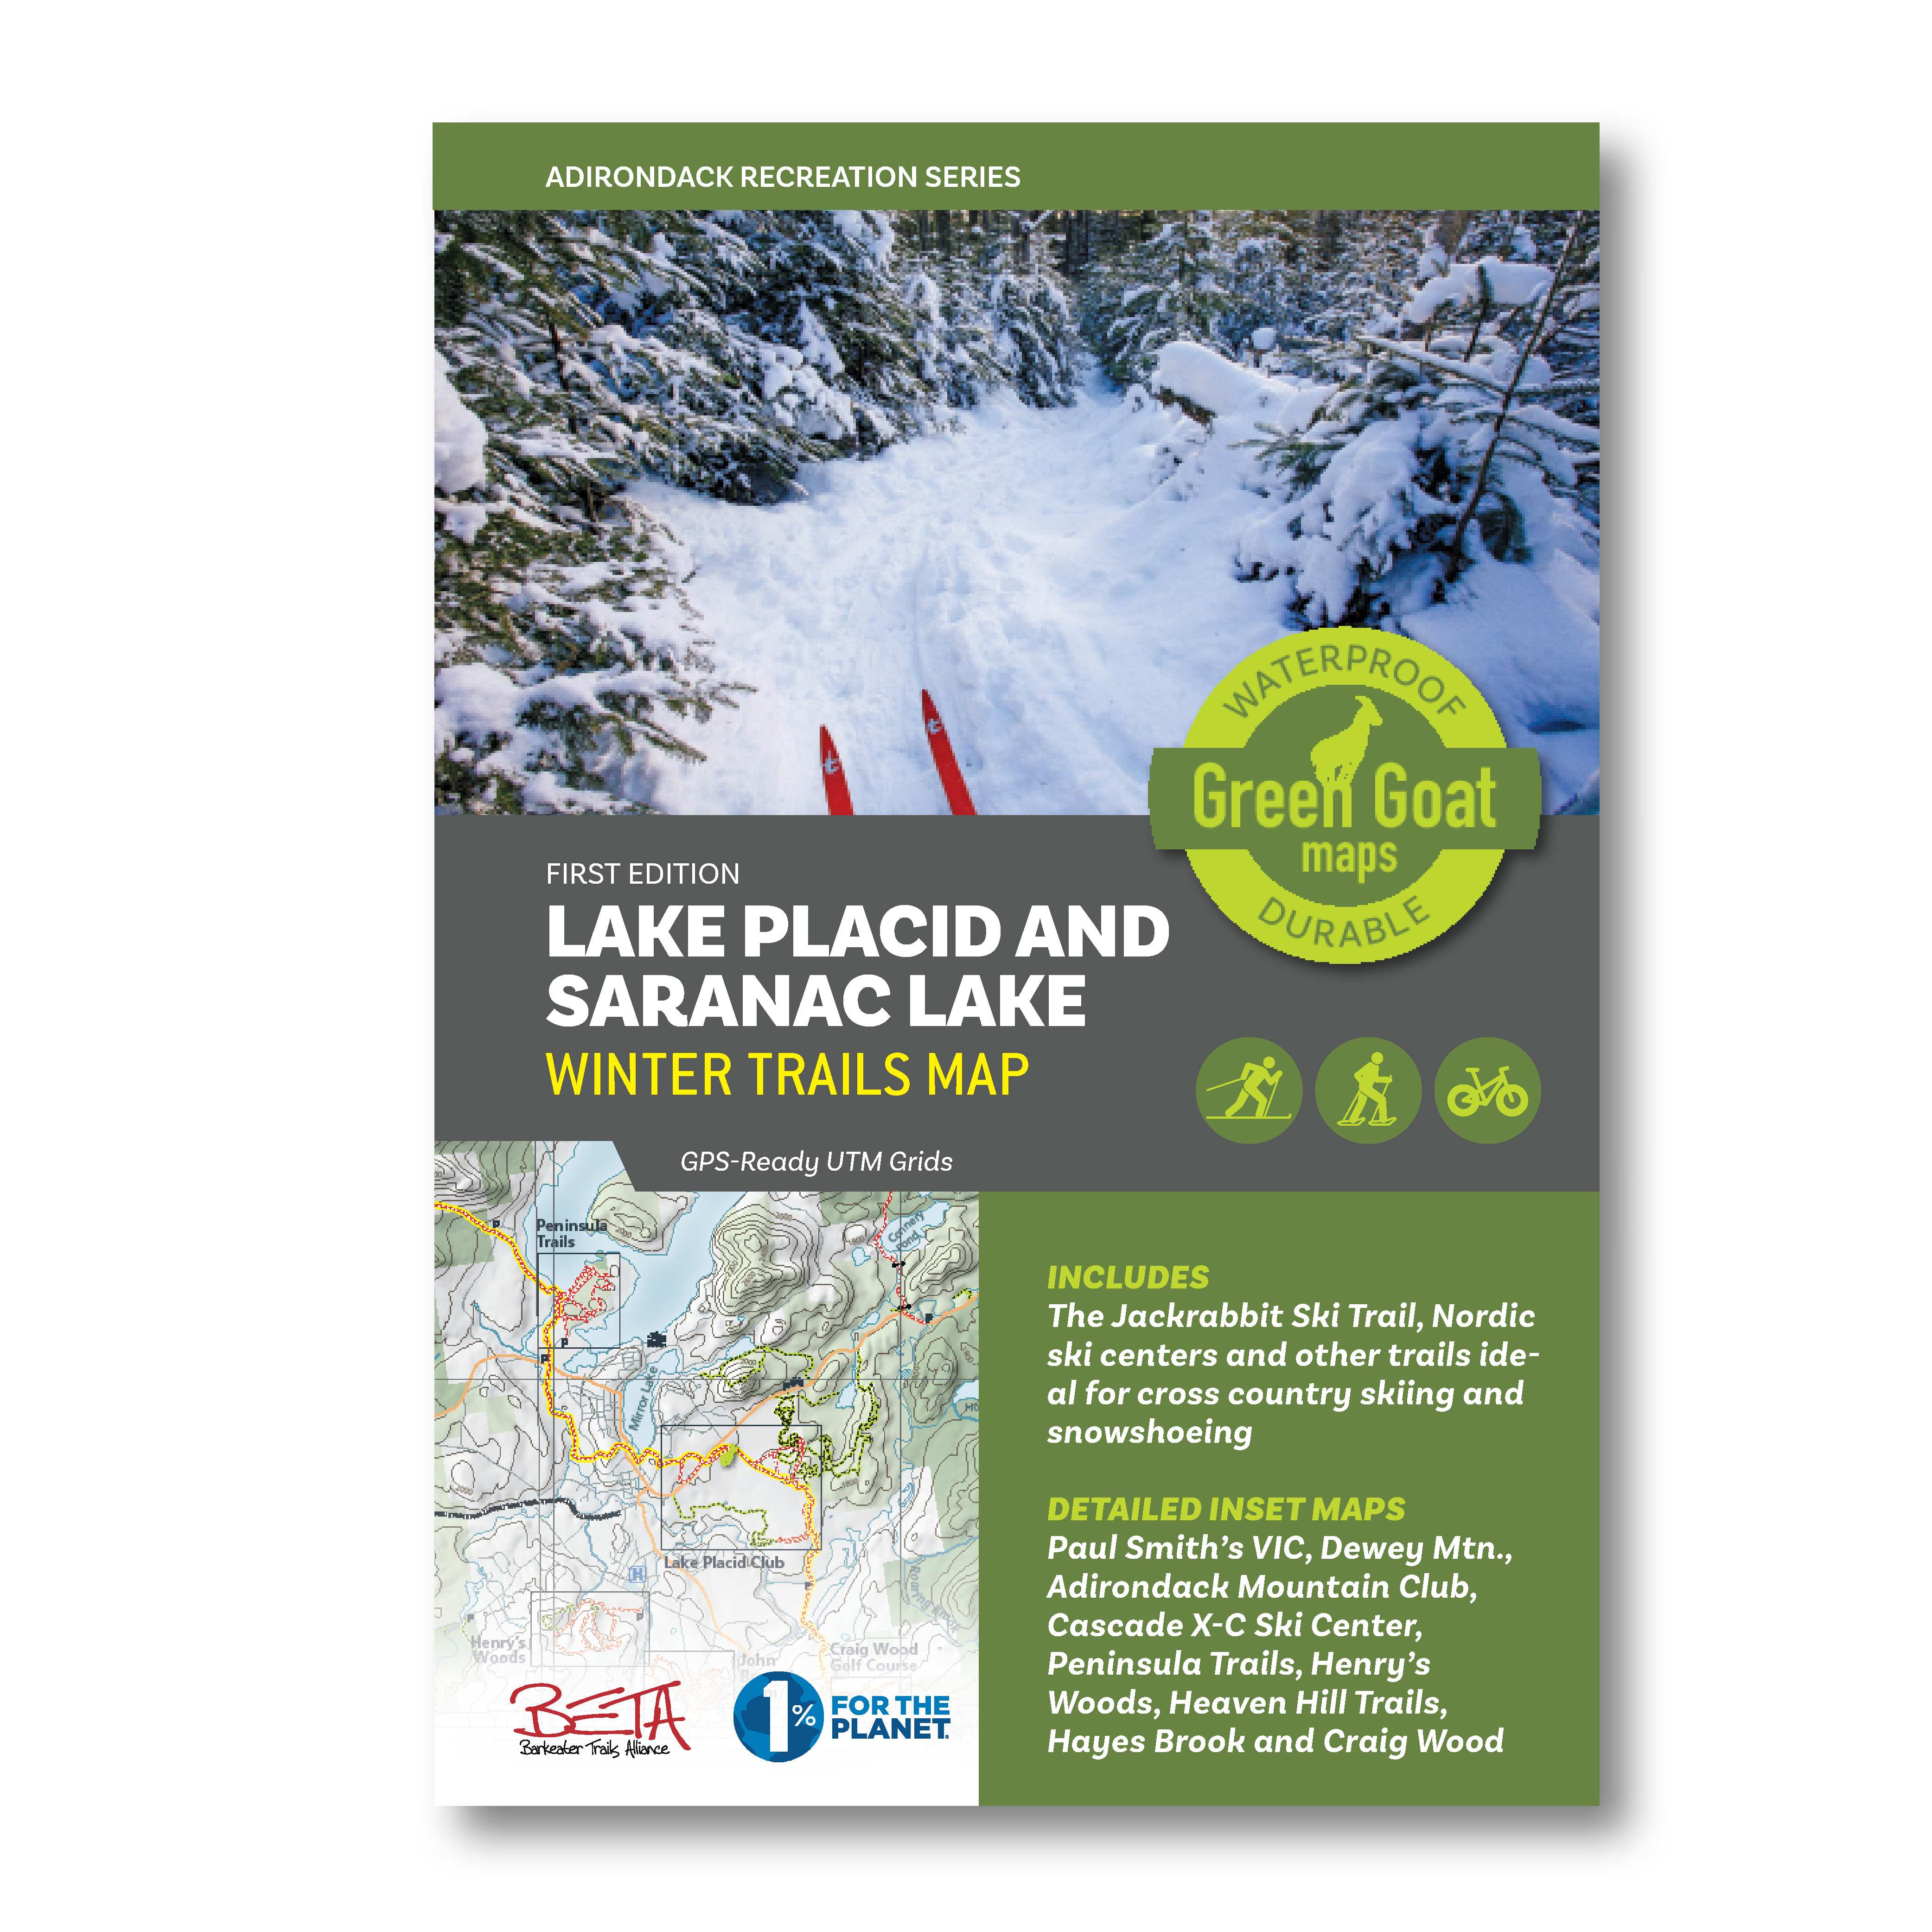
One example of a Green Goat map is the region’s “go-to” map for winter recreation – The Lake Placid and Saranac Lake Winter Trails Map  – which offers all of the area cross country ski, snowshoe and fat bike trails in one document.  The map highlights the Jackrabbit Ski Trail and covers ski trails from Paul Smiths to Wilmington including the popular Hayes Brook Truck Trail, Deer Pond Trails, Moose Pond Trail, Brewster Peninsula Trails, Henry’s Woods, Heaven Hill and more.  The map also includes commercial ski centers, including the Paul Smith’s College VIC, Dewey Mountain Recreation Center, Cascade X-C Ski Center and Mt. Van Hoevenberg.  For the Winter Trails Map, Adirondack Research also added trails on private and municipal land with permissions well as adding gates and parking areas which were mapped from ground research. The top banner on each map inset also shows info about what activities people can do on each individual trail network

Additionally, Green Goat gives 1% back on the sale of its maps to nonprofits through 1% for the Planet.

For more  information on this and similar Green Goat Maps products, visit this page.

Mapping Broadband Infrastructure for Essex County

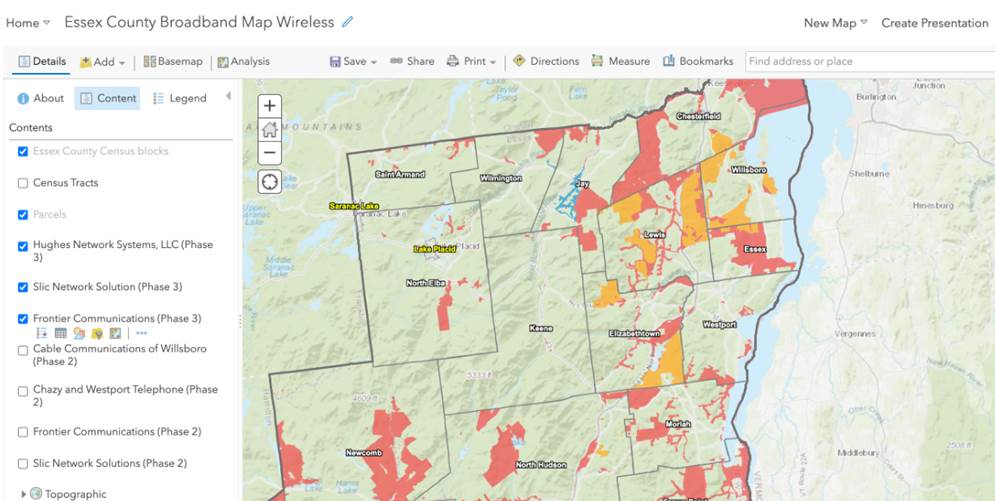
A current project Adirondack Research is working on is with Essex County (as well as four other counties) and local community leaders towards designing and implementing web mapping  visualization tools which will help support and guide expanded broadband installation across the County.   These easy-to-use geospatial tools are intended to be used by local officials in multiple governments to pinpoint gaps in infrastructure coverage. Other aspects of the project include mapping the boundaries of current broadband contracts with providers across the County, checking and verifying property addresses, and performing quality assurance on plan of record build-outs.

Broadband is only available is specific areas of Essex County. Mapping at the street level by Adirondack Research will enable government officials to work with broadband providers to expand coverage.

Contact:

Ezra Schwartzberg, PhD
Adirondack Research
73 Church St
Saranac Lake, NY 12983
www.akdres.org

Game Time: Mapping Moose in New York State

Introduction

A rare treat in eastern upstate New York, mostly in the Adirondacks, although sometimes in the Taconic Highlands along the Massachusetts and Vermont borders and within the Catskills, is to see moose in the wild.  Moose (Alces alces) are the largest member of the deer family (Cervidae) and the largest land mammal in New York State. Having been absent from the Empire State since the 1860s, the species began to reenter the state on a continuous basis in the 1980s.   While re-establishment of the moose population in New York has been viewed and supported as a positive sign of a healthier, more complete natural ecosystem,  it does not come without a range of potential problems associated with their return and the need for proactive management and monitoring by New York State Department of Environmental Conservation (DEC) wildlife biologists and researchers.

So in 2020 it should come as no surprise that wildlife biologists in New York State – and around the world – are using geospatial technologies to support their work.  In addition to estimating moose population size, New York’s wildlife biologists and scientists also focus on improving moose survival and reproductive rates and to assess their diet and health.  Assisting the DEC’s work towards researching moose habitat and resource requirements is David W. Kramer, Research Scientist, in the Division of Fish and Wildlife.  The toolkit which augments his moose research includes a mixture of GPS, remote sensing imagery, a variety of GIS data layers, and  both ESRI and “R” software.  R being a free, open source software package for statistical computing and graphics commonly used in the research community.

Population Counts and Observations

To date, Mr. Kramer and colleagues have been observing the locations of 26 moose which were collared with either a  Lotek or Telonics GPS unit which can store data “on board” the collar that can then be retrieved by getting the collar back or by getting close enough to the moose to download the data to a receiver. “Uplink” collars can store data on the collar as a backup, but also send daily data uploads via satellite and are then stored online.  Moose are captured (to put the collar on) by a crew which “net-gun” the animal from a helicopter. For their research, DEC staff focuses on female moose (cows) for two reasons:  (1) wanting to track of how many offspring each cow has; the collars facilitate the “following” of the females in the summer to count calves, and (2) male moose (bulls) go through physiological and body changes during the same period that do not make the collaring of males practical or even unsafe.  Data associated with the collars are important in analyzing survival and calving success as well as the geography associated with habitat selection.

Continue reading

The Geography of an Adirondack High Peaks Unsupported Thru-Hike Record

Background

Since early July this summer when our youngest son Lukas and close friend Mike Jock completed and established  a new record for an unsupported thru-hike of the 46 Adirondack High Peaks, I’ve been asked by various friends and colleagues across the region (who became aware of the accomplishment) as to whether or not any professional geospatial/GIS technology was used in some capacity in supporting the effort.   Each time my humbling answer has been pretty much the same:  Not Really.  However, they did carry some new gadgetry which is currently used ubiquitously across the adventure and extreme sports landscape to collect data that was used to authenticate their achievement.  But more on that later.

Starting their trek at the trail head to Seward Mountain at 3:30 AM Thursday, June 27th on the west side of the Adirondacks, the two covered the 46 High Peaks in 7 days, 2 hours, and 52 minutes finishing by summitting Mount Esther, on the northern shoulder of Whiteface shortly after 3 AM on July 4th. Ultimately making it down to the Mount Ester trail head at 6:20 AM to complete the trip.   All said, nearly 212 miles and 70,000 feet gained in elevation – more than twice the elevation of Mt. Everest.  They averaged well over a marathon a day, covering some 25-30 miles. On the final day they kept moving for more than 23 hours covering 45 miles.

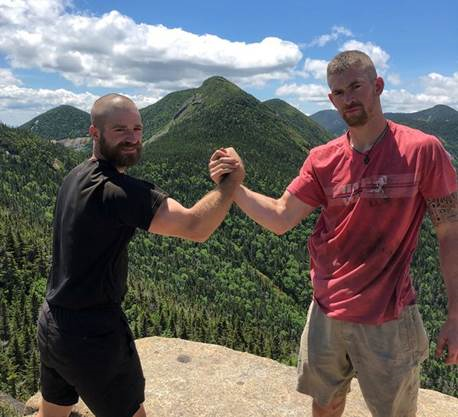
Michael, left, and Lukas at the summit of Armstrong Mountain with Gothics Mountain in the background. The two were soccer teammates at SUNY Cortland. Mike King photo.

Preparation was more old school than one would think.  Nothing in this space replaces on-the-ground knowledge of the trails, trail junctions, where and when to bushwhack, locations of rock cairns for reference points, as well as planning and hiking/testing certain stretches of the route ahead of time.  Yeah, practice runs.  Luke had the benefit of many years of experience having first started ADK trail hiking since he was barely in kindergarten.  Like many other young children, his first “mountain” being Mt. Jo overlooking Heart Lake adjacent Adirondack Loj.  Safe to assume that through the family ties, his spatial orientation has always been pretty decent. Mike, a local boy, grew up in the Plattsburgh area.

This was their third attempt.   And such accomplishments don’t come without the element of good fortune avoiding injuries (which was the case in 2018) and a bunch of days with generally decent weather.  The 2018 attempt was also impacted due to an encounter with a black bear.  Yet another ADK backcountry hiker lesson in overnight food storage.

Given the enormity, location, and challenges of the effort, it would clearly not be safe, if not irresponsible,  to rely solely on the new generation of lightweight/handheld navigational devices as a means to lead one through the Adirondack Mountain wilderness.  There is no substitute for first-hand knowledge of the trail network and a pre-determined plan.  They carried only the essentials such as lighweight sleeping bags, tents, change of clothing, raingear, first aid/basic emergency gear, water filters,  and food.  Counting every ounce in keeping their backpacks to about 40 pounds.  Even omitting the weight of gas canisters/gas stove and in doing so did not prepare anything hot the entire trip.  Zero assistance.

Cool Gadgets

It’s amazing how far the adventure mapping and video/data collection market has evolved since GoPro technology was introduced nearly a decade ago, if not earlier.  The ability to playback Mike and Luke’s accomplishment – made available below via a series of links – is amazingly made possible by just a one simple mobile (wearable) component.  They used a Garmin Fenix 5 GPS Watch to collect X,Y and elevation data which, based on wireless connectivity, automatically uploads to Garmin Connect.  Upon completion of their hike, the entire trip dataset was downloaded to Relive an outdoor 3D video website which allows further rendering and interactive use of the data.    Two Anker PowerCore 26800 pre-charged power banks kept their phones and Garmin device charged.   Of sufficient size to recharge their phones/devices numerous times over.  They took two but in fact only needed one.   The Garmin app also collects heart rate, estimated calories burned, pace (minutes per mile), elevataion gain/loss, and total daily distance – all of which is made available in interactive and graphic form.  In addition to the default Google basemap, data can be rendered on other base maps including satellite, terrain, OpenStreetMap, and Here.  Amazingly compact, yet powerful tools.

The Daily Numbers

The following section includes a brief narrative – Mike’s own words- and links which can be used to highlight trail and body metrics as well as mapping visuals for each hiking day.  For those familiar with hiking and trekking in the Adirondacks, the visuals certainly help put Luke and Mike’s daily segments in better perspective.

Hold on to your seats.

Thursday June 27

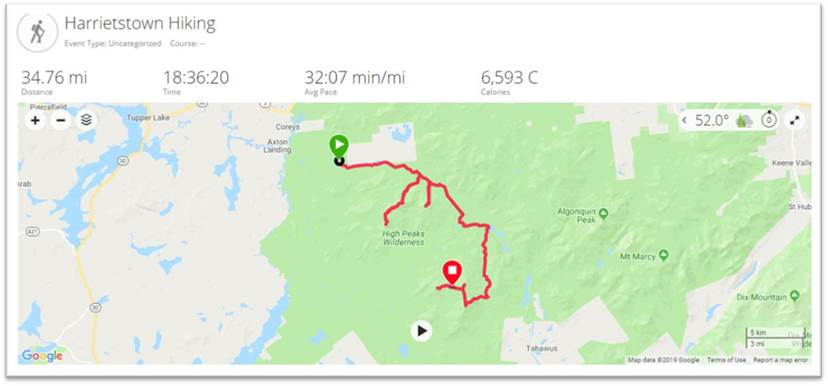
Hiker Notes: 3:30 am depart from Corey’s Road.   Day consisted of seven mountains: Seward, Donaldson, Emmons, Seymour, Santanoni, Panther & Couchsachraga. Out and backed the first four.  Trekked approximately 10 miles to Santanoni range.  Set up camp at the base, then we went up the expressway to summit Santanoni first, followed by Panther, and then finished with Couchsachraga. We came down the Panther brook trail before staying at camp at base of expressway again. Approximately 37.84 miles.

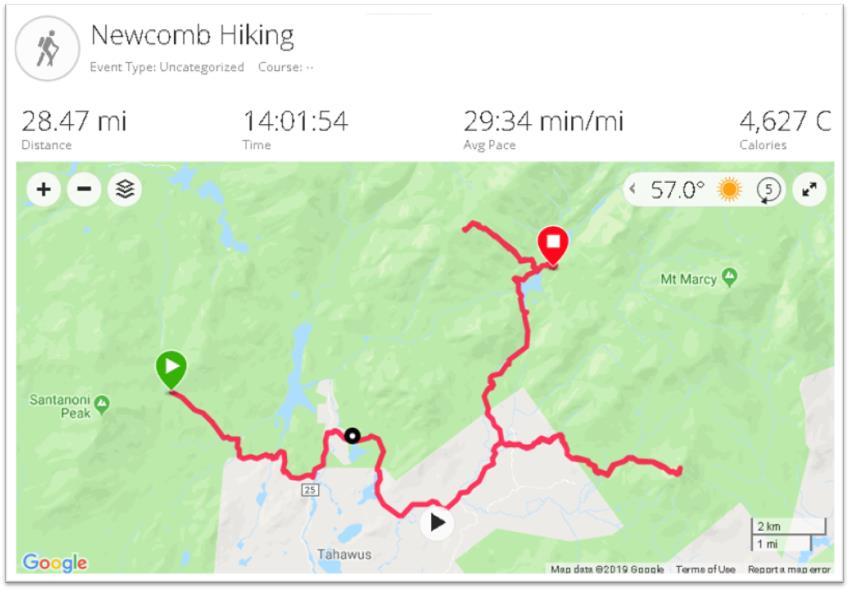
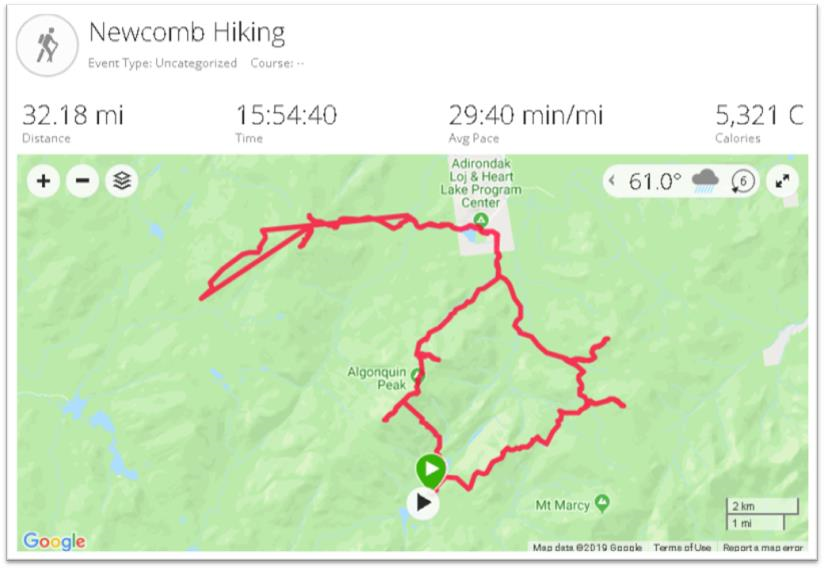
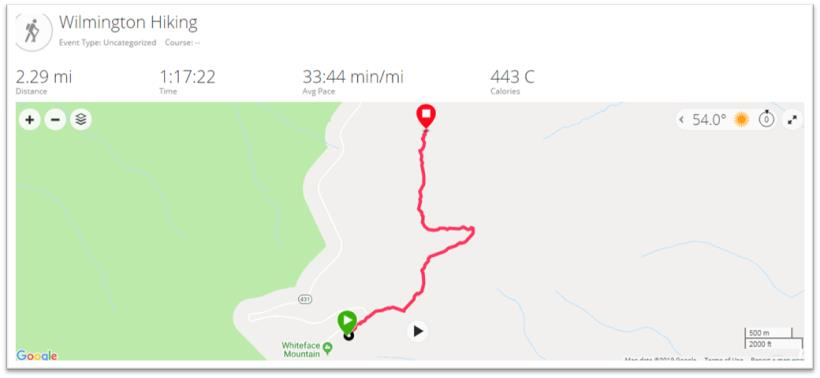
Instructions for all similar images below: Click on map for additional graphics and daily metrics. Or click the black triangle button at the bottom of the screen to see hiker movement over the course of the day.

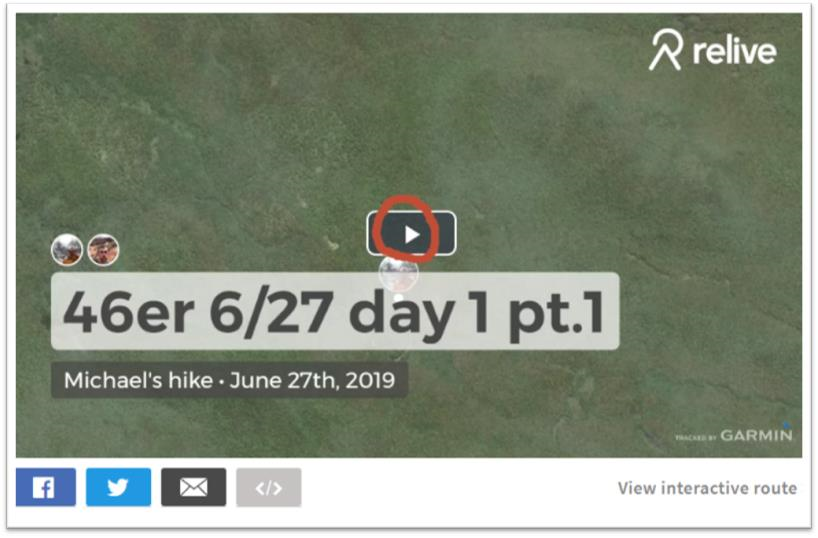
Instructions for all similar Relive 3D Interactive links below: Click on the icon circled in red to see daily hiker movement on top of a 3D base map and associated photos. Clicking on the “View Interactive Route” button enables the ability to interact with the map and trail data “twirling” the image to see from the north, east, south, and west perspective.

Friday June 28

Hiker Notes: From camp, hiked over to Allen mountain, out and backed it before moving up towards Colden/Avalanche Lakes. We out and backed Mount Marshall before setting up camp over the dam at Lake Colden. We summited two mountains and covered approximately 28.47 miles.

June 28thRelive 3D Interactive

Saturday June 29

Hiker Notes: The ADK Loj Loop day. Summitting eight mountains and doing a big circle before returning to the same place we camped the night before. We started by going up the backside of Colden, then Tabletop, Phelps, Street, Nye, Wright, Algonquin and finishing on Iroquis. Approximately 32.18 miles

Note: The only day “noise” was either user generated or introduced by the Garmin device itself. In the vicinity of Street and Nye – Illustrated by the “straight” additional red line. Also reflected in the Relive 3D viewer.

June 29thRelive 3D Interactive

Sunday June 30

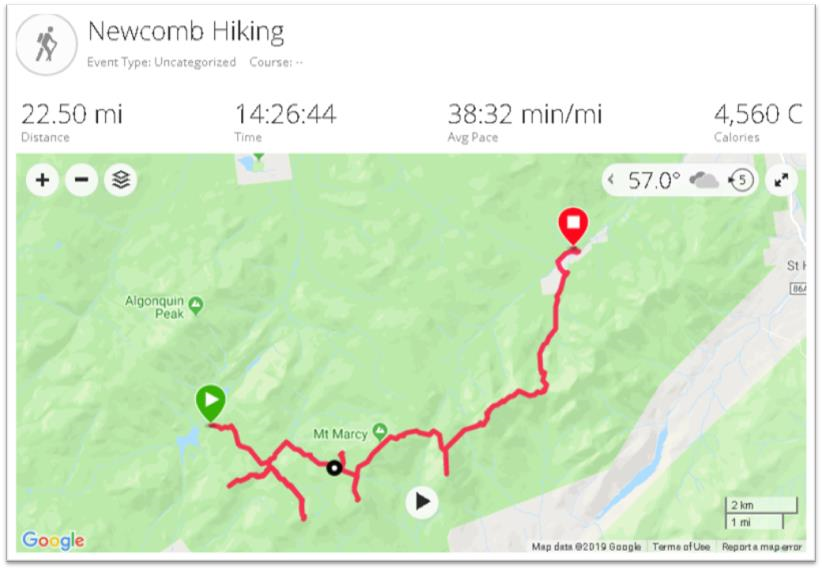
Hiker Notes:   Audible day. Started by moving to the base of Cliff and Redfield (out and bacs), then trekking up towards Gray, Skylight, Marcy, Haystack, Basin and finishing with Saddleback. Due to it raining all day, made the game time decision to check out and head towards Johns Brook Lodge where we camped at the trailhead of Big Slide Mountain (setting ourselves up the next day to finish the Great Range and start moving east). Summitted eight mountains and covered approximately 22.5 miles.

June 30th:  Relive 3D Interactive

Monday July 1

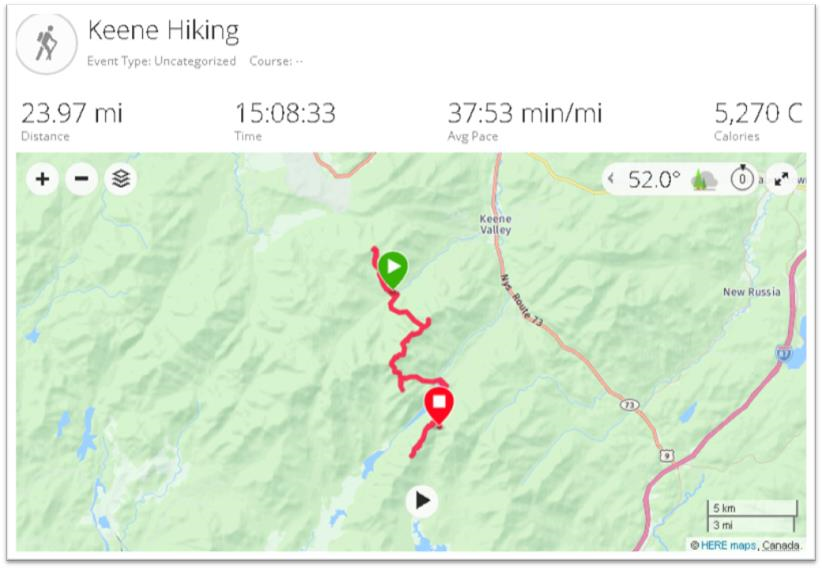
Hiker Notes:  Out and backed Big Slide early in the AM, before climbing up towards Great Range. First we summited Lower Wolf Jaw, then Upper Wolf Jaw, Armstrong, Gothics and Sawteeth. We then headed down trail to Lower Ausable Lake. Next we did Colvin and Blake before camping between those two mountains.   In total we summited eight peaks again and covered 23.97 miles.

July 1st:  Relive 3D Interactive

Tuesday July 2

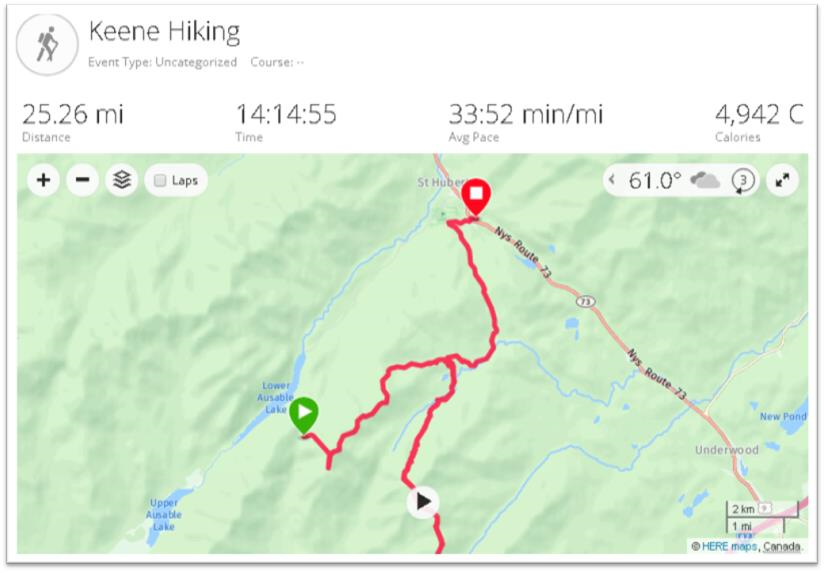
Hiker Notes: Started by ascending Nippletop, moved on over to Dial, then bushwhacked down towards the Dix Range. Once we got down from bushwhack/brook we dropped bags and then out and backed the entire Dix Range: Dix, Hough, South Dix, Grace Peak & Macomb. From there we got our bags again and then moved our stuff over to Roaring Brook and the base of Giant Mountain. In total we covered 25.26 miles and summitted seven peaks.

July 2nd:  Relive 3D Interactive

 Wednesday July 3

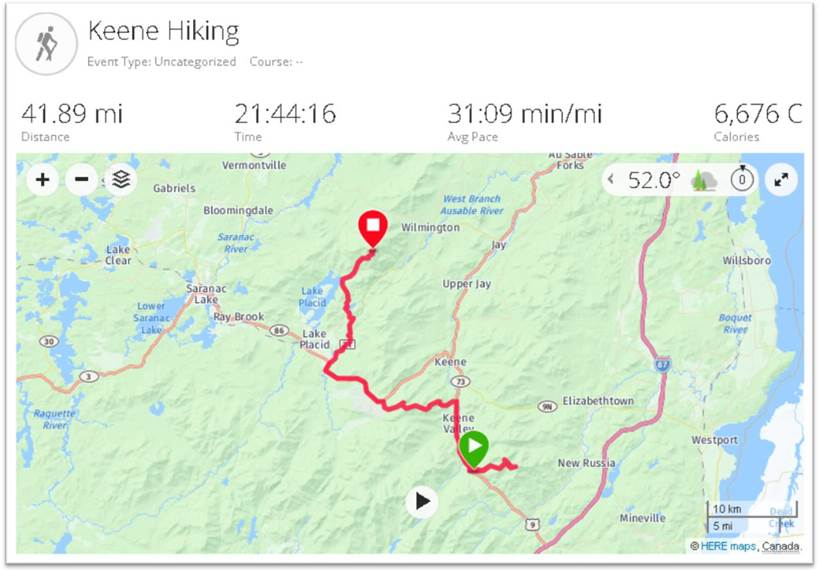
Hiker Notes:  The 24 hour day. Woke up at 3 am and went to get Giant and Rocky Ridge Peak (out and backs). From there we picked up our stuff again and schlepped ourselves 5.5 miles down route 73 toward Marcy airfield. Next up was cutting from one side of 73 to the Lake Placid side of 73 along the ridge trail that summitted Porter and Cascade Mountains. Off of those we had then a 10 mile stretch on route 73 and then River Road towards the trai lhead to Whiteface mountain. Using the trail by Connery pond we entered that portion at 1030 PM and was able to summit both Whiteface and then Esther by 3:15 am. About 23 hour and 30 minutes of moving time we summitted our final 6 peaks and covered 44.18 miles. Passed out for an hour and reached Memorial Highway by 06:22 AM, where a time-stamped photo was taken.

July 3nd:  Relive 3D Interactive (Part 1)  Incredible day!!

July 4th:  Relive 3D Interactive (Part 2)

Summary

Quite an effort  and on top of setting the record, between this trip and last year’s attempt, the two helped raise nearly $18,000 for the Dubin Breast Center at Mount Sinai Hospital in New York.  Their accomplishment was covered by Backpacker Magazine as well as a selected number of upstate New York online publications (UpstateNewYork and NNY360) among others.  The articles are generally similar in content though do offer more details about food and other daily nuances/items which I omitted here.  Choosing rather to highlight and focus on the immense geographic element of the effort.

Both Luke and Mike are personal trainers living and working out of New York City.  More information can be found on their website Team Adventure Portal.

10+ Questions: Eileen Allen

Eileen Allen is a familiar and respected face across the New York State GIS landscape.  First a foremost an instructor at SUNY Plattsburgh, she has instructed and mentored hundreds of students who are now part of the statewide geospatial fabric.  And in her spare time she has participated and contributed to numerous statewide GIS advisory committees over the past 20 years.  Always upbeat and a pleasure to work with, she is most certainly a first ballot lock for the GIS wing at the Hall of Fame in Cooperstown.  

eSpatiallyNewYork:  How long have you been at SUNY Plattsburgh?

Allen:  I was an undergraduate student at Plattsburgh State from 1973-1977.  In August 1984, I was hired to help finish a remote sensing research grant mapping historical beaver locations in the Adirondacks.  I’ve been here ever since.

eSpatiallyNewYork:  Where are you originally from and tell us about your journey that led to Plattsburgh.

Allen:  Both my husband and I grew up in Plattsburgh.  Fortunately there were state and federal programs to help me get a college education.  After college at SUNY Plattsburgh, I went to McGill and worked on a Master’s in physical geography.  Everything seemed to go wrong with my advisor and the research.  It was hard but necessary to leave there.   Fortunately, I could use my McGill credits and finish a Master’s program in Natural Resources at SUNY Plattsburgh while I worked on research projects.  I thought about getting my PhD but I just didn’t end up going in that direction.   Besides, I liked the research projects I was working on too much!

eSpatiallyNewYork:  You’ve been associated with the GIS program at Plattsburgh since its origin.  How did it get started?  Who was involved?

Allen:  My involvement with teaching GIS developed out of research projects and the need to train student workers. Dr. Richard Lamb was instrumental in developing the GIS courses and a minor in addition to his planning courses and practice.  He started the GIS course in the late-1990s and by the early-2000s we would take turns teaching the Introduction to GIS class.  I took over all the GIS classes when he retired and the Remote Sensing courses when Dr. Donald Bogucki retired.

But there is more, because so many chance occurrences determine our path.  Also, it has been noted that many more women are in GIS than in other natural sciences.  When taking college classes, I was often one of a very few or the only female.  Many people think that because GIS is so collaborative, women often gravitate towards it.  This is certainly true for me.

As an undergraduate, I was interested in many things but was unsure what I would major in and tried out several paths.  I needed a Social Science course and Physical Geography was on the list, so I took it.  Drs. Donald Bogucki (Geography) and Gerhard Gruendling (Biology) were working on a pilot project mapping wetlands and demonstrated this in their classes.  The grant was to investigate the use of remote sensing to estimate the impact of regulating the Richelieu River (the outflow of Lake Champlain, NY-VT) because of flooding concerns in Quebec.  Dr. Bogucki showed some color infrared imagery of wetlands in Physical Geography class and I was totally flabbergasted!  I absolutely had to be involved with the project!  It took several days for me to get the courage up to ask if I could be part of the research.  It so happened that they needed someone to use a transit to establish ground control.  I had been working with my father, a land surveyor, for many years and was enlisted by Dr. Bogucki to help set out targets and map them.

In the early 1970’s, it was very unusual for an ecologist and a geomorphologist to work together.  That was part of the attraction, though, where many of my interests could be combined. By chance, at about the same time, the Environmental Science Program was started at SUNY Plattsburgh and I had found my academic home.  I continued to be part of the project mapping Lake Champlain wetlands using custom flown 70-mm imagery until my graduation.
Continue reading

Highest Lakes in New York State

While planning on some Summer 2017 High Peaks hikes and overnights with my sons, I got to thinking about some previous communications I had with long time colleagues John Barge at the Adirondack Park Agency and Doug Freehafer at the U.S.Geological Water Science Center in Troy about other state highest geographic features.   Most know about the “46ers” – a.k.a the 46 mountains in New York State above 4,000’.  (Yours truly having bagged about ½ of them.)  But what about other geographic features and facts that might make good trivia questions –  like what are the “highest” lakes and water bodies in the Empire State?

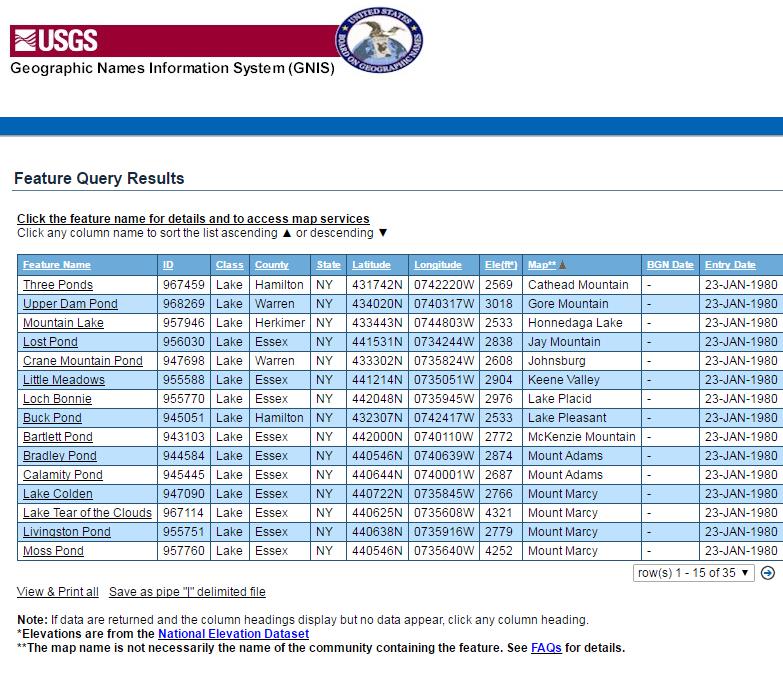
No problemo.  Doug pointed me to the U.S. Geological Survey Geographic Names Information System (GNIS) search engine in which I queried for all New York State lakes over 2,500’ and the search returned 35 lakes  based on the National Elevation Dataset.  Surprisingly not are all in the Adirondacks.

The GNIS query builder is easy-to-use and allows users to search on names for geographic features such as harbors, islands, harbors, basins, summits and much more.

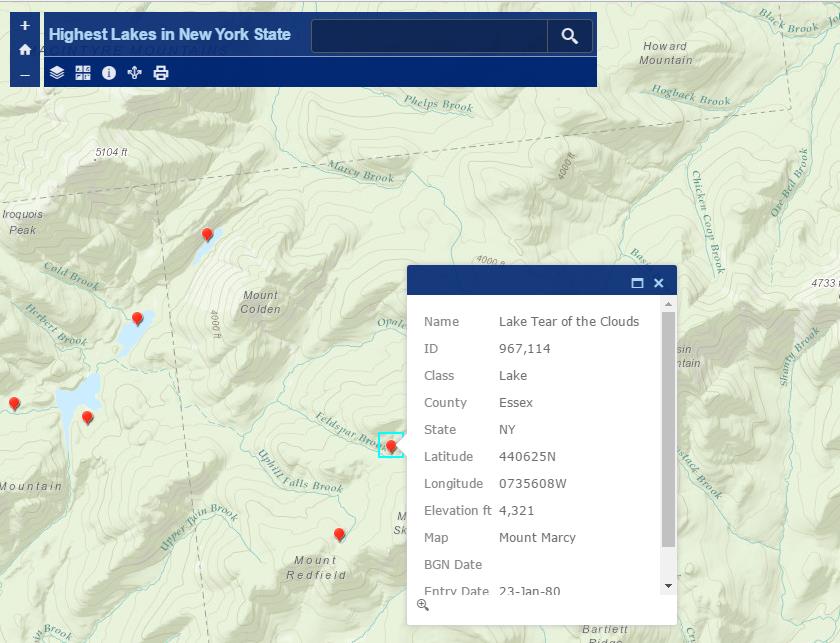
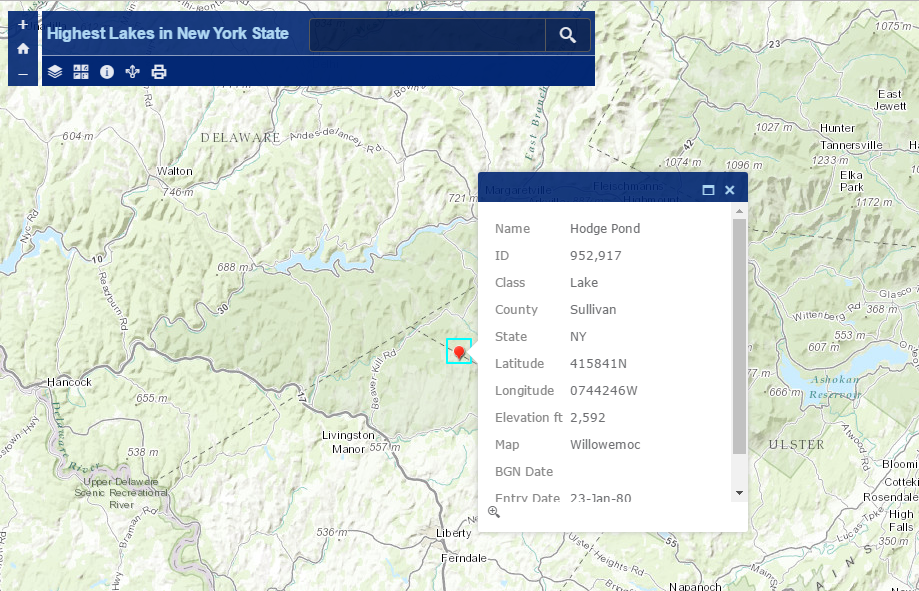
Saving the search results and converting to a spreadsheet, it’s easy enough to add the lake X,Ys to a  ArcGIS Online viewer (or any viewer of choice for that matter) called the Highest Lakes in New York State.   As shown in the following images, the highest lakes are located near Mt. Marcy (Lake Tear of the Clouds at 4,321’ and Moss Pond at 4,4,252’) with Hodge Pond showing up at 2,592’ (#26 highest)  much further south in Sullivan County.

Eight out the ten highest lakes are in Essex County though not all are found on the Mt.Marcy USGS quadrangle. What other quads are in play?

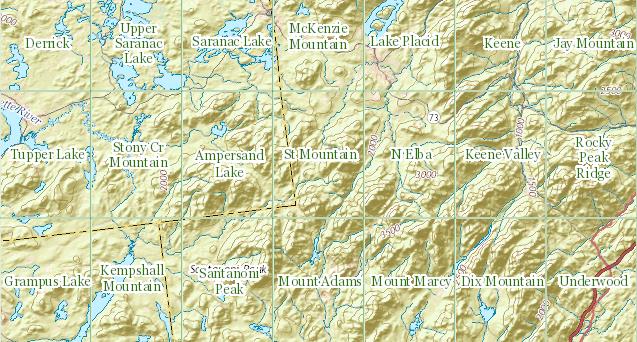
USGS 1:24,000 quadrangle grid covering the Adirondack High Peaks region from The National Map viewer application.

Won’t find any summer lifeguards on duty at these lakes and the water temperature probably won’t be the same as your shower water, but it’s nice to know if your back country trips might take you close enough to potential swimming or fishing holes?  (Our lastest route and trip manifest did not include any of these water bodies.)   GNIS is a great source of national and Empire State geographic features which we’ll occasionally explore in future eSpatiallyNewYork posts.

Enjoy your summer!