5 Barriers to Building GIS Programs in Small Governments in New York State

Some barriers instead might be considered missed opportunities but there continues to be specific issues which stifle geospatial growth

Over my 30+ years of managing the Westchester County GIS program, I worked extensively with local governments across the County.  Forty-three in all, ranging from Yonkers, now the third largest city in New York State to several villages which are little more than one-square mile in size such as Buchanan along the Hudson River with a population of 2,302 (2020 Census). All uniquely different in their attempts – and interests – to build geospatial capacity.  Some have been successful while many others have struggled for a myriad of reasons.  This is particularly true among the 23 villages.

Now “on the other side of the firewall” (thanks, Sue Knauss) and working for myself, I’ve been able to see and work further into the organizational framework of these smaller governments.  Confirming many of the observations I made while working with Westchester County that I believe inhibit the development of building geospatial programs at this level of government. Admittedly, the small Westchester County village just north of the Bronx is different in many ways from a small village in Chemung County and one could argue the sample size is too small to be reflective of the entire state of New York, but I would suggest these obstacles to geospatial development are conceptually very similar across the state.   Furthermore, the term “Village” is not necessarily synonymous with small government as the Village of Port Chester 2020 population here in Westchester County was 31,581 – larger than many towns across the state.  So as a point of reference for this article small governments generally mean those with a population of less than 5,000.  Plus or minus.

GIS implementation “how-to” articles, management and primer books, and cautionary experiences shared by software vendors and consultants often include recognized issues such as budget constraints, limited technical expertise, or the lack of a realistic, phased implementation plan, as major culprits in initiating geospatial efforts.   I experienced and witnessed many of these same reasons, though the following are five specific barriers which I believe have a major impact in building GIS programs in small governments across New York State. 

In no particular order:

  1.  Staff Continuity: On the urban fringes, professional staff, particularly in the front offices, turn over at an amazing rate.  Assistants to Village Administrators, Managers, and department heads/commissioners – those who are often tasked to coordinate or serve as a liaison to special projects covering several departments such as GIS implementation – are often on the move.    And it’s not just in the administrative offices where staff turnover is impactful, but also throughout key program offices and departments which touch on GIS implementation such as planning, assessment, public works, and water departments, among others.     Any successful GIS Manager will tell you one of the most important factors in building the program, or any new government initiative, is staff continuity.  Including those who are in charge of managing consultants involved in helping build the GIS program.  Losses in these areas are often a major setback and derail any progress that may have been made in the GIS effort.  In some cases, losing years of work.  It doesn’t matter how good the implementation plan was or the technology being deployed.  

2.  IT Support:  Many small governments often do not have full-time IT staff and normally contract out for this support.  And with it, much of the focus is on infrastructure items such as the network, desktop and peripheral hardware components, client software installations/upgrades and as is the case in all governments and businesses now – maintaining the firewall and supporting cyber security efforts. These contracts, which are often with smaller IT firms, rarely include the support or guidance on multi-department applications such as geospatial programs which increasingly include mobile applications and its peripheral components.  This is not to say smaller IT firms cannot support GIS, it’s just not normally in their wheelhouse.   In small governments, needed GIS support from IT resources for a “government-wide perspective” is often extremely limited.

3.  Software Application Silos:    In small governments where there is often an absence of an overarching “IT committee” and/or the like, as well as combined with the lack of full-time IT staff as noted above, it is not uncommon for individual departments to be left to themselves to make their own business software decisionsAnd as software vendors continue to push for and offer cloud-based/browser only solutions for their software products, it is even easier for individual departments and programs to go rogue and operate further in obscurity from the primary or seemingly “adopted” computing environments in the organizationIn fact, it’s not uncommon for IT support in small governments (I’ve even seen this at the City level) to not even know what browser-based business solutions some departments are using on a day-to-day basis.

What makes this difficult in the GIS space is that practically all business software solutions now include some kind of “mapping” component –  if only to render the application data on some form of generic base map.  Most often Google Maps.   Often the user interface even includes the term “GIS” when simply viewing program data on a map – this being the extent of the “GIS” functionality.  And if and when the broader discussion of a GIS for the government is ever started, these same departments are slow, if ever, to join the effort.  Not knowing the larger intricacies and benefits of a shared, multi-department GIS program – the response is normally  “We already have a GIS“.  Little interest in the shared data model, to say the least of a common address file which most business software products normally ship  to support geocoding.  This cloud-only software application delivery model (mobile apps, too) is very common now in local government permitting, code enforcement, inspections, and even public safety disciplines to name just a few.

If it’s not broken, they are not going to try and fix it.  Let alone spend more money.  Making it very difficult to garner interest for a government-wide discussion on a unified GIS solution.  

4.  VIPs with an Attitude:    That may sound a little harsh, but the fact of the matter is that  just one dominant personality in small governments can impact the  decision making process over a wide range of internal technology issues – not just GIS.  Such individuals exist in all levels of government, but in smaller ones, where staff are few in numbers and  VIPs normally being senior staffers – frequently with decades of service – his or her opinion is often unquestioned.  Your first onsite meeting with folks who are genuinely interested in the GIS goes well – that’s why you’re there in the first place.  But during the second or third on-site meeting which is held to take a deeper dive into the concept – the VIP with an Attitude shows up out of nowhere acting like Lord Vadar.  Often packing a lightsaber.

Because of their decades of institutional knowledge, they have been ordained to know what is best for the good of the order.   Even if he or she isn’t even directly involved in geospatial.  Like a good defense lawyer, raising just an iota of doubt on what is deemed such a good idea by so many others.

Magically the VIPs have the ear of the Budget Director, Comptroller, Finance Director, fellow high ranking directors, or highest elected official.  Or the Town Board.  And so forth.  Across the municipal landscape they can be found in one of many program areas:  Public Works, Finance, Building Department, maybe a small Planning office, or even a long standing consultant who isn’t even on the payroll.  For whatever reason, he or she feels threatened by the technology which is being considered and increasingly adopted elsewhere.    Particularly if the VIP has not taken the time to understand the benefits that geospatial programs can bring.

But it’s not going to happen while they are still around and/or have something to say about it.  In my hometown, early GIS efforts were thwarted by the Receiver of Taxes.  Yes, Receiver of Taxes.  Largely because this office was responsible for “computer related” expenditures.  And nothing was going to compromise his/her annual computer software and hardware needs.  To this day, the program has never gotten on track.

There is really no good solution for the VIP with an Attitude problem in small governments. Sometimes retirement and attrition takes care of the problem though this may take years.  A change in administration sometimes helps, but in small governments new administrators rarely question long standing, senior staff members.  If anything they embrace the input and advice of VIPers.

And the beat goes on.  

5,  Consulting Engineers: Small governments often do not have a professional engineer on staff and normally contract out needed engineering services.  Engineering firms, whether small or large, which secure these services can have a profound impact on the use and development of GIS in small governments.  Though many small governments today do not see or consider their consulting engineers in this capacity.  Most aren’t even aware of the possible connection.

Back in the day of desktop/client GIS solutions, such support by consulting engineers was unrealistic.  But now, with easy-to-use cloud-based offerings such as ArcGIS Online, consulting engineers, along with their arsenal of AutoCAD related products and technologies, can simply envelope this “GIS service” into annual support services contracts.  At many levels of government, and particularly true in smaller ones, consulting engineers come in contact with all types of municipal geospatial data.   While infrastructure data (storm, sanitary, water distribution systems) are often the most obvious, consulting engineers duties also often include staffing local Planning Boards, serving as a liaison to utilities and a myriad of regional, state, and federal programs which include geospatial connections, as well as being involved in a host of local surveying and land/property record issues.    Depending on the in-house GIS resource capacity the consulting engineer maintains and the licensing agreement with the software vendor,  consulting engineers can offer a range of GIS capabilities to get small governments started for minimal investments. 

The reasons are many why this connection is not more common, but this “barrier” is more of a business relationship that more small governments should try and leverage with their consulting engineers.  There are positive and long term benefits for each party.   

Summary

At the end of the day, yes, the scale of small government operations and the scope of the geographical area covered may not seem to justify the investment in a comprehensive geospatial program.  Leading to a perception among the local elected officials, perhaps even department heads, that the benefits may not outweigh the costs.  Though the path I took in and out local government buildings, a basic lack of education and awareness of the geospatial benefits was still always an issue.  Particularly among the highest elected official and governing boards.  But it doesn’t stop there as I believe there still continues to be a significant lack of awareness or understanding of the broad spectrum of geospatial technologies among elected state representatives as well.    

For years, I’ve passively monitored the websites of New York State Association of Towns and New York Conference of Mayors as a source of ideas for articles for this blog.  Both organizations represent elected officials (including council members, boards, clerks and other municipal staff members as well) and are an excellent source of advocacy for small government programs and funding where geospatial technologies can be applied (i.e., transportation, infrastructure, public safety, environmental protection, etc).   Even New York State Association of Counties (NYSAC) for the most rural of our state counties serves in this capacity as well.  If one takes the time to drive around and research each of the association websites, including using key word search tools, there is little reference to GIS or geospatial technologies.  Or for that matter, little of the technologies that geospatial is wrapped into. 

These organizations would be an excellent source of geospatial awareness at their newly elected training programs or annual conferences – which are extensive.  Helping connect geospatial to the programs they fund and how the tools are applied locally.   (For this article I looked for similar training sessions for newly elected New York Assembly members but could not find any specific programs).  Perhaps an opportunity for organizations like the NYS GIS Association or our emerging academic programs to provide training session/seminars to these associations.

There will continue to be exceptions, but until the opportunities and awareness of geospatial technologies are better understood, small government GIS programs in New York State will continue to struggle.

Warren County GIS: A Showcase of Geospatial Content for County and Local Government

Program’s modest beginning started in the late 1990s with AutoCAD files and a copy of ArcInfo

Now spending a significant amount of time upstate New York in Essex County, we now find ourselves looking for different routes to take back and forth from southeast New York State instead of the “go-to” I87/Northway option every time.  Just to mix things up – the four-plus hour drive going the normal route can get to be a bit monotonous.

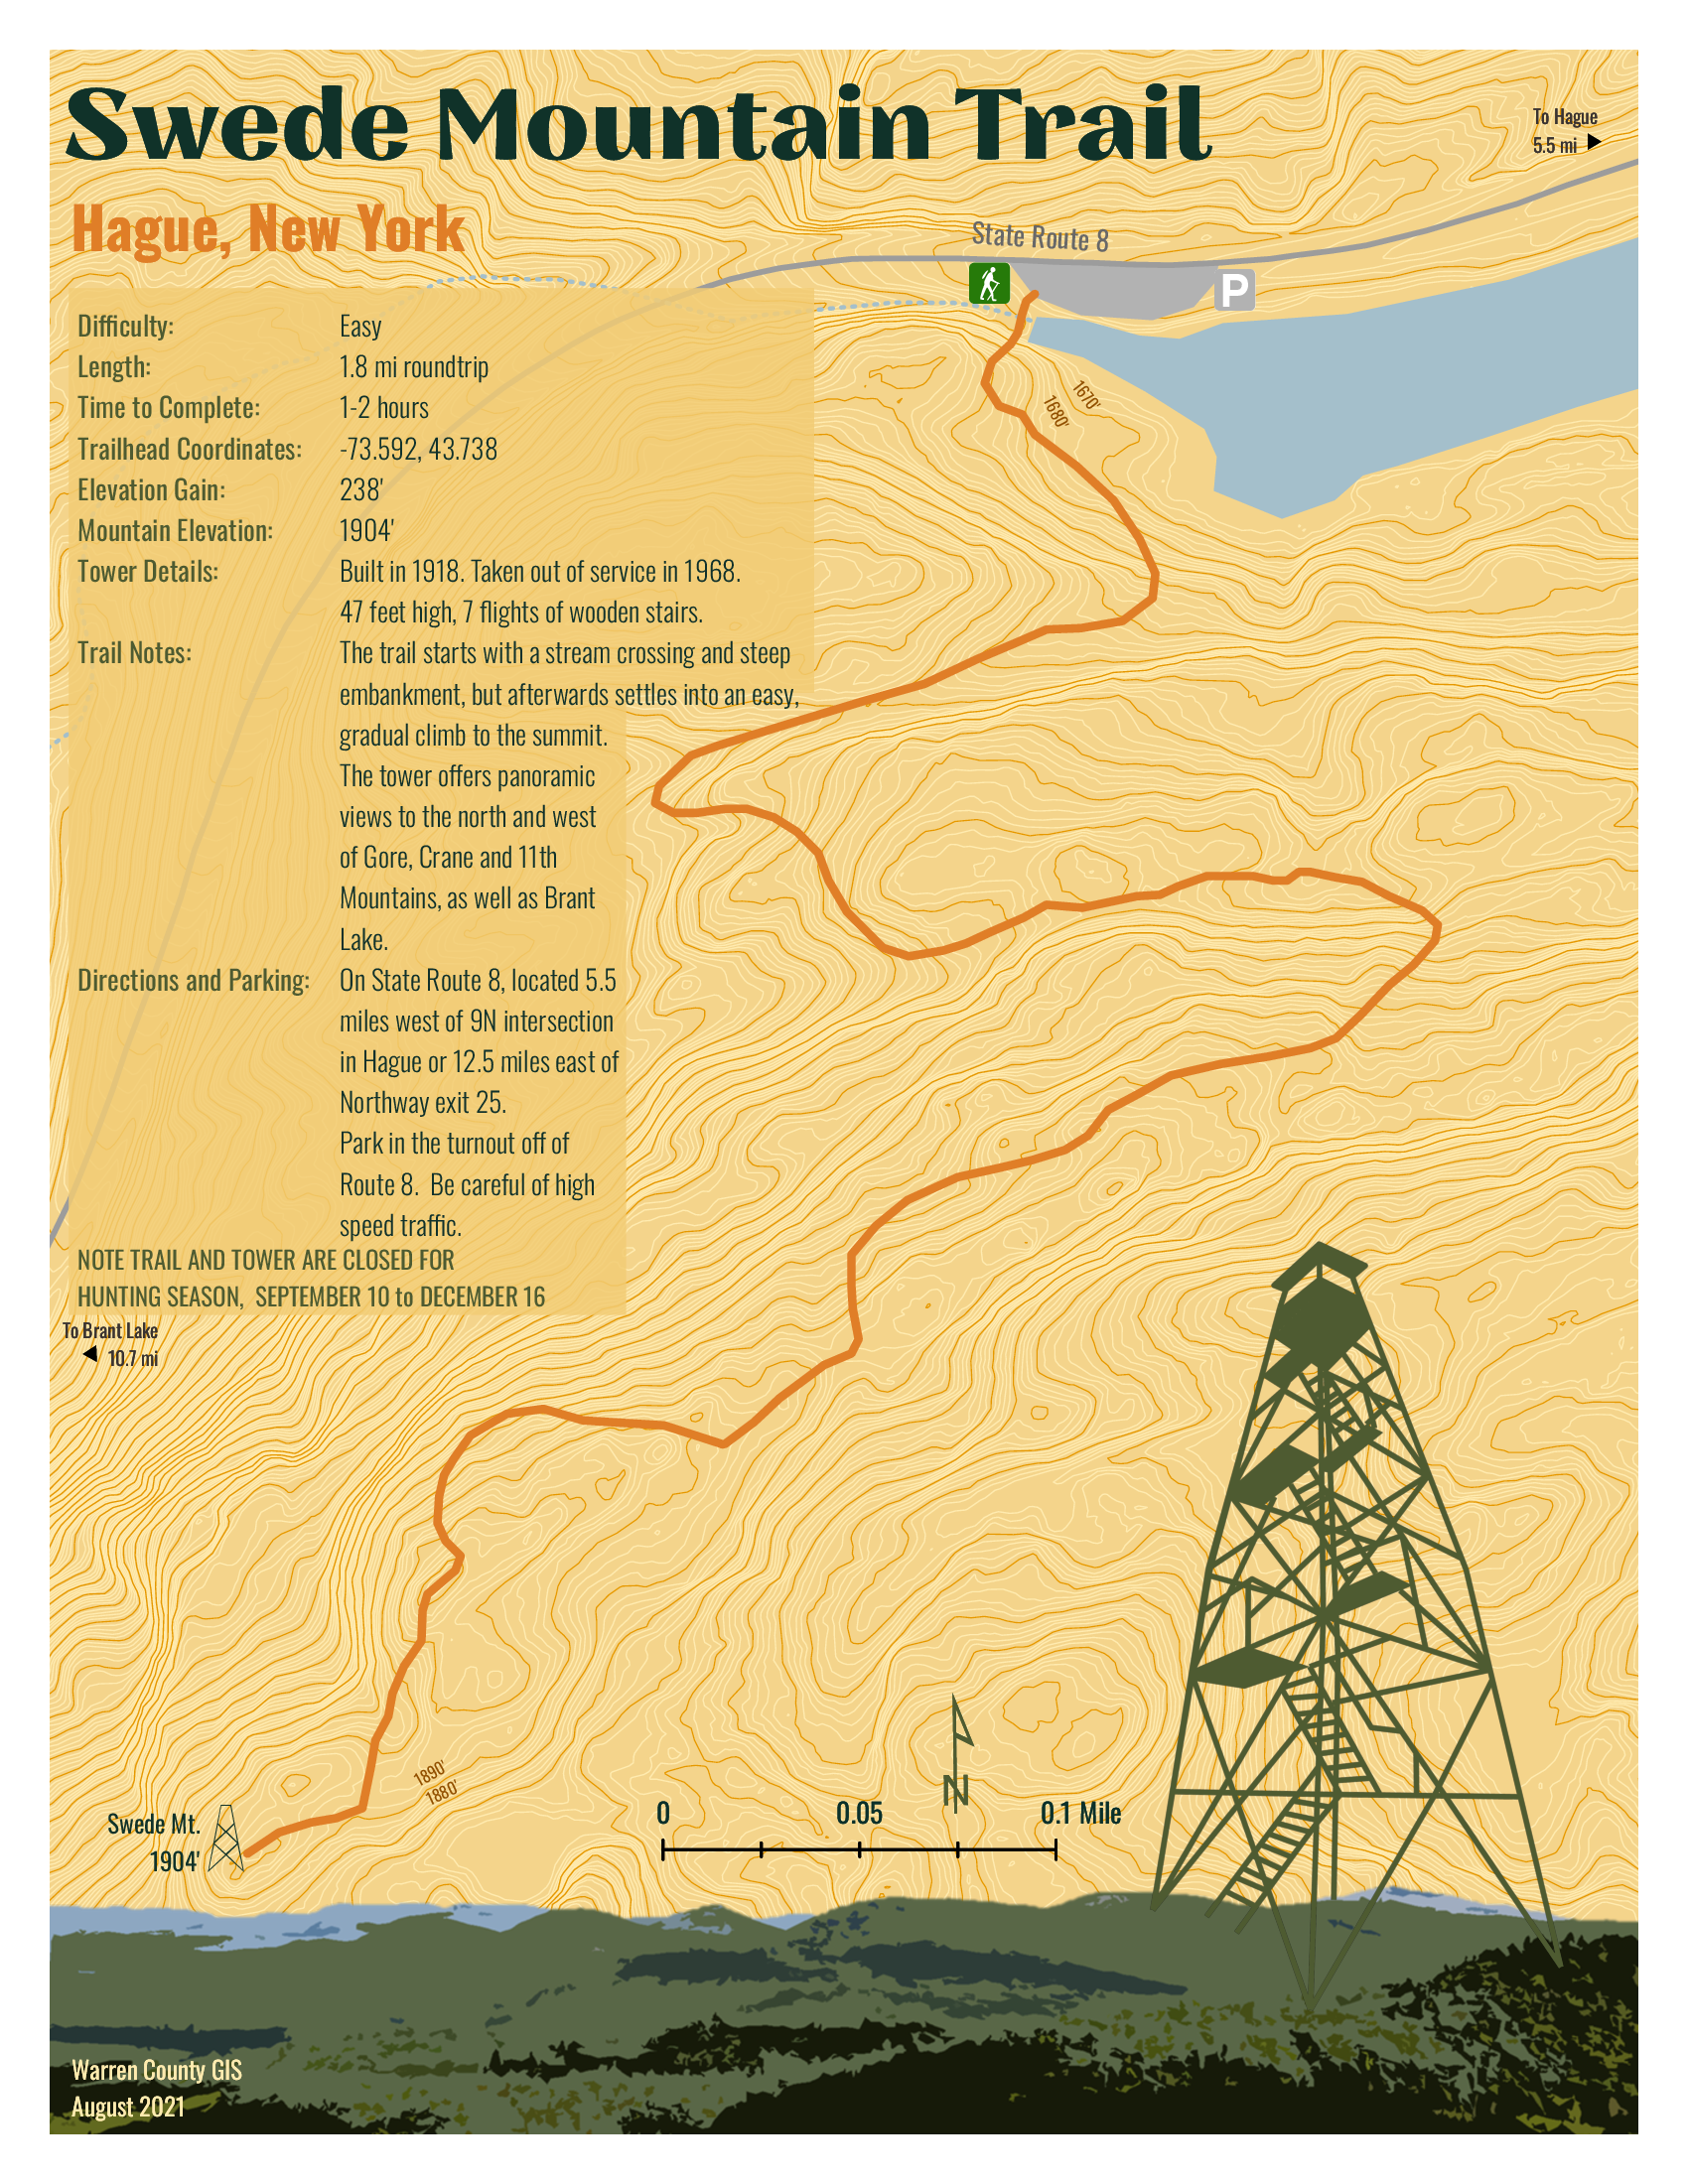
So it was in September I came south out of Ticonderoga headed to Hague (yes, named after The Hague in the Netherlands) on the northern end of Lake George – an area I had never been to.  And it did not disappoint.  Though ultimately to State Route 8 (aka Graphite Mountain Road) to a new Adirondacks trailhead:  Swede Mountain Firetower.  Even though the round-trip hike isn’t that long and relatively easy, it was getting late and I didn’t even get out of the car while in the trailhead parking lot.  Instead, making a note to print out a trail map when I got home.  A couple days later and not having a clue what trail maps were actually available, I Googled “Swede Mountain Firetower trail map” and a candidate list of URLs and image options were immediately returned.  Randomly selecting the one below,  the cartography caught my eye and I quickly looked for the map’s author.  There on the bottom left:  Warren County GIS.  

It was quickly then off to the Warren County GIS website.  Which became the genesis of this article.

Warren County GIS

Just by coincidence, this article coincides with the release of the new Warren County GIS Hub as announced by long-time county GIS Administrator, Sara Frankenfeld.  Overseeing a countywide GIS program judiciously developed over the course of more than two decades – from the days of ARC/INFO coverages to 2022 mobile field apps and interactive online viewing applications.  Also available through the program and Hub is a rich repository of dozens of hardcopy maps available for download covering areas such as countywide outdoor recreation, history, demographics, municipalities, planning and the environment and much more.   An amazing amount of content bundled into three main categories:  Web Maps and Apps | Maps for Print | Download Data.

Background

Originally from the northside of San Francisco Bay in Marin County and earning a degree in Geography from Northern Arizona University, Frankenfeld came to the east coast to initially start work with Dutchess County.  After a short stint with NYSDEC she ultimately made her way to Warren County in 1999 where she got started with a copy of ARC/INFO on a standalone computer in the county building basement.   The county had created a new GIS position in the Planning Department to help convert the tax maps to AutoCAD and then over a period of time converting from AutoCAD to ARC/INFO and then later to geodatabase. 

Over the next four years, she was successful in winning over several other departments on the value and usefulness of GIS technology which she accomplished by focusing on easy, visible “wins” such getting people to use the newly available digital tax parcel data (linked to the RPS data) as quickly as possible and making hardcopy maps.  Lots of maps.  The visibility of the Warren County program also expanded by her working with municipal government zoning administrators and assessors and providing access to the new digital parcel data and including zoning maps,  wetlands data, and FEMA floodplain maps.  A New York State Archives and Administration (SARA) grant enabled the development of a parcel viewer app sby AppliedGIS – where she would later go to work for several years – called the Spatial Data Viewer.  The groundwork was also laid for the implementation of ArcIMS and Imagemate Online.  Somehow she also found time to include outreach programs to local schools and GIS Day.  

After a period in the private sector with (then) AppliedGIS/Fountains Spatial, she returned to Warren County in 2013 where she remains today.  

Today’s Environment

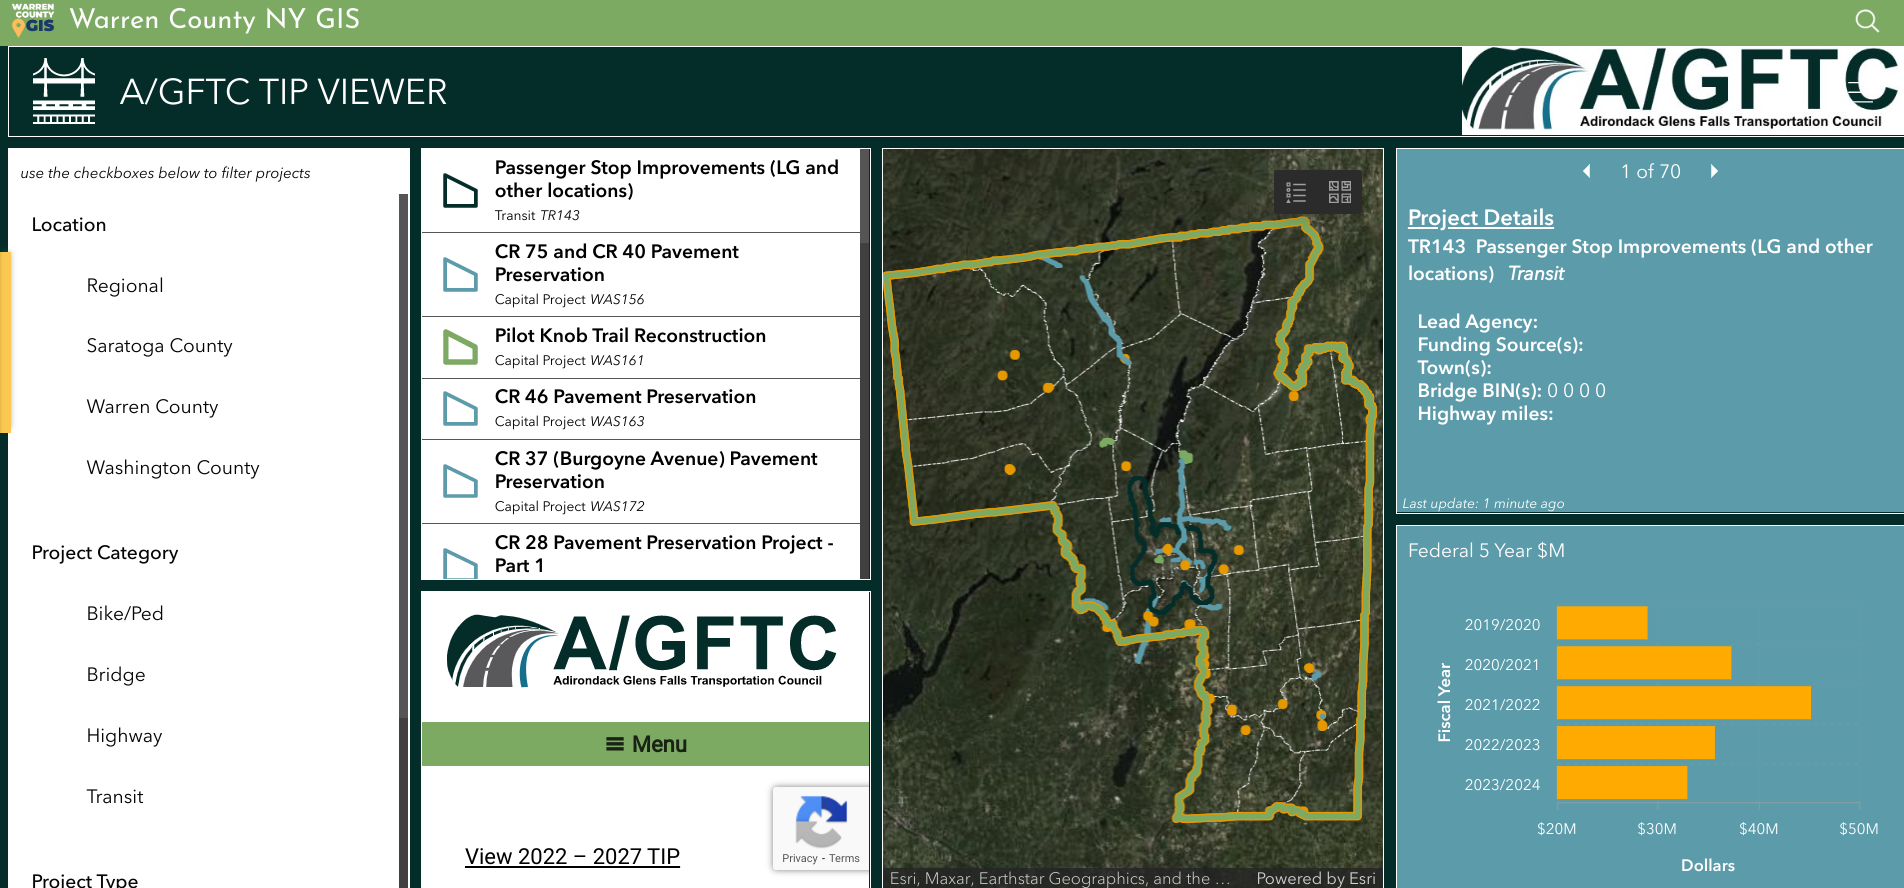
In 2022, the Warren County GIS program is built totally around the ArcGIS Online (AGOL) environment.   Frankenfeld states AGOL has “totally transformed the workplace” and furthers her two main goals of (1) improving public access to data and (2) streamlining/improving processes for county departments and organizations the GIS program supports.  She, along with GIS Specialist Amanda Beck, have embraced StoryMaps, Dashboards, Hubs and Survey123 in ways to make it easy for non-tech users to create and maintain data and access it.  While many of the combo Survey123/dashboard applications are internal facing, others, like the Lake George Milfoil Harvesting real-time app is available to the public.  And so is the Capital Improvement Project Planning viewerBoth respond to GIS requests from local municipalities, local organizations including  the Adirondack/Glens Falls Transportation Council (AGFTC), Lake George Park Commission and the Lake Champlain Lake George Regional Planning Board – all of which have tech support contracts the County.  Projects range from data compilation to hardcopy map preparation to creating and supporting online apps.  Usually these three organizations know exactly what they want, but GIS staff we do often try to suggest ways to streamline or improve their requests.  For example, County GIS staff helped AGFTC come up with a method to inventory sidewalk/crosswalk/curb ramps for ADA transition plans that proved really popular and resulted in a training session for all the Metropolitan Planning Organizations (MPO) in the state.

Dashboard for Adirondack/Glens Falls Transportation Council’s Transportation Improvement Program projects.

Having transitioned to ArcGIS Pro to support data editing, cartography and more complex analysis, Warren County GIS staff do a majority of their work in AGOL which includes the mobile pieces Field Maps and Survey123.  They still collect GPS data as needed (usually related to recreation or e911) and support field operations, such as collecting milfoil harvest or infrastructure data, for other users.  They also have Trimble boosters and cell phones which can be checked out to both county staff and municipalities for field data collection along with field worker licenses.   While there are still a few remaining ArcGIS desktop users, most users are using AGOL with named users in Planning, Soil and Water, Public Affairs, the Sheriff’s Department, Office of Emergency Services, Public Works, and Parks and Recreation.  Address and road centerlines are uploaded to the state twice a year and parcel data once a year.  A large current project Sara and Amanda are currently working on is building additional GIS capacity and functionality in County Department of Public Works.

Except for Queensbury which has its own full-time GIS staff person, Warren County GIS supports all municipalities in the County.  At the beginning of the program, Sara had  set up each municipality with desktop GIS as well as providing training and support.  In hindsight and it comes as no surprise this desktop support  was the most time consuming element of her job in the early years.  With the advent of online GIS, County staff has transitioned most of the towns off of desktop GIS, although there are a small number of towns which still use the desktop client.  Most local communities across the County now utilize new AGOL applications.   “We often will take the initiative with projects for the towns that relate to work the County Planning Department is doing such as the Warrensburg buildout analysis“, notes Frankenfeld, “as well advocating the adoption of Field Maps for maintaining water and sewer data.”

New GIS Hub

As noted previously, the new Warren County GIS Hub contains three main areas of content:  Web Maps and Apps | Maps for Print | Download Data.  Each area is then broken down further thematically into categories such as recreation, environment, transportation and infrastructure, planning and zoning, history, citizen reports and more.  With an established user community in County government, most of the time departments and organizations now approach GIS staff directly with applications to develop to support their business needs such as the Safe Pace, Opioid Dashboard, Storm Reporter, TIP viewer, etc).  Other projects have been initiated by GIS staff themselves such as the covid hub and election polling locator.   GIS staff work frequently  with other Planning Department and and apply grant funding to create projects such as History Mapper and the letterboxing challenges (Letterboxing Trail and Historians’ Challenge).

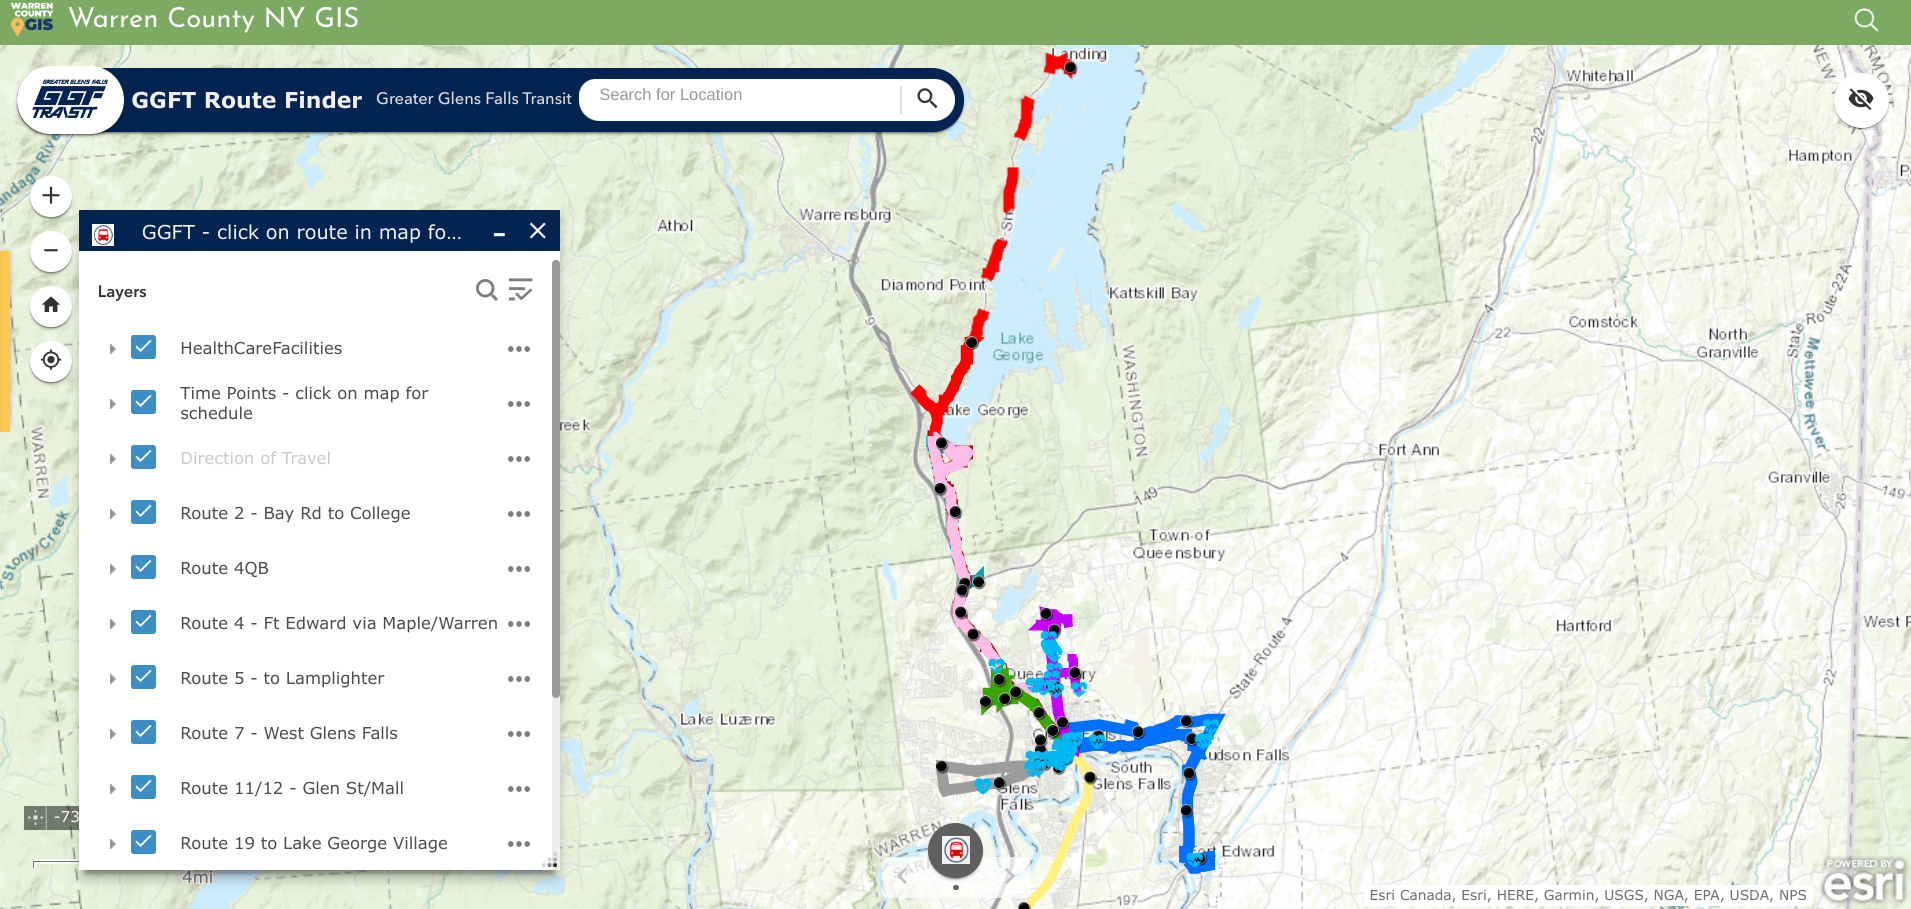
Geospatial viewers are excellent for publishing public transportation systems content. In addition to making time tables and schedules available, ones such as the GGFT also include important public sites such as health care facilities.

Today the COVID Hub is the most popular app though much simplified from early COVID and no longer maintained by the GIS team.   It’s had around 1.5 million views  since its inception in April 2020 – not bad for a county with a population of 64,000   The next most popular is the parcel viewer app (Community Map), which gets about 12k views a month.  After that, the First Wilderness website (about 7k views a month) and the Recreation Mapper which gets a couple hundred views a day, higher in the summer.  Warren County’s primary industry is tourism and is an outdoor recreation destination, so trail maps and recreational resources are popular content and Sara and Amanda spend a substantial amount of time creating and maintaining recreation data and providing access to it.

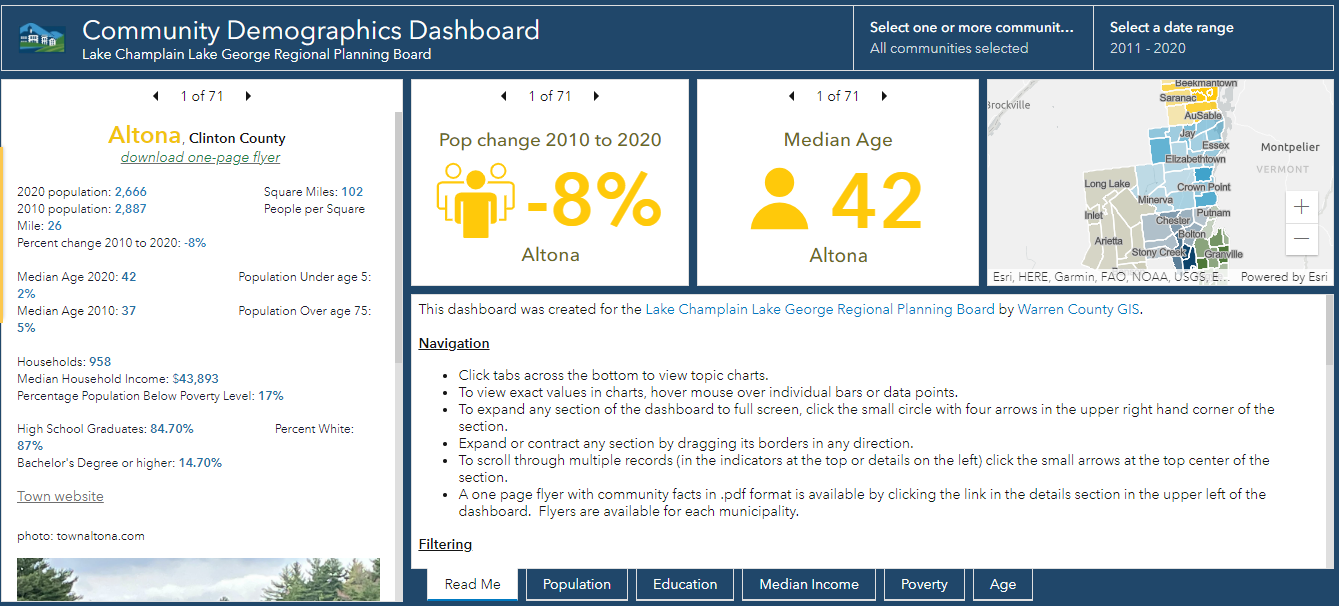
Warren County GIS provides technical support to the Lake Champlain Lake George Regional Planning Board which extends beyond the Warren County footprint. This viewer contains both American Community Survey and 2020 Census data for areas in the five north country counties covered by the Regional Planning Board

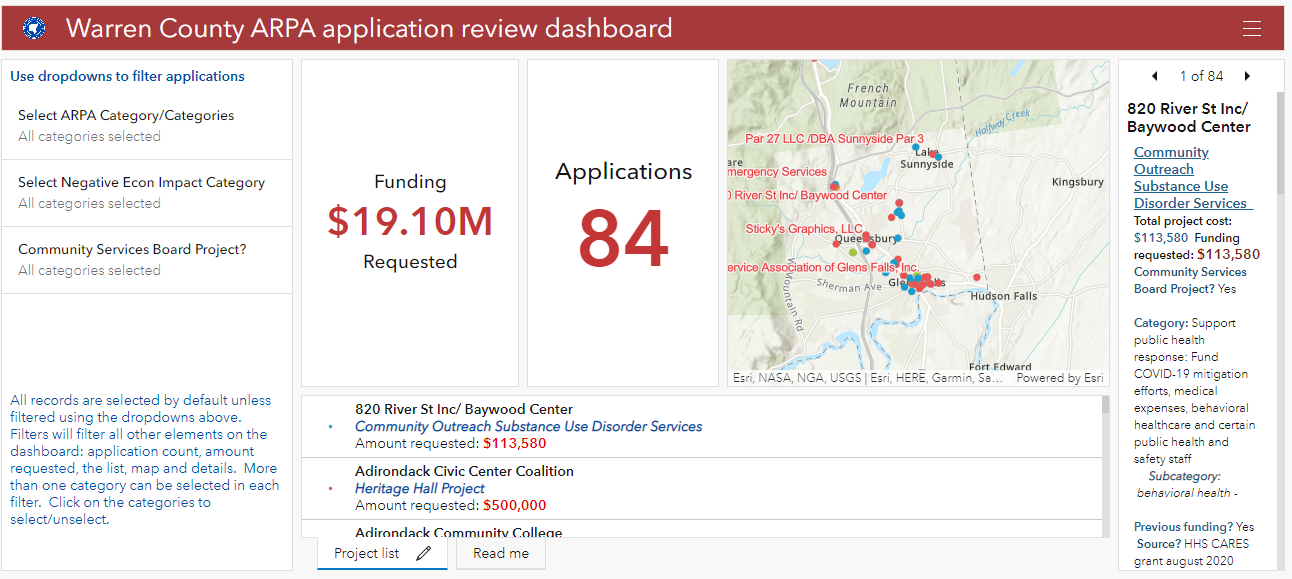
Though the application was closed in August, another public facing app focused on the American Recovery Plan Act (ARPA).  Survey123 was customized to create an application for those organizations interested in applying for ARPA funding.  The applications were made available to committee members for review through a Dashboard, and scoring was completed using another Survey123 form.

American Recovery Plan Act (ARPA) grant monies provides funding for investment in a wide ranges of community programs and services including geospatial efforts in the rehabilitation and mapping of infrastructure systems.

Sara’s Law

There probably aren’t many geospatial professionals working today across the Empire State that are familiar with Sara’s own little piece of New York State GIS history.  The year was 2002 and it was during her first stint with Warren County.  While using a GPS unit to map the locations of fire hydrants in the North Creek area, she was “challenged” by the professional surveying community of mapping features in a manner/way she was not qualified to do so.   Her post to New York State GIS listserve at the time describing the events read:

“In January, I(Sara) was contacted by an investigator from the New York State Education Department’s Office of Professional Discipline.  They had received a complaint from a surveyor stating that I was surveying without a license.  I was using a Trimble Pathfinder Pro XR GPS unit to collect fire hydrant locations and then plot them on a reference map.  Two investigators met with myself, our planning director, and our county attorney.  The investigators were unfamiliar with GPS and GIS and were basically on a fact-finding mission.  The investigation has progressed, and today we met with the two investigators, an attorney from the Office for Professional Discipline and a surveyor from the New York State Board of Licensed Engineers and Land Surveyors.  The state’s attorney told us at the beginning of the meeting that after reviewing the facts in the case, they do feel that we are guilty of practicing surveying without a license.  She then gave our county attorney a chance to state our case, which I thought he did very well. We were informed that the board will make a decision within the next week.”

At the time, it WAS a really big deal in the statewide geospatial and surveying communities – particularly New York State Association of Professional Land Surveyors (NYSAPLS) and the subject of much discussion and debate.  Significant in that it marked, for the first time, the visible intersection of emerging GIS/geospatial technologies and the professional discipline of surveying – and by extension, engineering in New York State.    While legislation (A01927 & S04396) was proposed in the 2007/2008 timeframe looking to “enhance the definition of land surveying with current standards and tools, i.e., GPS”, nothing was ultimately passed.  And along the way over the course of several years, the discussion and the proposed legislation became known as “Sara’s Law”.  

Little did she know the backpack GPS unit she was using in 2001 in North Creek would one day be the beginning of bringing these different, but similar geospatial technologies together as they are today.   Sara’s place in NYS GIS lore is secure.  

Summary

In addition to the broad presence the Warren County GIS program has throughout county government, it also represents the great relationship and guidance county geospatial programs can provide and offer to local governments.   Local governments that often have both limited financial and technical resources can benefit greatly from county GIS which have technical expertise and infrastructure in place.  A model that can be replicated in other areas across New York State.   

Contact

Sara Frankenfeld
GIS Administrator
Warren County GIS
Warren County Municipal Building
Lake George, NY 12845
frankenfelds@warrencountyny.gov
518-761-6410

Summer Reading: The Drones Are Amongst Us

Transformation geospatial technology is emerging as a “must have” in government GIS programs

Last month Governor Kathy Hochul announced the completion of the Skydome facility at the Griffiss Business and Technology Park in Rome, Oneida County. Located in a former airplane hangar, the indoor facility is the largest indoor drone test facility in the nation and a major investment in New York’s Unmanned Aircraft Systems (UAS) Test Site.  This investment adds to the already impressive UAS and high-tech ecosystem in the Empire State centered along the Syracuse-Rome corridorIts no news at this point that UAS are a transformation technology in the GIS and geospatial space with cutting-edge research and development going on right here in our backyard.  The Northeast UAS Airspace Integration Research Alliance (NUAIR) website provides a great example of this growing technology space which includes government, industry and academia.

The governor’s announcement made me go back looking for my notes on the Systems and Technologies for Remote Sensing Applications Through Unmanned Aerial Systems (STRATUS) 2022 Conference held May  23-25 at SUNY ESF which I wanted to participate in and attend, but the scheduling didn’t work out.   The 2022 show was the fifth STATUS conference which brought together more than 100 professionals from across the United States and Canada.  New York’s geospatial community, including those from a host of academic institutions and local and state governments, was well represented in the nine technical sessions which included both oral and poster presentations covering topics including mapping and surveying, agriculture and forestry, flood and water quality monitoring efforts, hardware and software, and flights and operations. Great homegrown UAS research work coming out of Cornell, Rochester Institute of Technology, SUNY Binghamton, Hobart and William Smith College, and SUNY ESF.   One of the keynote speakers was Ken Stewart, Chief Executive Officer of NUAIR who I interviewed as part of a 10 Questions column last fall.  The STRATUS 2022 program guide, including abstracts and presentations can be found here

And for those coming out of college or those looking for a mid-career change – its a great job market.   If not a great job skill to augment any current geospatial position.    Commerical UAV News reports the top five drone pilot industry markets (in order) include:  mapping and modeling, thermal imaging, real estate photography and videography, inspections, and movies and television.  Another publication predicts that by the year 2025, at least 100,000 jobs will be created for drone pilots. (btw – while putting together this article, came across an update on New York State drone laws and regulations as of July 21, 2022).

Seemingly now present in every significant geospatial data collection effort at all levels of accuracy and need, drone usage will grow exponentially throughout government in the years ahead.  As governments continue to remain concerned over drone liability, privacy, and cybersecurity issues,  industry and consulting firms will continue to provide the bulk of drone and UAS operations.  This may change slowly over time, but the near future work will be supported largely by the non-government workforce.  One exception to this will be in the public safety arena where government staff will continue to be aggressively trained and licensed internally.   

In other areas it will be most likely specific drone consulting firms or engineering companies will step-in and provide drone/UAS services.  Many engineering companies have already  positioned themselves well in supporting government geospatial projects by building GIS capacity and offering a wide range of services skillsets – both on the desktop and in the field.  And drones are a perfect fit as part of their surveying and mapping consulting work particularly for smaller to mid-size governments with limited or no technical staff.      These same engineering firms now offering full service GIS programs including the managing of online products such as ArcGIS Online to data warehousing.  Particularly advantageous to local governments as datasets get larger and larger as the televising of infrastructure systems (sanitary, storm, potable water, etc), above ground 3D modeling, building information models (BIM), and high resolution imagery continue to be captured and developed in municipal governments.  Continued advancements by the major software companies such as ESRI and AutoCAD, and their business partners,  on the integration of drone generated data such as lidar only extends the ease of use and accessibility of drone/UAS technology for government organizations.

And with high accuracy mapping and surveying being one of the most common applications of drone/UAS use, particularly in context of the quality of imagery captured and increasingly larger geographic footprints of data being collected, might it lead to  the discussion as to how the emerging drone/UAS technology augments larger publicly – funded efforts such as the USGS 3D Elevation Program (3DEP)?  While the 3DEP program covers much larger geographic areas and is plane-based, is there a way to add smaller project areas which are drone/UAS  based and meeting appropriate federal lidar specifications to public data warehouses and inventories such as the U.S. Federal Mapping Coordination website?  Expand the State elevation library to include locally collected data?  There is so much elevation data being collected across the state by so many sources.

Summary

Government GIS/geospatial practitioners will do well to follow and participate in technology specific conferences and associations such as those represented at STRATUS 2022.  Many of which are becoming more accessible by being available online.   Industry specific conferences in engineering, public works, public safety – even agriculture – now serve as an excellent source of specific applied geospatial technology tools.  And drone/UAS technology is a common thread among them all. 

Coming to a geospatial application close to you soon. 

Campus Planning and Geospatial Technologies at UAlbany

GIS used in many areas alongside engineering and architectural applications

College and university campuses are the home for a vast amount of geospatial data covering both the natural and built environments.  Whereas at the beginning of geospatial era there was a clear and defined digital divide – GIS vs. CAD –  today these technologies have evolved to be used and managed together almost seamlessly.  In this space since the early 2000’s we’ve seen the evolution of the Building Information Model (BIM) in along with drone, GPS, and laser scanning technologies serving as a means to capture and generate additional types of geospatial data both indoor and outdoor.  GIS concepts are also important elements integrated into Enterprise Asset Management (EAM), Computer-Aided Facilities Management (CAFM) and Computerized Maintenance Management System (CMMS) solutions.

Built around the geospatial framework which also includes standards for both data collection and data management, GIS applications in campus settings are leveraged by both GIS specialists and engineers alike.  Common program areas include covering areas such as master plan support, space programming, work order management, asset management, emergency management, real estate and portfolio management, environmental and regulatory compliance, and site selection studies among others.

While traditional GIS and engineering software applications such as ArcGIS and AutoCAD support much of the outdoor mapping, facility managers increasingly use a more indoor specific software programs such as Revit, Autodesk BIM 360 Ops, Cartegraph, and ESRI’s relatively new entry into this space ArcGIS Indoors, among others.   In reality, automated systems at large facilities involve a combination of the programs noted above and often also integrate other monitoring and SCADA systems.   If you are new to GIS and geospatial applications to the campus setting, here is a good overview presentation.

Campus Planning at UAlbany

Many of these geospatial-related disciplines intersect directly – and indirectly-  in the Office of Campus Planning at UAlbany which is charged with the overall planning of physical space on campus (indoor and outdoor), capital and operating funding, and supporting the strategic plan of the University.   The office currently has a team of eight which includes Jessie Pellerin who serves as GIS and Signage and Wayfinding Manager.

Jessie is involved with several elements of GIS data collection and cartographic products associated with the UAlbany facilities for the uptown, downtown, and Alumni Quad campuses – including the production of hardcopy maps which are still an important communications and outreach component for visitors and students new to campus.   Nearly all of her day-to-day work is done with ArcGIS Pro.  Field data collection is normally supported with Collector for ArcGIS on an iPad and for offline viewing.

Jessie produces all of the UAlbany maps using just ArcGIS Pro without the use or addition of any desktop publishing software

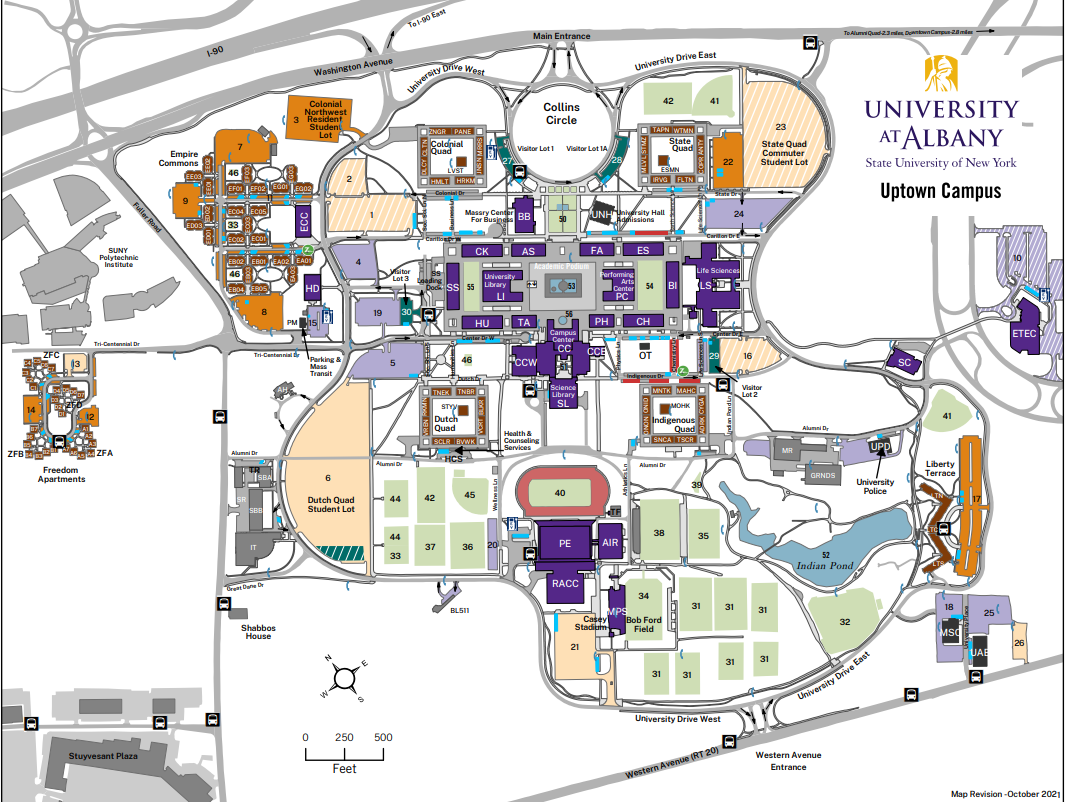
With regard to above and underground features on, the 500-acre uptown camps, she helps manage a GIS database which includes 122 emergency blue light phone locations, 16.5 miles of storm sewer pipes and 760 catch basin, 6.4 miles of sanitary sewer pipes, 1500 light poles and 12 miles of roads among dozens of other features. Jessie also oversees individual data collection projects conducted by vendors such as the campus wide light poles and irrigation system.   She serves as the ArcGIS Online Administrator for the Office supporting and maintaining several customized viewers for 50 staff across campus in specific work program areas.

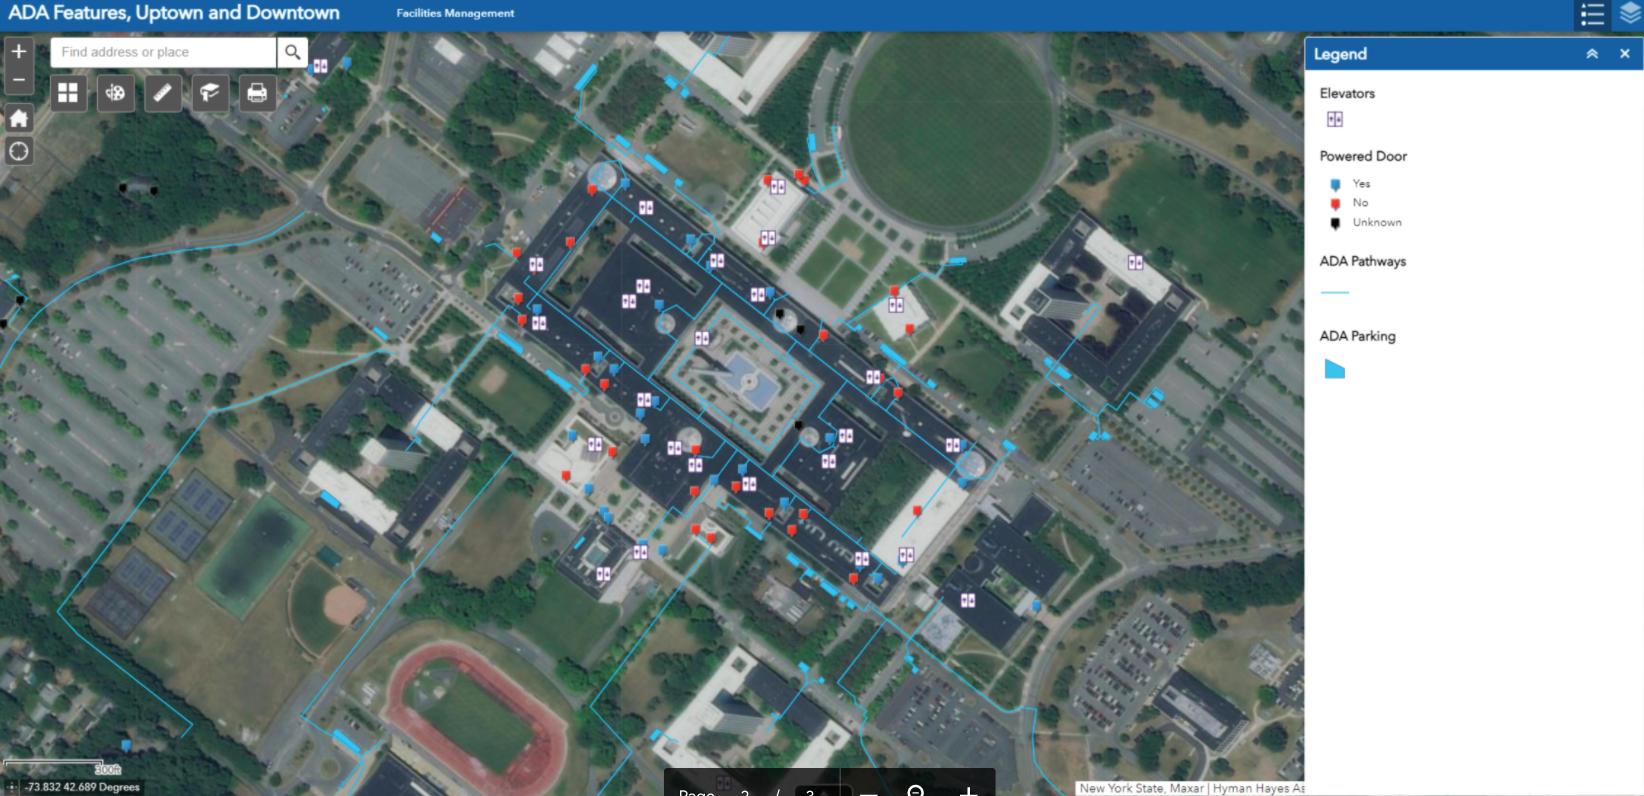
One of internal AGOL viewers Ms. Pellerin supports focuses on the locations of accessibility features on the Uptown and Downtown Campus. Pop-ups include more information for each feature. Data was developed from a campus-wide accessibility study.

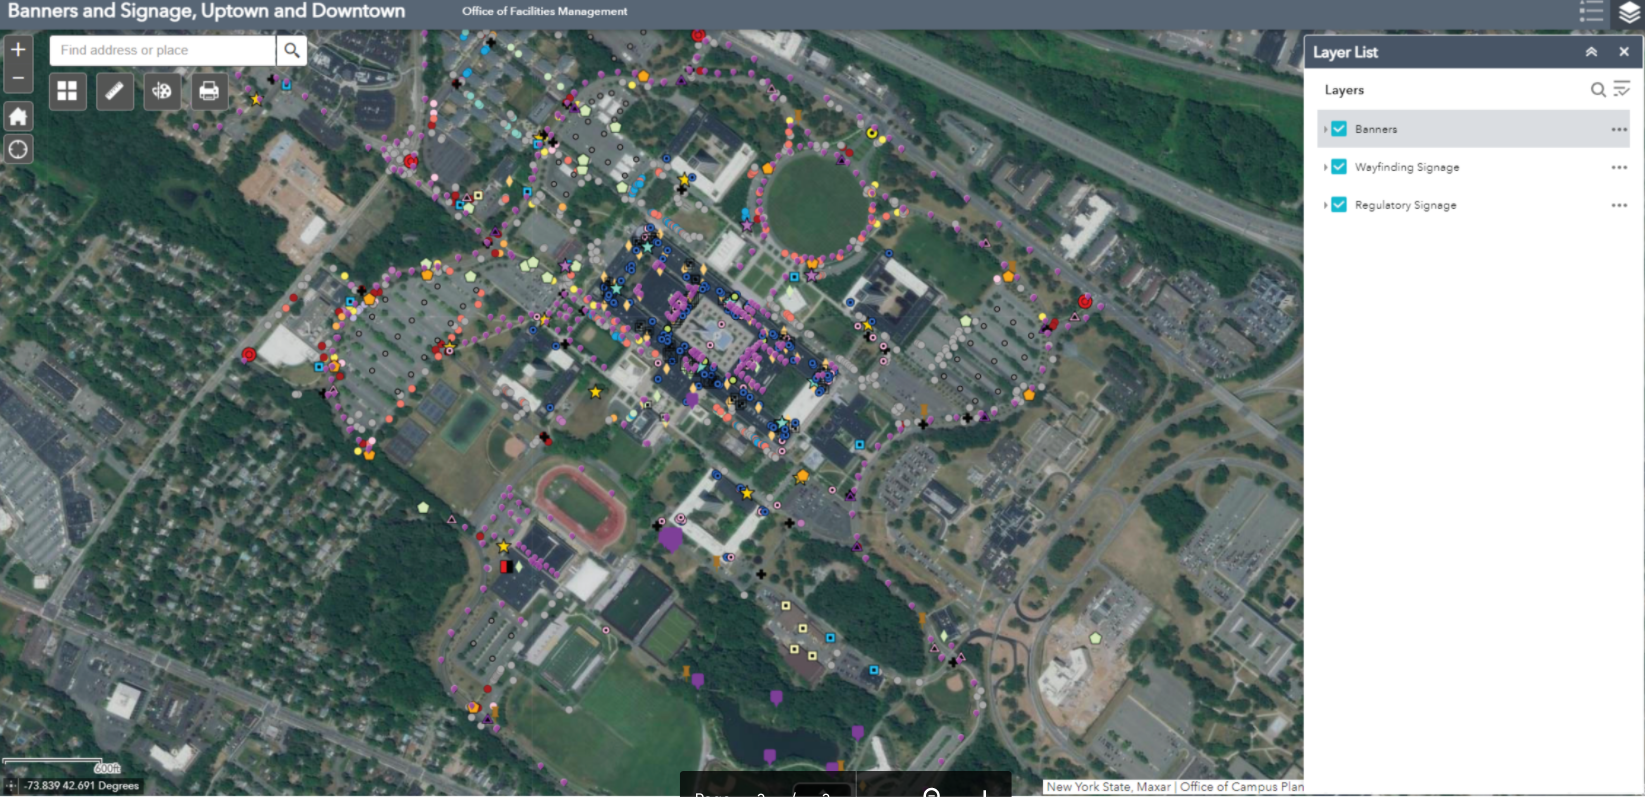
Another viewer shows the location of the exterior wayfinding and regulatory signage and banners on campus. With over 500 exterior wayfinding signs, 750 regulatory signs, and 550 banners, GIS has been essential in keeping track of sign content and condition for aiding in preventative maintenance, site planning, and branding initiatives. Both of the above viewers were built with Web App Builder.

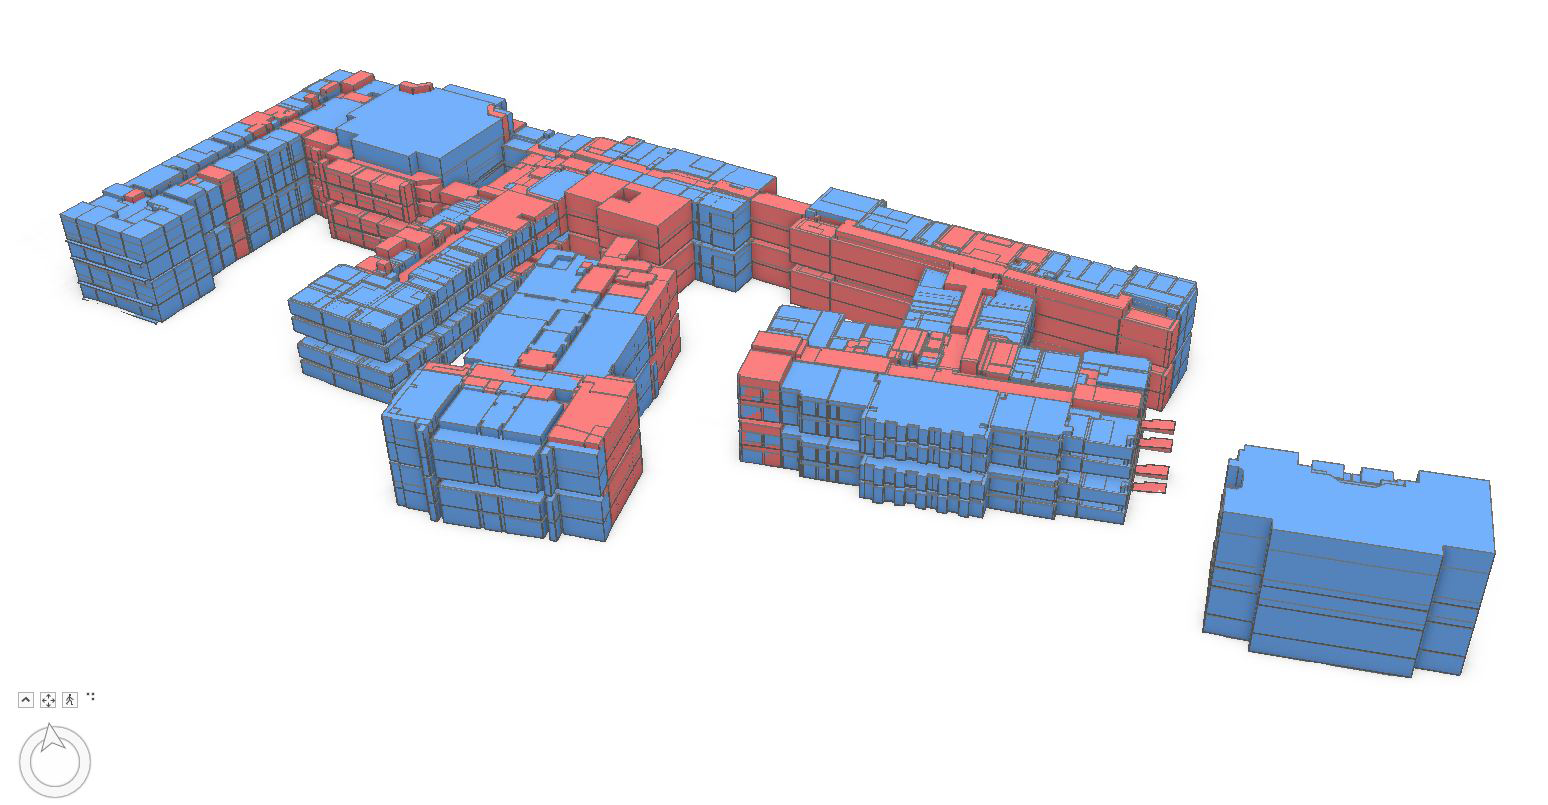
An example of how space planning is supported using GIS at UAlbany. This graphic shows a 3D visualization of assignable space on the Downtown Campus

As part of supporting the university’s COVID-19 response, Jessie assisted with others by using combining mapped sewer line and manhole data with the occupancy count of each of the residential dorms, to determine the optimal locations for the waste water testing sites in 2020. There ended up being six manholes selected (out of the 282 on campus). Maps were shared with other stakeholders in the project.    

As it relates to campus settings, GIS use is growing and being used more often in buildings and facilities planning by campus staff” notes Stu Rich, Director, Buildings and Infrastructure at Cartegraph.  Initially, as outdoor GIS concepts and technology were beginning to be applied to the indoor environments, cost was often a barrier to get started in building BIM and interior models for many organizations.  “Those barriers are beginning to change” Rich further adds, “While precision indoor mapping will always require higher-end instrumentation, recent products such as MagicPlan and IndoorVu, as well as falling software prices, are making interior mapping and data capture more affordable for large facilities management programs.   All of these products and technologies are now broadly used in facilities management and integrated with GIS applications.”

Recognizing the importance and growth of using digital data both in-house and with the numerous engineering companies performing work on campus, both the Office of Campus Planning and the Office of Architecture, Engineering, & Construction Management (AECM) have developed digital data standards for BIM, GIS, and AutoCAD.

Summary

Large campus facilities such as SUNY Albany bring together the intersection of several geospatial technologies.  Individually each seemingly used or applied for one specific purpose (and often at varying levels of spatial accuracy) but when mashed together in a just web viewer, provide easy access to a wide range of authoritative digital content for decision-makers. Sure signs of the growing maturity and acceptance of geospatial technologies.

Contact:

Ms. Jessie L. Pellerin
GIS and Signage and Wayfinding Manager
Office of Campus Planning
University at Albany, State University of New York
jpellerin@albany.edu

10 Questions / Preguntas: Daniel Munoz

Daniel Munoz, GIS Manager, Orange County GIS Division, has been an integral part of the Orange County GIS program for over twenty years and involved in geospatial initiatives in municipalities across the county as well.  Somewhat atypical of how other county programs across the Empire State originally evolved, Daniel led implementation of the countywide effort from its beginning from inside the Orange County Water Authority and later on overseeing development into key enterprise programs in the areas of Real Property Tax Services and Emergency Services.  With Spanish being his native language, I also asked Daniel to offer any thoughts/ideas on how to expand and provide geospatial tools to the growing Spanish speaking populations across the Empire State. In further supporting this issue, this eSpatiallyNewYork post is published in both Spanish and English.

Daniel Muñoz, Gerente del SIG, Condado de Orange División de SIG, ha sido una parte integral del programa SIG del Condado de Orange por más de veinte años y también ha participado en iniciativas geoespaciales en los municipios del condado. Un poco diferente de cómo evolucionaron estos programas en otros condados en el Empire State, Daniel dirigió la implementación de los esfuerzos del condado desde el inicio en el Departamento de Agua del Condado de Orange y luego supervisó el desarrollo de programas claves en las áreas de Servicios de Impuestos de Bienes Inmuebles y Servicios de Emergencia. Como el español es su lengua materna, también le pedí a Daniel que ofreciera conceptos / ideas sobre cómo expandir y proporcionar herramientas geoespaciales a las crecientes poblaciones de habla hispana a través del Empire State. Para respaldar aún más esta situación, esta publicación de eSpatiallyNewYork es disponible tanto en español como en inglés.

1.  eSpatiallyNewYork: Let’s start from the beginning.  Where are you originally from and when/how did you end up in Orange County government?

Munoz:  Here is the short story! I’m originally from Mexico City where I earned my Professional Engineer (P.E.) stripes.   I graduated as an industrial engineer from the Autonomous Metropolitan University of Mexico City and initially worked as computer system analyst for an international kitchen appliance company. I was fine with reading English and working with computers programing languages, but struggled with conversational English.  Since I had friends in the city,   I decided to move to Boston, Massachusetts to learn English.  While there I met a woman from Orange County which I married and ultimately moved to Orange County.

eSpatiallyNewYork:  Empecemos por el principio.  De donde eres originalmente y cuando o como terminaste en el gobierno del Condado de Orange?

Munoz: Esta es la historia corta! Soy originario de la Ciudad de México donde obtuve mi titulo de Ingeniero.   Me gradué de Ingeniero Industrial  de la Universidad Autónoma Metropolitana de la Ciudad de México inicialmente trabaje de Analista de Sistemas de Computación para una compañía internacional de electrodomésticos de cocina.  No tenia problemas leyendo ingles y trabajando con lenguajes de programación de computadoras, pero me costaba trabajo el inglés conversacional. Decidí mudarme a Boston, Massachusetts para aprender inglés ya que tenia amigos en esa ciudad. Allí conocí a una mujer del Condado de Orange con la que me casé y finalmente me mudé al Condado de Orange.

2.  eSpatiallyNewYork: What were your earliest Orange County GIS efforts?

Munoz:  I started with the Orange County Water Authority (OCWA) which is a “cousin” of county government.  My title then was digital systems analyst, which in hindsight, was “being in  the right place at the right time”. When I moved here, Orange County had not developed an E-911 system, but OCWA had started gathering  various databases and integrated computer mapping technology to create a county wide Geographic Information System.  Which ultimately led to  OCWA starting  to  serve a significant  supporting role in developing the new computerized E-911 system.  It was during this time I developed my own passion for GIS technology.   Since then I have learned about and worked in the fields of emergency management, planning, tax mapping, public works, and many other areas of county government.  We are providing and integrating data for all services!

eSpatiallyNewYork: ¿Cuáles fueron tus primeros esfuerzos de SIG en el Condado de Orange?

Munoz:  Comencé trabajando para Orange County Water Authority (OCWA) la cual es un agencia del gobierno del Condado de Orange.  Mi título entonces era analista de sistemas digitales, en retrospectiva, fue “estar en el lugar correcto en el momento adecuado”. Cuando me mude aquí, El Condado de Orange no había desarrollado el Sistema E-911, OCWA había comenzado a recopilar varias bases de datos y tecnología integrada de mapeo por computadora para crear un Sistema de Información Geográfica para todo el condado.  Lo que finalmente llevó a que OCWA comenzara a desempeñar un importante papel de apoyo en el desarrollo del nuevo sistema computarizado E-911. Fue durante este tiempo que desarrollé mi propia pasión por la tecnología SIG. Desde entonces, he aprendido y trabajado en los campos de gestión de emergencias, planificación, asignación de impuestos, obras públicas y muchas otras áreas del gobierno del condado. ¡Estamos proporcionando e integrando datos para todos tipo de servicios!

3.  eSpatiallyNewYork: Do you remember the version of ARC/INFO you got started with and what ESRI products are you using today?

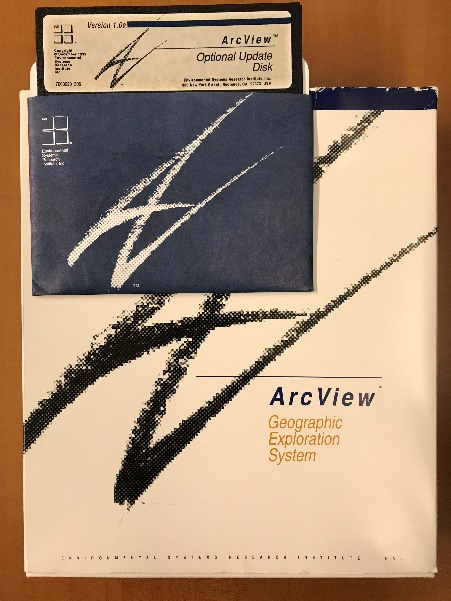
Munoz:  Oh boy.  I do and this really dates  me!   My GIS experience didn’t start with ARC/INFO, I started with ArcView 1.0 with option to update to 1.0a.  I still have the box almost intact with the 5¼” installation floppy disks (picture below). We did most of the work with ArcCAD an ESRI plugin for AutoCAD. My first interaction with ARC/INFO was at Version 7. Nowadays we try to keep up to date as much as possible but avoiding the “bleeding edge”. We are in the process of moving our full enterprise GIS to V 10.6.1. I use the full ArcGIS suite including  ArcServer and  ArcMap with the following extensions:  Network Analyst, Spatial Analyst and 3D Analyst.   I have tried ArcGIS Pro but still has some issues.  As far as the web environment, I created all of our websites with the old ESRI flash builder and have started to update them with Web AppBuilder.

Like many others across the state, Daniel got his start with desktop ArcView software.  Still an ESRI favorite to seasoned GIS professionals.

eSpatiallyNewYork:  ¿Recuerdas la versión de ARC/INFO con la cual comenzaste y que productos de ESRI usasactualmente?

Munoz:  Ay Caramba! Recuerdo bien y revela cuanto tiempo ha pasado! Mi experiencia en SIG no comenzó con ARC/INFO, comencé con ArcView 1.0 con la opción de actualizar a 1.0a. Todavía tengo la caja casi intacta con los discos de instalación de 5¼ ” (imagen abajo). La mayor parte del trabajo fue echo con ArcCAD una extensión de ESRI para AutoCAD. Mi introducción con ARC/INFO fue en la versión 7.0. Hoy en día tratamos de mantenernos actualizados tanto como sea posible, pero evitamos estar a la “vanguardia”. Estamos en el proceso de actualizar nuestro completo SIG a la versión 10.6.1. Uso el paquete completo de ArcGIS, incluyendo ArcServer y ArcMap con las siguientes extensiones: Network Analyst, Spatial Analyst y 3D Analyst. He tratado ArcGIS Pro pero todavía tiene algunos problemas. Entorno de la web, construí  todas nuestras paginas de web con la antigua tecnología de flash pero ya comencé a actualizarlos con la tecnología de Web AppBuilder.

4.  eSpatiallyNewYork: You left GIS  for a while to take another position in County Information Technology –  but then came back to GIS.  Tell us about that.

Munoz:  For me,  GIS & IT always go hand to hand.  While working  for the County,  I always found myself splitting my work projects between GIS & IT.  At the beginning of my career in order to build a better GIS program I had to build a better IT infrastructure.   During this time, I obtained a Windows & Network professional certification. Having this expanded  IT background gave me the opportunity to move to an IT Director position which at the time was a good professional advancement for me.   Two years ago, the County decided to upgrade the County’s  GIS and I was asked  to be part of the team to interview  candidates and  proposals. Going through this process reminded me how much I enjoyed geospatial technology so I made the decision to move back to managing the Orange County GIS program.

eSpatiallyNewYork:  Dejaste el SIG por un tiempo para tomar otra posición en el departamento de Información Tecnología del Condado – pero luego regresaste al SIG. Platícanos a cerca de esto.

Munoz:  Para mí, el SIG & la IT siempre van de la mano. Mientras trabajaba para el Condado, siempre me encontraba dividiendo mi tiempo y proyectos de trabajo entre SIG y IT. Al comienzo de mi carrera, para construir un mejor sistema de SIG tuve que construir una mejor infraestructura de IT. Durante este tiempo, obtuve una certificación profesional de Windows y Redes. Teniendo esta experiencia ampliada en IT me dio la oportunidad de cambiarme a un puesto de director de IT, lo que en ese momento fue un buen avance profesional para mí. Hace dos años, el Condado decidió actualizar el SIG del Condado y me pidieron que formara parte del equipo para entrevistar a los candidatos y sus propuestas. Ser parte de este proceso me recordó lo mucho que disfrutaba la tecnología geoespacial, así que tomé la decisión de regresar a dirigir el SIG del Condado de Orange.

5.  eSpatiallyNewYork: So which areas of County government are the biggest users of geospatial technology?

Munoz:  Definitely Emergency Services!   They have three divisions working  24×7 using and creating data everyday.  Second would be the Planning Department and following very close the Department of Public Works.

eSpatiallyNewYork:  Entonces, ¿Qué áreas del gobierno del Condado tiene los mayores usuarios de tecnología geoespacial?

Munoz:  Definitivamente el departamento de Servicios de Emergencia! Este departamento tiene tres divisiones que  trabajan 24×7 usando y creando datos todos los días. Segundo sería el Departamento de Planificación y siguiéndolo muy de cerca el Departamento de Obras Públicas.

6.  eSpatiallyNewYork:  The County still offers hardcopy maps, shapefiles, and other products for download.  How has this changed, if at all, over the years?

Munoz:  It seems that technology is always driving the associated GIS changes.  The GIS offices are quieter these days as the phones don’t ring as much.  We use to answer the phone constantly to take requests, return calls to inform the caller their  request had been completed.  Today, our online automated GIS request website has taken care of many of these issues.   Individuals can create accounts, make  mapping or data requests, and be notified when the request has been fulfilled with instructions on how to obtain the request.  The website also has an area for data downloads and can notify registered users when County data layers have been updated by our staff.

eSpatiallyNewYork:  El Condado todavía ofrece mapas impresos, shapefiles y otros productos para descargar. ¿Cómo ha cambiado esto, si es que ha cambiado, con los años?

Munoz:  Parece que la tecnología siempre está impulsando los cambios asociados al SIG. Las oficinas de SIG son más silenciosas en estos días ya que los teléfonos no suenan tanto. Solíamos contestar el teléfono constantemente para recibir pedidos, devolver llamadas a nuestros usuarios para informarles que su pedido esta completo. Hoy en día, nuestro sitio de web tiene un sistema de pedidos automatizados y se ocupa de muchos de estos problemas. Las personas pueden crear cuentas, realizar pedidos de mapas o datos y recibir notificaciones automatizadas cuando el pedido se haya cumplido e instrucciones sobre cómo obtenerlo. El sitio web también tiene un área para descarga de datos y puede notificar a los usuarios registrados cuando nosotros actualizamos las bases de datos del Condado.

7.  eSpatiallyNewYork: Any integration with the AutoCAD environment?

Munoz:  Currently, a  small group of engineers from DPW and the tax mapping division are the only ones that still use AutoCAD.  Some years ago the tax mappers started to maintained the parcel boundaries from their tax maps in  an enterprise database with AutoCAD.  As  previously mentioned, our current  GIS upgrade project includes moving the full tax map maintenance program  to our ArcGIS environment.  Stay tuned!

eSpatiallyNewYork:  ¿Alguna integración con el programa de AutoCAD?

Munoz:  Actualmente, solo un pequeño grupo de ingenieros de el Departamento de Obras Públicas y la división de mapas de cadastro son los únicos que todavía utilizan AutoCAD. Hace algunos años, los mapas de cadastro se comenzaron a mantener a través de una base de datos con AutoCAD. Como se mencionó anteriormente, nuestro proyecto actual de actualización del SIG incluye mover el programa de mantenimiento de mapas de cadastro a nuestro sistema de ArcGIS. ¡Mantente al tanto!

8.  eSpatiallyNewYork:  As GIS Manager, what are your biggest challenges today?

Munoz:  I would have to say staffing.  Believe it or not in the last two years I have had to replace the GIS technician positions four times.  While each time each person has been  a competent young professional,  It seems to me the new generation of GIS technicians wants to keep moving on with the next opportunity for advancement.  As opposed to staying in one place for while and building a career in one place.   I find myself training people to see them gone within  6 – 12 months.   A huge challenge!

eSpatiallyNewYork:  Como Gerente de SIG, ¿cuáles son tus mayores desafíos hoy?

Munoz:  Tendría que decir que es el personal. Lo creas o no, en los últimos dos años he tenido que reemplazar las posición de técnico en SIG cuatro veces. Cada vez la persona ha sido un joven profesional competente, pero me parece que la nueva generación de técnicos en SIG siempre anda buscando la próxima oportunidad de avance. A diferencia de permanecer en un lugar por un tiempo y construir una carrera en ese lugar. Me encuentro entrenando personas para que desaparezcan en los próximos 6 – 12 meses. ¡Un gran reto!

9.  eSpatiallyNewYork: What’s the next big geospatial thing in Orange County?

Munoz:  The County is finalizing the Orange County Shared Services Property Tax Savings Plan.  One section in particular reads:

The County of Orange will offer geographic information services (GIS) to any and all of its 43 municipalities. This will include all cartography and geographic data services such as map development, maintenance and printing.

Coordinating and standardizing 43 municipalities will be our biggest project and will keeps us busy for a good while.  I’m hoping for staff continuity!

eSpatiallyNewYork:  ¿Cuál es la próxima gran cosa geoespacial en el Condado de Orange?

Munoz:  El Condado está finalizando el Plan de Servicios Compartidos de Ahorro de Impuestos de la Propiedad del Condado de Orange. Una sección en particular dice:

El Condado de Orange ofrecerá servicios de información geográfica (SIG) a todos y cada uno de sus 43 municipios. Esto incluirá todos los servicios de cartografía y servicio de datos geográficos, como el desarrollo de mapas, el mantenimiento y la impresión.

Coordinar y estandarizar 43 municipios será nuestro mayor proyecto y nos mantendrá ocupados por un buen rato. ¡Espero y el personal sea continuo entonces!

10.  eSpatiallyNewYork:  You are of Hispanic background.  Do you have any thoughts or ideas on how GIS technology could be extended to the regional Spanish speaking population?  Where and how would you start?

Munoz:  The beauty of GIS is that it can help everyone in so many ways.  But the challenge continues to be building applications which are relevant, accessible, and easy to use.  Research show that Hispanics are less likely to have an internet connection at home.  Hispanics are early technology adopters, and Hispanics are mobile-first community. These statements contradict each other a bit but it is because the Hispanic demographic is young. Based on this information I would focus available resources to build, design and post GIS apps in Spanish on mobile platforms (cell phones and tablets) where we know Hispanics are spending their time. These early adopters will spread the message among their social groups faster than any other method.

eSpatiallyNewYork:  Eres de origen hispano. ¿Qué piensas o que ideas tienes sobre cómo la tecnología de Sistemas de Información Geográfica (SIG) podría extenderse a la población regional de habla hispana? ¿Dónde y cómo empezarías?

Munoz:  Lo bonito del SIG es que ayuda a todos, pero debemos asegurarnos de distribuirlo a ellos. Las investigaciones demuestran que los Hispanos tienen la menor probabilidad de tener una conexión de internet en casa, los Hispanos adoptan la tecnología tempranamente y son una comunidad que usan los dispositivos móviles primero. Estas declaraciones se contradicen un poco, pero es debido a que la demografía hispana es joven. Basado en esta información yo pondría todos los recursos disponibles en crear, diseñar y publicar aplicaciones de SIG en plataformas móviles (teléfonos celulares y tabletas) donde sabemos que los Hispanos pasan la mayoría de su tiempo. Estos pioneros difundirán el mensaje atreves de sus redes sociales más rápido que cualquier otro método.

2019 Westchester GIS User Group Meeting

Making it the largest annual event to date, nearly 200 individuals attended the 2019 Westchester GIS User Group Meeting May 16th at Purchase College. The annual event included a diverse mixture of user presentations and demonstrations for attendees representing local and county government, utilities, nonprofits,  business and industry, and academia (both college and high school programs). Faculty and facility support from the College’s Environmental Studies program and sponsorship from twelve vendors again helped enable the Westchester County GIS community to meet and discuss the countywide geospatial agenda.  And by virtue of the venue, promoting SUNY GIS educational opportunities as well.   It was a great GIS day for all attending and participating.

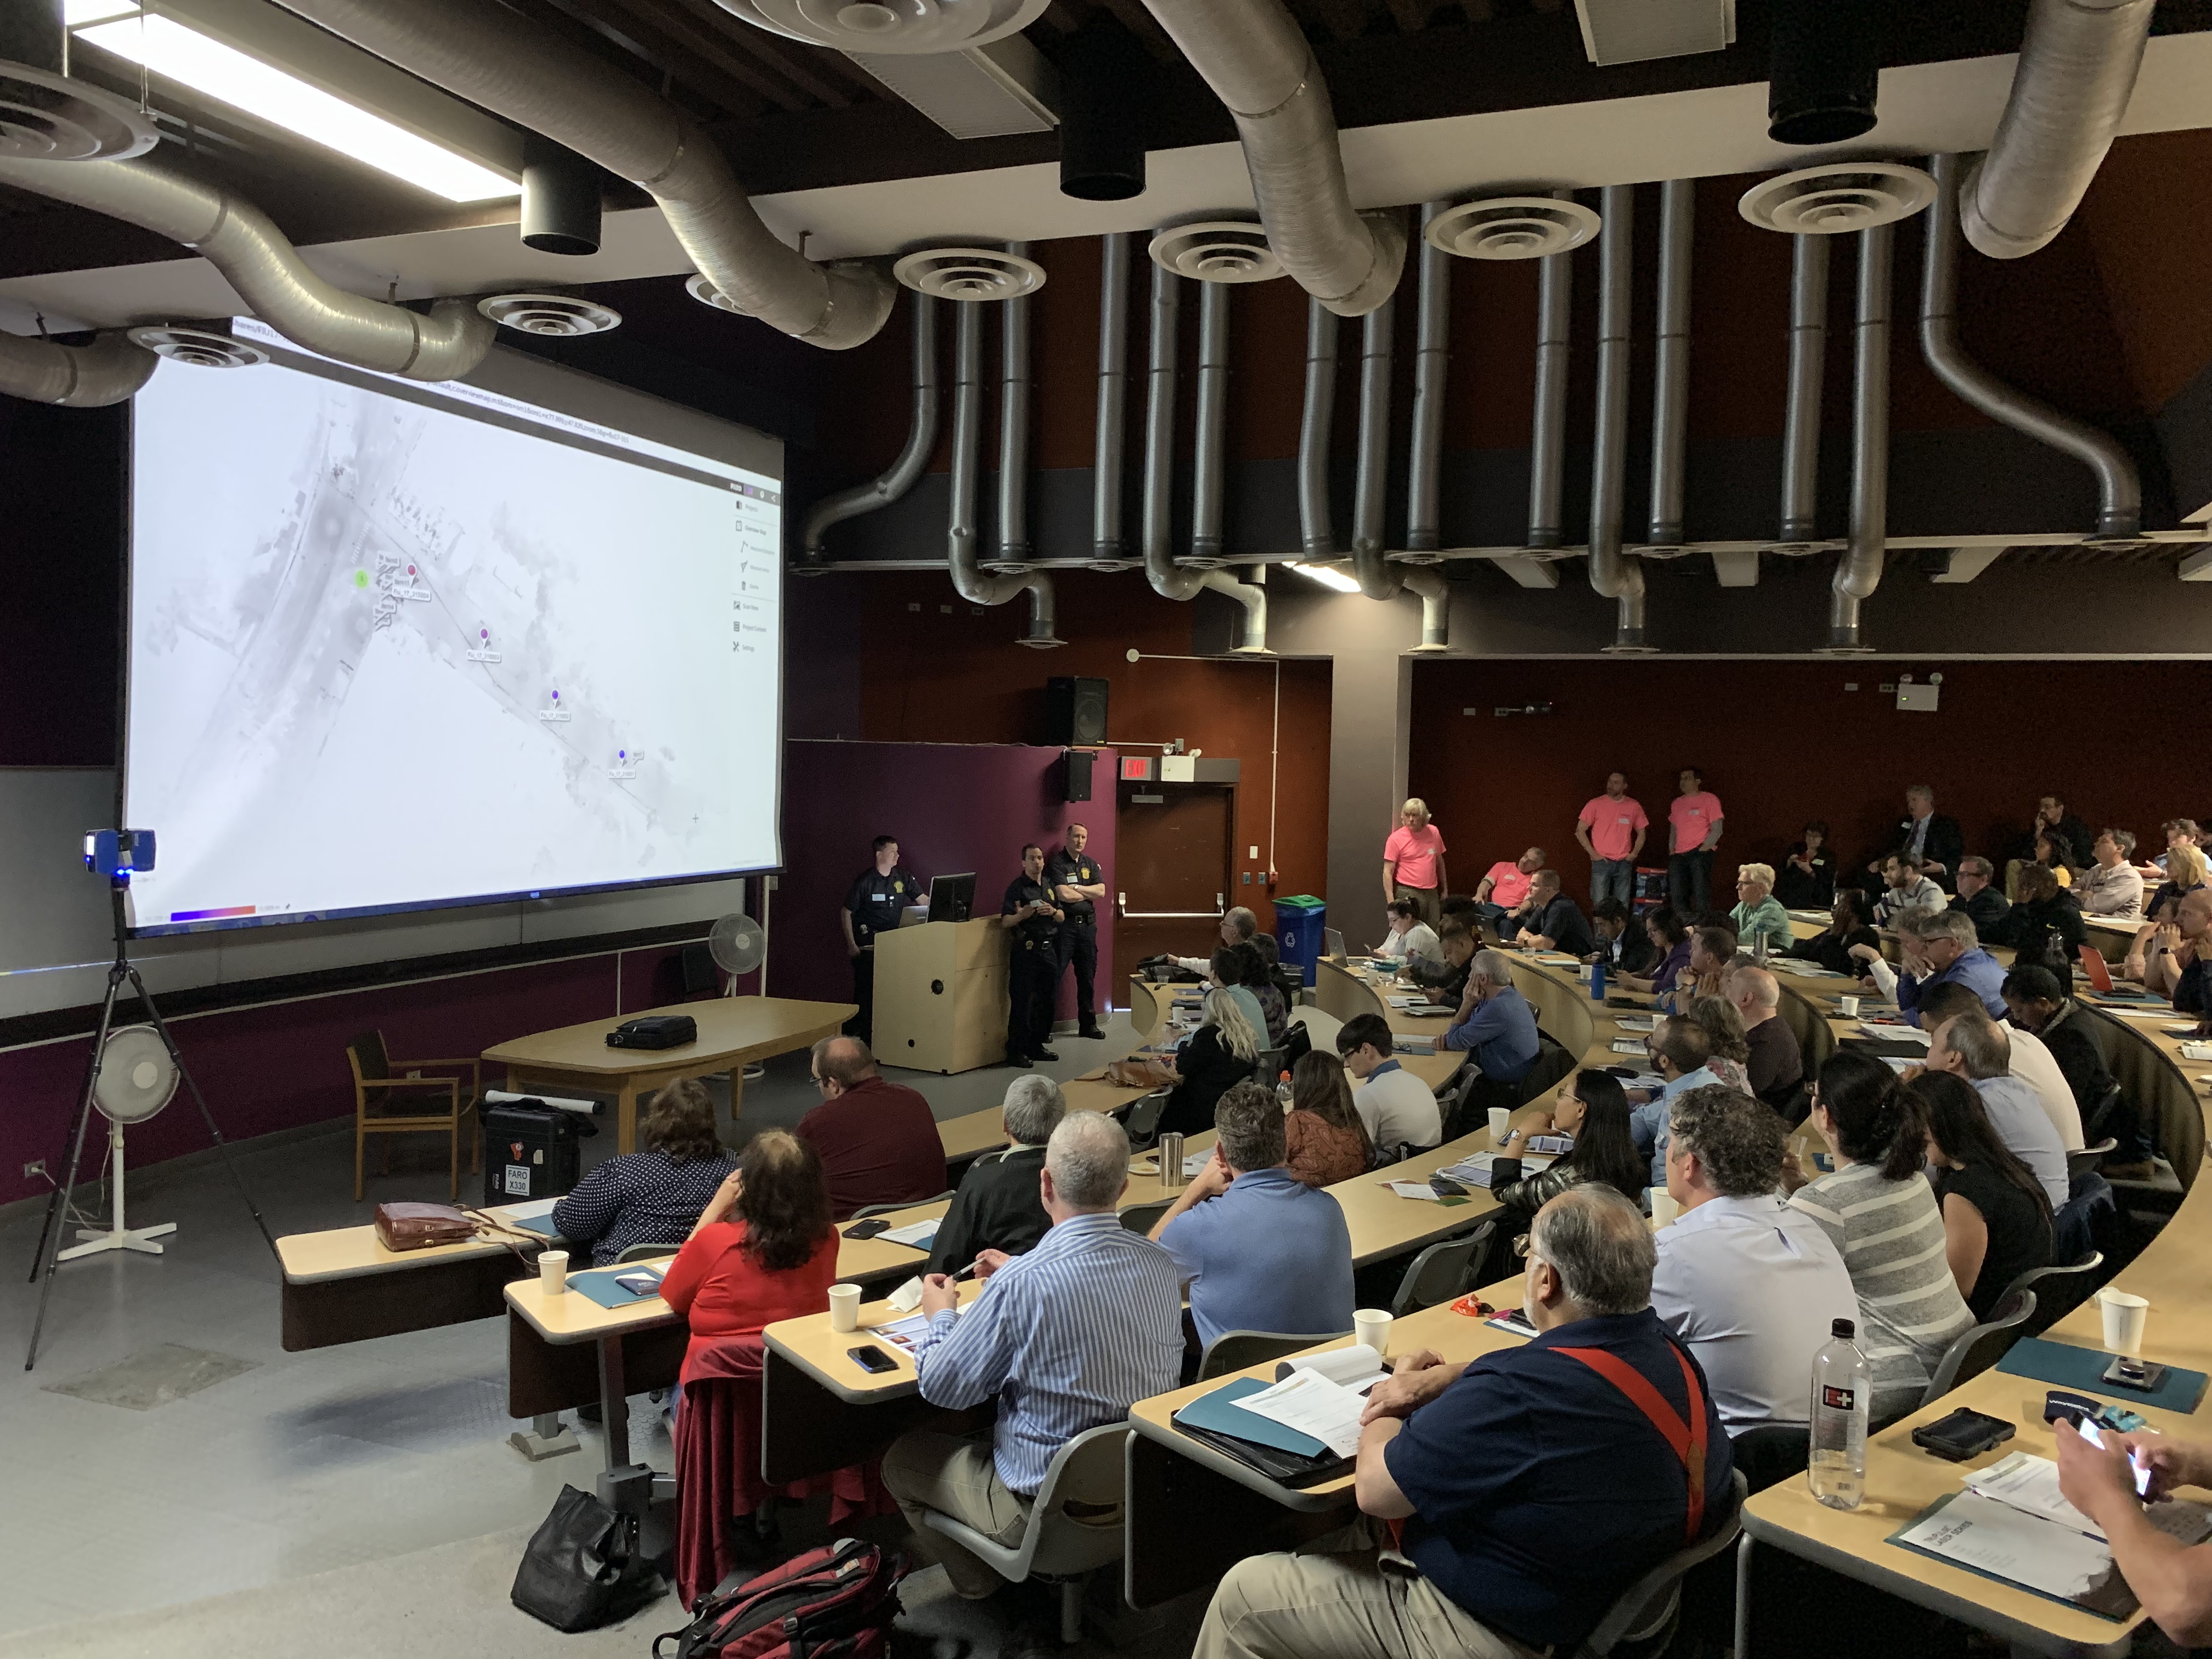
As the day progressed, nearly 200 registrants assembled as part of the 2019 Westchester GIS User Group Meeting at Purchase College. The main lecture auditorium was filled to capacity with standing room only by mid-morning.

2019 Agenda and Speakers

While the 2018 agenda had a specific theme, this year’s agenda was intended to be more diverse covering a wide range of topics including health and human services, pavement management systems, oblique imagery applications, training workshops, forestry inventories, public safety, mapping and visualizing the human brain, the 2020 Census, and a special presentation by ESRI focusing on accessing the County’s new planimetric datasets via web services.

Session I:  Allison McSpedon and Jeff Worden from the Westchester County Continuum of Care Partnership for the Homeless led the day off with a presentation focusing on the use of mobile technology as part of the annual Homeless Point in Time (PIT) Count taken in January 2019.  This was followed by Nancy Birnbaum, Manager of Software Architecture, Westchester County Dept. of Information Technology who presented the new Westchester County Online Community Mental Health Directory.

Managers from the Continuum of Care Partnership for the Homeless detailed the pros and cons on the use of mobile data collection technology as part of the January 2019 count. They anticipate even better results and ease of use when deployed in the next count.

Andrew Reinmann, Advanced Science Research Center, Graduate Center of CUNY and Department of Geography, Hunter College followed with the use of geospatial tools as part of the Westchester County Forestry Inventory: Mapping and Ecosystem Services Assessment.  The morning session ended with a series of lightning talks highlighting the use of the County’s new oblique imagery.

Session II: After intermission, VHB and staff from Westchester County Dept. of Public Works and Transportation discussed the new Smart Asset Management and Inventory System (SAMIS) application which was followed by an excellent demonstration on the use of Laser Scanning technology by the Westchester County Police Forensic Investigations Unit.  Patrick Gahagan, Technical Analyst at ESRI finished the morning session discussing advancements in civil engineering and surveying integration between the Autodesk and ESRI platforms.

Detectives from the County Police Forensic Unit captivated the audience on the use of laser scanning in crime scene investigations. GIS staff is now working with the Forensic Unit on integrating laser scanning data into the enterprise GIS environment.

Session III:  After lunch – and an audience participation session of GeoJeopardy – Jonathan A. N. Fisher, Ph.D., Director of the nearby Neurosensory Engineering Lab at the  New York Medical College in Valhalla provided an overview of his project called Neurodome which centers on the mapping of the human brain with an assortment of technology and visualization tools.   Daniel Wickens, Solution Engineer from ESRI then gave two overviews on “What’s New with ArcGIS Field Apps and ArcGIS Online.”  Concurrently in separate locations training classes were offered on how to use the new online CONNECTExplorer oblique imagery viewer and the ESRI “Explore Future Climate Change” tutorial.

Session IV:  The last section of the agenda was brief and included an update on mapping efforts association with the 2020 Census by Margaret Baker, Geographer, from the U.S. Census Bureau Manhattan office.  The final presentation by Westchester County GIS staff included the latest developments and anticipated upgrades to the Westchester County GIS website including the scheduled launch of the Westchester GIS Geospatial Gateway

Individual meeting presentations can be accessed and downloaded using this link.

The U.S. Census Bureau is ramping up for the 2020 Census and has a variety of mapping and geospatial products in their toolbox. GIS technology is essential in helping identify areas which have had low counts and responses.

Little Things Make it Work

I’ve written before about the small details which we believe enable the Annual Westchester GIS User Group Meeting to continue to be successful – and we’re the first to admit there is always the element of luck.  Even the weather matters.  To the extent possible, elements such as keeping the content and speakers “Westchester” focused, minimal –  if any –  registration fees, lots of time for interaction with the sponsors on the exhibit floor, and the centrally located venue at Purchase College – all matter. One of the ironies, and downsides, of having the show on a college campus in mid-to-late May is that spring semester is already over and students have fled campus.  However,  there is normally a handful attending looking for summer or full-time work and passing out resumes.    The naturally lighted vendor area in the Natural Sciences Building, albeit small, adds to the personal “feel” of the show.    Easy access and plenty of parking is also essential.  And don’t forget lots of proactive outreach to the professional organizations and societies  we work with on a day-to-day basis:  police/fire, engineering, surveying, public works, assessors, nonprofits, and the planning community.   The added message here is to encourage consultants which are supporting local governments across the county – to attend the meeting.  To learn more about accessing and leveraging Westchester County GIS products and services and how this improves service and cost efficiencies to municipalities they serve.   Individually, any of these items listed above may seem trivial,  but they all add up in delivering a show that will bring the same people back next year.

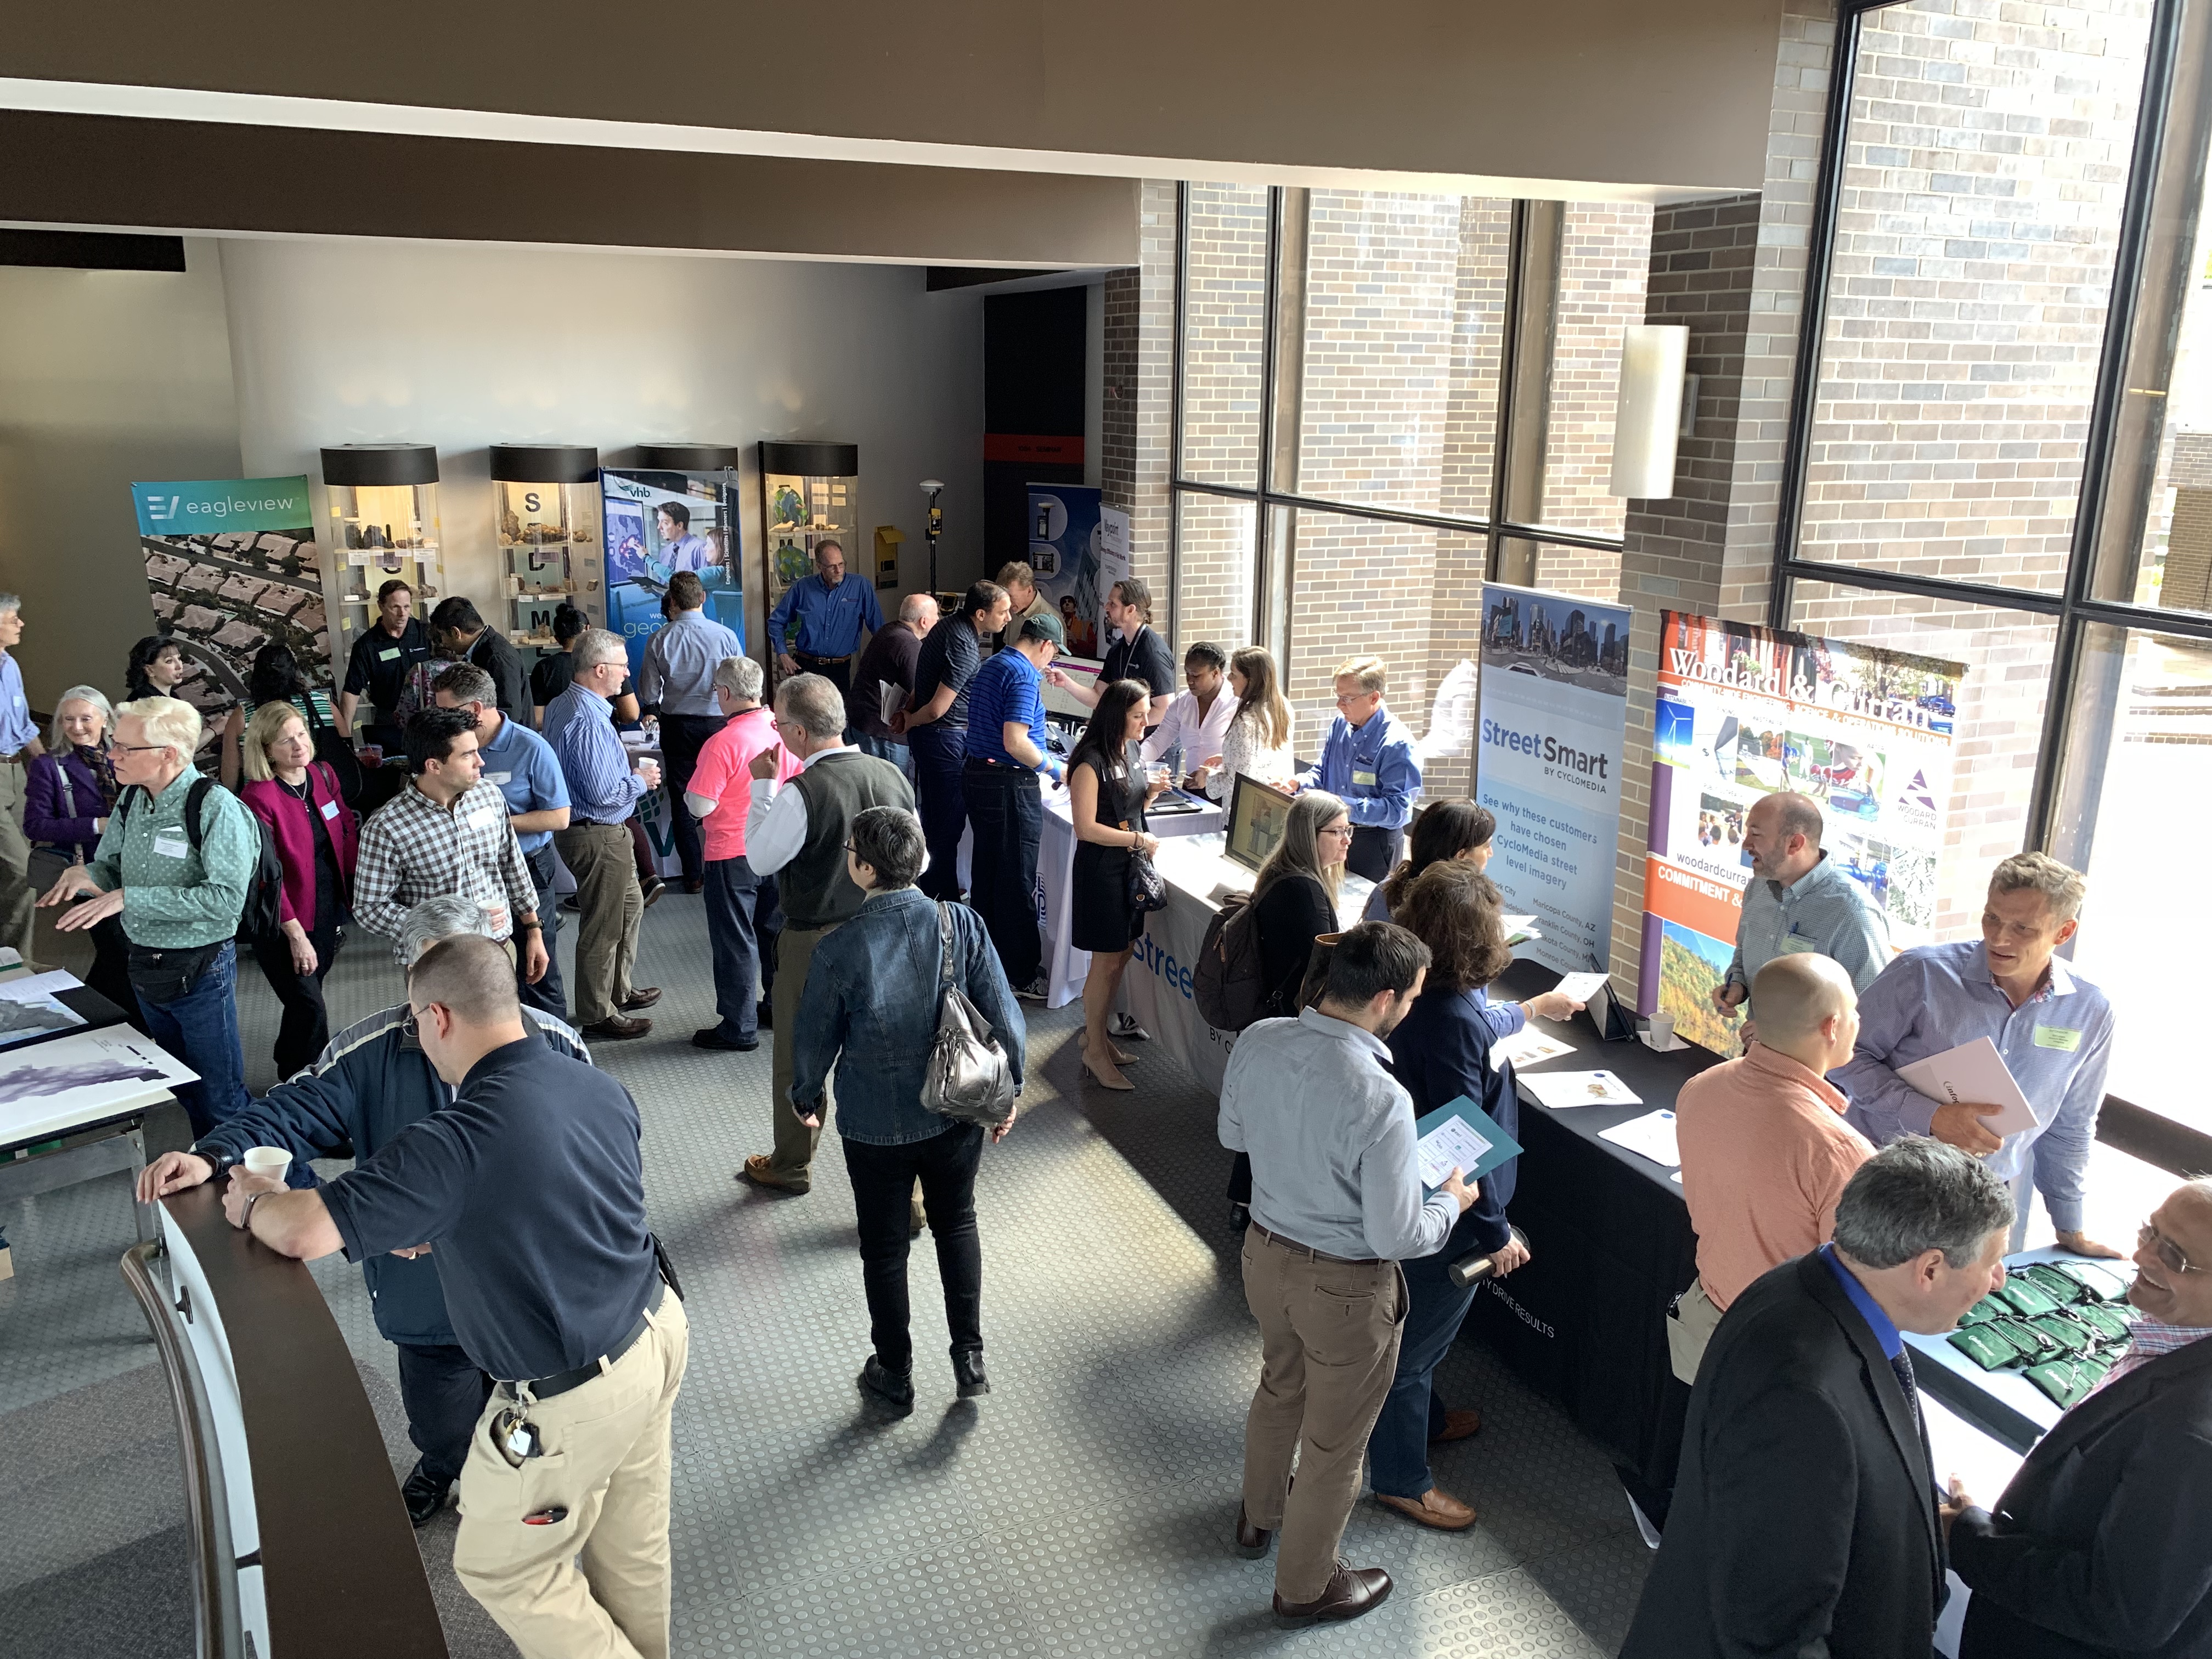
The exhibit floor was busy (and loud!) during breaks with all vendors noting interaction with attendees was good and productive. All attendees can complete a Vendor Bingo Card and be eligible for a raffle prize at the end of the day. This year’s prize was a vendor donated iPad!

Summary

Over the next couple weeks, conference organizers will be sending out a survey to both attendees and vendors to gather more detailed information on the various elements (presentations, speakers, refreshments/breaks, vendor interaction/feedback, facility issues and the like) of the show.  This information will help guide decisions about content and any changes that may need to be made, if any, about the structure of the show.

Staff will take a few months off and begin planning for the 2020 show in the fall of this year.  In doing so, we look forward to the continued relevance and position of the Westchester GIS User Group Meeting in promoting countywide geospatial development and use.

NYSAPLS 60th Annual Conference January 28-30 Saratoga Springs

eSpatiallyNewYork had the opportunity to participate in the recent New York State Association of Professional Land Surveyors (NYSAPLS) annual conference in Saratoga Springs in late January.  In doing so, I was able to meet with numerous NYSAPLS members, including briefly with current NYSAPLS President Greg de Bruin, as well as several vendors in the exhibit hall.  Having run almost exclusively in the statewide GIS circle for the past 25+ years, and having really no reference point what to expect at the show – I was not disappointed.

The three-day conference brought together 704 registered attendees with the overall total reaching 775 when including 31 exhibitor representatives.  While I was almost certain to see components of the traditional surveying profession (i.e.,  leveling rods, measuring tapes, tripods, safety equipment/clothing, nails and spikes, monuments,  flagging and marking paints – the customary surveying equipment fare), I was pleasantly surprised to see in both the exhibit hall and throughout individual presentations evidence of the statewide surveying community investing in a variety of developing technologies such as laser scanning, drones, 3D, advanced GPS and photogrammetry, and an abundant number of emerging mobile and field programs.   Quite noticeably, surveying firms offering a broader range of geospatial products and services.   It was clear on the exhibit hall alone how the Empire State surveying community is embracing state-of-the-art geospatial technologies in 2019.

The exhibit hall at this year’s NYSAPLS conference offered an impressive line-up of vendors. The daily Strolling Lunch with Exhibitors engages attendees with the exhibitors.

The conference offered a very diverse range of presentations, classes and workshops.  Of particular interest was to see presentations focusing on Building Information Modeling (BIM), 3D Building Rights and Air Rights, and several focusing on the drone/UAV.  Given the surveying profession’s important role in the development and maintenance of statewide tax maps, there were a number of sessions dedicated to the issues associated with land ownership including easements and right-of-ways, tying into and using historical documentation, tides and tidal datums, highway law, and even canal boundary retracement.  Though I was unable to attend, a class on stone walls focusing on their importance in land records and property boundary definition  was held.  Even a class on “Dendrology for Surveyors” class was included on the agenda. Of course there was a very visible presence of the field of photogrammetry which remains a staple throughout the profession, while new capabilities in the field of underground and subsurface mapping were also on display.  Making reference to the range of content at the conference, Ben Houston, Professional Engineer, Associate Member of NYSAPLS and NYS GIS Association Board Member commented  “This year’s NYSAPLS Conference offered a nice mix of training and social/networking opportunities. I was particularly impressed at the number and variety of professional services and geospatial data vendors in the exhibit hall.”

Of course there was ample time for mixers and social events at this year’s NYSAPLS conference. One of the Special Events at the show was the Field Olympics. Participants were able to compete against others in three events one of which was Tree Identification. Is that Ginkgo Biloba in #4? And here are the winners of this year’s map contest!

An important takeaway for me from the NYSAPLS conference was the focus on the business of surveying.  A geospatial profession largely dominated by private practice, business and industry, and enabling itself to create a presence in Albany.  As part of this presence, NYAPLS has recently created a Political Action Committee (PAC).  PACs are a type of political committee, once properly registered, which can engage in promoting candidates for election to public office that share the views, interests, and concerns of the land surveying community. This new committee is one of several active NYSAPLS groups working on issues such as standards and strategic planning.  Outreach and communication to the professional engineering communities and the State Board for engineering, land surveying, and geology remain priorities as well. (New York State professional surveyor accreditation and licensing is administered through the NYS Education Department Office of the Professions.)  “This year’s conference was outstanding”, notes current NYSAPLS President Greg de Bruin, “the facility, content, conference coordination were all first rate.”

For those involved in mapping technologies within the Empire State, it’s worth the time to visit the NYSAPLS website to see the many areas and programs this professional organization touches across the geospatial community.  There are a multitude of opportunities for collaboration.

Contact:

Amber Carpenter
amber@nysapls.org
518-432-4046

Greg de Bruin
gdebruin@gayrondebruin.com
516-805-4118

Wayfinding: Geospatial Goes Indoors with Connexient

As GIS and mapping technologies evolved through the later part of the 20th century focusing mainly on the physical(outdoor)  landscape, the digital mapping of the  built/interior environment continued to focus on the use of AutoCAD/Revit and related CAD technologies.  With exceptions, there were two definitive geographic mapping camps:  Geographic Information Systems (GIS) software vs. Computer Aided Design (CAD) software.   One or the other.  And with little integration of both.

As both technologies matured, integration between the two computing environments became more common and the lines of division blurred.  New technologies including, but not limited to Global Positioning Systems (GPS), Laser Scanning, Building Information Modeling (BIM), and drones, as well as advancements in 3D modeling and increased desktop and internet capacity aided to the continued integration of the software platforms. GIS and BIM Integration Will Transform Infrastructure Design and Construction is a very recent and quick read from Autodesk charting the path of this flourishing market.

Fast forward to 2018 and the evolution of indoor wayfinding which leverages many of the components of these same outdoor and indoor mapping concepts.   Based on a similar spatial data model, Wayfinding applications are now found in a wide range of public spaces, educational and industrial campuses, entertainment and athletic venues, buildings, and healthcare facilities.  Offering indoor maps for handheld mobile devices is becoming more and more common, as are digital information kiosk systems in office complex lobbies, and as part of web mapping applications. (It is often recognized that The Americans with Disabilities Act of 1990 (ADA) represented a milestone and was instrumental in helping to make spaces universally accessible and improving wayfinding for all individuals.)

Connexient

New York City-based Connexient was formed in June 2012 with the vision that indoor GPS and navigation will become as widespread inside as it is outside.

With over 60 licensed hospital client sites and a total square footage over 70 million square feet mapped, Connexient is a market leader in healthcare in providing  smart phone based turn-by-turn indoor navigation and all screens digital wayfinding solutions.   Leveraging significant breakthroughs in the ability to implement low cost, navigation quality indoor positioning, users can now expect the same kind of functionality –  intuitive, reliable and accurate maps, directions and turn-by-turn navigation which is commonly available from outdoor world mapping and navigational companies such as Google, Apple and Waze.    The same user experience can be available via a mobile app for any large, complex indoor facility or campus that they enter.  Today, these capabilities are highlighted in Connexient’s flagship product MediNavTM.

Selected MediNav functions include:

  • Multiple levels of zoom and detail
  • 5D visualization and 360 degrees of freedom of camera control
  • Detailed routing network and intelligent routing
  • Turn-by-turn instructions
  • Visual landmarks (signage) to provide locational reference
  • Visual and audio turn prompts
  • Off-route notification & route recalculation
  • “Balcony view” route visualization – what is coming next
  • 1 to 2 meter accuracy
  • Dynamic refresh of user position
  • Parking Planner, Find my Car and Meet Me
    Continue reading

Geospatial Business Spotlight: CycloMedia Technology, Inc.

Company Name:       CycloMedia Technology Inc.

Location:                   Berkeley, CA

Website:                    www.cyclomedia.com

Employees:               120 Globally

Established:              1981

A privately held company, founded in the Netherlands over thirty years ago, CycloMedia Technology, Inc. is a rapidly expanding international company with staff in Syracuse, New York.  Annually, CycloMedia captures and processes approximately 160,000 linear miles of 360° panoramic street level images, representing over 48 million recordings per year. The company holds five key image capture technology patents and specializes in the local government market. Currently the company has projects with the cities of New York, Philadelphia, Washington DC, as well as  Franklin County, OH (Columbus), Dakota County, MN (Minneapolis) and Jefferson County, KY (Louisville) to name a few.

Specific benefits of Cyclomedia technology include:

  • GeoCyclorama images and basemaps are geographically linked
  • Provides ability to conduct searches with address, postal code or coordinates
  • Integrate with interprise applications and work processes using the GlobeSpotter API
  • Determine the location and dimensions of objects in GeoCyclorama imagery
  • Ability to create precise point, line and area measurements
  • Overlay enterprise spatial data on the GeoCyclorama images
  • Supports Open Geospatial Consortium (OGC) standards
  • Integrate data in formats such as WFS, WMS, Shapefile and GML
  • Create reports and bookmark locations of interest
  • Users can save and utilize GeoCyclorama images for reporting and analysis functions.

Geospatial Products and Services:

A.  GlobeSpotter

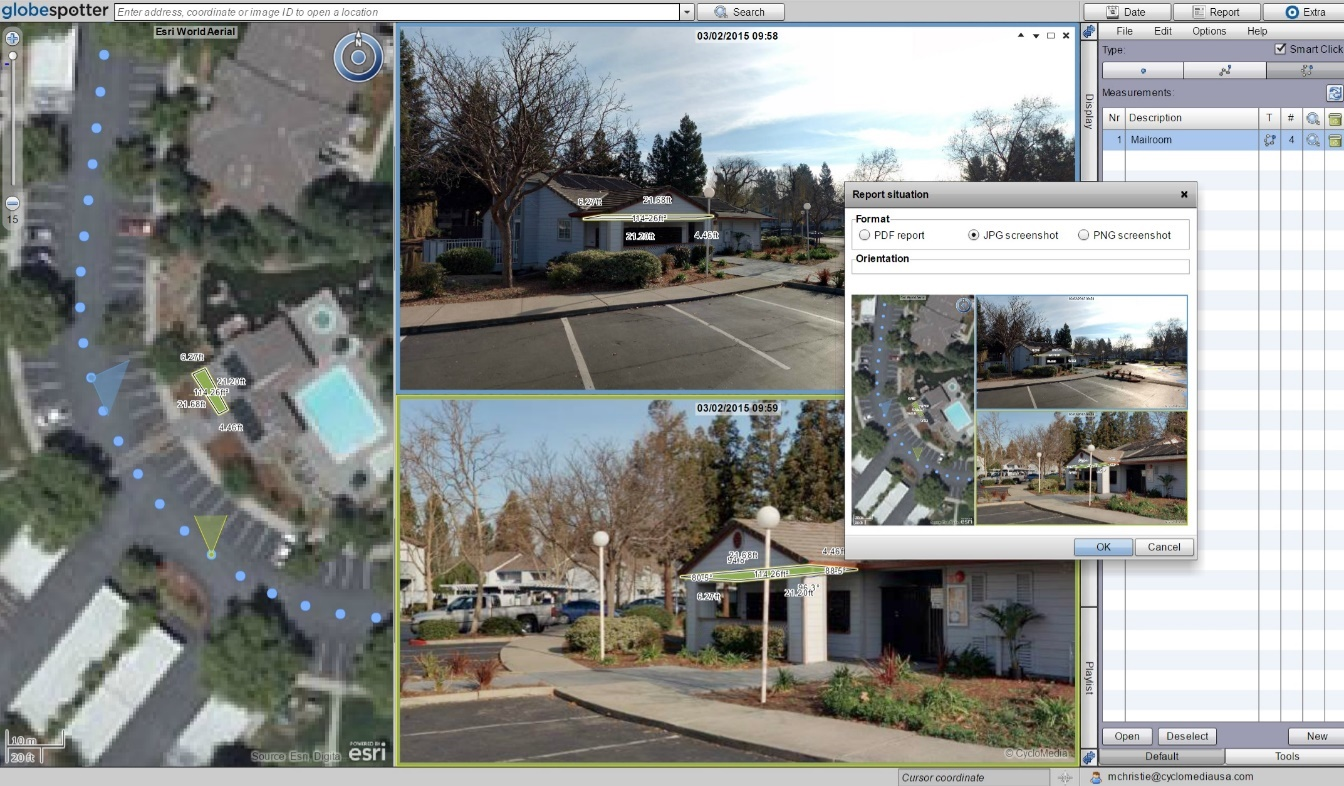
GlobeSpotter (web) is an interactive web-based application that provides cloud access to GeoCyclorama imagery and tools for measuring, collecting data, and reporting.  The software and data are directly available from CycloMedia’s software as a service (SaaS) model.

GlobeSpotter (web) screenshot with area measurement and reporting window 

GlobeSpotter for ArcGIS Desktop  provides visualization, measurement and overlay tools within the ArcMap or ArcGIS Pro allowing a user to fully leverage the power of GeoCycloramas within the ArcGIS client environment.  Specific capabilities include:

    • Open GeoCyclorama imagery from a recording point layer added to the map
    • View one or multiple GeoCyclorama images
    • Measure on GeoCyclorama images
    • Use the native editing capabilities of ArcGIS to collect features in 2D or 3D
    • Ability to save and utilize GeoCyclorama images for reporting and analysis functions.

Continue reading

Geospatial Technologies at the New York State Museum

While in and out of Albany for nearly 34 years as part of public service, I’ve been on and around the Empire State Plaza probably close to 100 times, if not more.  At the western end of the plaza is the Cultural Education Center (CEC) which operates under the auspices of the State Education Department.  The CEC houses the State Museum, State Library, and the State Archives.  Back in the day, when the State Archives was known as the State Archives and Records Adminstration (SARA), the statewide GIS community had a much closer association with the CEC when SARA was an early source of funding for GIS implementation and hardcopy conversion grants.  Over the years, these GIS centric funding sources, which are still administered through the  LOCAL GOVERNMENT RECORDS MANAGEMENT IMPROVEMENT FUND (LGRMIF) have become much more limited as program criteria and focus has changed significantly.  More recently, it was a discussion with Susan Winchell-Sweeney in the Anthropology Department at the State Museum which became the genesis of this article learning more about the expanding use of geospatial technologies in different program areas within the Museum.  (Note:  As part of this article, certain maps, due primarily to size, are available via Google Drive.  These documents are referenced in the appropriate location in the article and can be accessed via a hyperlink.)

New York State Geological Survey (NYSGS)

From its beginning in 1836, the New York State Museum has been home to some of the nation’s leading scientists, including pioneers in archaeology, paleontology, ethnology, and botany. Its collections now rank among the finest in many fields and total more than sixteen million specimens, objects, and artifacts.  A long time contributor to statewide mapping,  the State Museum is home to the New York Geological Survey (NYSGS) which produces GIS datasets and  map & charts products.  The Survey has a broad mission of geologic research, investigation, and mapping across the Empire State and is committed to making the resulting geologic knowledge of their work readily and publically available.

First introduced in 1960, the Maps & Charts series combines large format graphics with associated text with emphasis on the graphic in lieu of descriptive text. The primary purpose of the series is to document surface and subsurface geologic data that are difficult to present in other formats. Many geologic maps are published in this series. Since 2006 geologic mapping at the New York State Museum has benefitted from cooperative federal partnerships mainly through the U.S Geological Survey.  Traditional geologic mapping has been enhanced by technological developments such high resolution LIDAR terrain models. Many products contain both a surface map of geologic formations and materials as well as subsurface geologic cross sections. NYSGS also maintains a limited number of GIS datasets (shapefiles) which can be found on their website including Bedrock and Surficial geology, statewide Physiographic Provinces map, and Brittle Structures of New York.

Illustrative of the many outstanding hard copy map products available from NYSGS, this Moravia Quadrangle surficial geology update documents existing environmental and landscape conditions, as well as field data collection efforts in producing the map. Great content for an online StoryMap! (Google Drive: #1MoraviaQuad)

Using AutoCAD

One of the more interesting elements of my interviews and discussion with Museum staff as part of this article was learning how CADD (yes, as in Computer Aided Design and Drafting) is used among professional staff.  While the GIS community routinely recognizes and acknowledges the contribution of CAD community in the broad geospatial effort, its use on a day-to-day use is often innocuous.  All the more interesting a find on the desktop in the State Museum.

In this user space at the Museum is Heather Clark, who is a  drafter and Principal Investigator with the Cultural Resource Survey Progarm (CRSP).  She works extensively with AutoCAD as part of aiding interpretations at archeological sites.   And it should come as no surprise that much of her work – and the CRSP program as a whole – comes from conducting archeological and historical district studies as part of New York State Dept. of Transportation projects.  Though she also works on projects with Dept. of Conservation, Office of General Services, Dept. of Corrections, and Canal Corps.

Heather focuses on making project maps for archaeological crews to take out in the field prior to digging a project.  Sometimes the maps include DOT provided georeferenced base maps or AutoCAD generated files.  She’ll also often make maps from scratch from “heads-up” digitizing from orthophotos.  Project principal investigators provide pertinent information regarding testing locations and site information (both historic and prehistoric archaeological sites) from the field work which she adds to the maps for their final reports.  She also makes thematic maps (soil maps, density maps, contour maps) depending on the principal investigator’s needs, as well as maps for  architectural historians identifying historical districts and National Register Eligible structures.  Recently CRSP staff have been doing a more thorough geophysical survey using both  Ground Penetrating Radar (GPR) and  Magnetic Susceptibility Meter instruments.  (As part of this article I was able to share with CRPS staff how the AutoCAD client is capable of consuming map services.  Many of the planimetric features Heather uses in creating map products for field crews – at least within the Westchester County footprint – are made available in map services published by Westchester County GIS.)

Heather started working at the Museum in 2005.  She received her Bachelors and Masters Degrees in Anthropology at the University at Albany and recently completed a graduate certificate in Geospatial Intelligence at Penn State.  CRSP staff often have the opportunity to engage in independent research.  In this regard, Heather notes “My work here at the Museum has developed from my love of New York State history, particularly domestic sites and activity from colonization to the early historic period. Additionally, I am interested in the faunal analysis of archaeological sites as a tool to learn about food consumption practices and site use.”    Heather can be reached at heather.clark@nysed.gov.

AutoCAD generated file highlighting project limits, waterways, edge of pavement, guard rails, wetland areas and other features.

In the same project area, to determine if there may be an archaeologically significant sites, CRSP staff systematically tests the area with circular 40 cm round pits to identify soils and associative artifacts for each soil stratum (orange annotation.)

Archaeology Projects

Archaeology is concerned with the spatial relationships of materials and features, and the recording and visualizing of these finds and their locations is an important aspect of the archaeological process. In curatorial research conducted by the Anthropology Department, geographic information systems and mapping techniques are utilized during the various phases of excavation and analysis.  Instrumental in expanding the use of geospatial technology in the Anthropology Department has been Historical Archaeological Technician, Susan Winchell-Sweeney.

Prior to her work with the Museum, Susan, who has a  BS degree in Archaeology and Soil Science and a professional certification in GIS (GISP),  worked in several archaeology and GIS capacities at Bard College.  She also collaborated with the State Museum’s  archaeological staff on a research project in the Southern Adirondacks and did an undergraduate internship in the 1990s learning how to use ArcINFO on a Unix Workstation making surficial and bedrock maps under the direction of Dave Gerhard.

Upon her arrival at the Museum as a full-time employee in 2007, Susan began using ArcMap GIS software in the management of the South Street Seaport Museum historical archaeological collection. This collection from New York City resulted from some of the largest professionally conducted urban excavations in North America. Spanning over 300 years of Manhattan history, the two million artifacts constitute the greatest extant collection of archaeological materials from 17th-century Dutch New Amsterdam and includes remains from 18th-century English Colonial and early 19th-century American Republic periods as well. Now under the stewardship of the New York State Museum in Albany, the collection is undergoing extensive processing so that it may be utilized for archaeological and historical research. While this preparation is underway (a task likely to take more than ten years to complete), GIS  aids in inventory management, and provides context for the original buried artifact sites. An exhibit mounted in 2009 entitled, “Where Did They Come From, and Where Are They Now? The Artifacts of the South Street Seaport Museum,” highlighted this use, and originated as a poster presented at the 2007 NYS GIS conference in Albany.  (Google Drive: #2SouthStreetSeaport)

Other representative geospatial efforts by Susan as part of her work with archaeological efforts at the Museum include:

Deuel Family Cemetery
Washington County, New York

Both CRSP and Anthropology staff initiated a geophysical survey at the Deuel Family Cemetery under the direction of the bioarchaeologist, Lisa Anderson. She was contacted after the accidental discovery of skeleton remains from an unmapped historic cemetery,  and asked to determine if other unmarked graves might exist.  As part of this work, both GPR and MS technologies were deployed.  Magnetic susceptibility (MS) is another geophysical technique becoming increasing more popular for archaeological investigations in the US (it’s been around for quite a while in Europe). In very simple terms, an MS meter measures how “magnetizable” soil is, which can be a marker of past human activity. The anomalies seen in the project map (the darkest areas) are likely grave shaft locations consistent with less compacted soil, organic material, and perhaps iron coffin hardware which could account for higher MS readings. Because different geophysical techniques measure different properties, it is often useful to use more than one on an archaeological site. The green circles on this map indicate areas where both MS and ground-penetrating radar (GPR) identified anomalies.   The MS survey interval necessary to pick up something the size of an historic grave shaft requires taking a reading every 25 cm, along transects only half a meter apart  which is extremely time-consuming.  At this project site, Museum staff had only two days to collect data.  (Google Drive: #3DeuelFamilyCemetery)   

The Hurley Site
Esopus River Valley, New York

This project was created to support the research of Dr. John Hart, which focuses “primarily on the histories of maize, bean, and squash in New York and the greater Northeast and the interactions of human populations with these crops.” His work has essentially pushed back the dates of the beginning of agriculture in the Northeast (a sometimes hotly debated topic in archaeology). The Hurley site, located in the Esopus Creek valley of eastern New York, was excavated in the 1950s and 60s. The collection is now curated by the New York State Museum. The GIS map and database were produced from hand-drawn, decades-old field notes (Susan digitized the pits and features; Dr. Hart created a spreadsheet with over twenty fields defining pit characteristics – this was then joined to the digitized features, allowing for a myriad of queries and visual representations.) (Google Drive: #4HurleySite

Evidence from the Hurley site including 439 deep pits, some with massive deposits of maize kernels, and human dental pathologies suggest that maize-based agriculture was a significant component of early subsistence systems. The Hurley site adds to the State’s understanding of the diversity of subsistence practices in historical Algonquian territories prior to European incursions.

Van Schaick Mansion Cemetery
Cohoes, New York

In 2016, the New York State Museum in collaboration with the Horsley Archeological Prospection completed a Ground Pentrating Radar survey of the Van Schaick Mansion Cemetery to determine if unmarked graves could be identified.  Commissioned by The Chapter House for Gen. Peter Gansevoort Chapter of the Daughters of the American Revolution (who own the property) final interpretation and survey results shown in this map were completed in early 2017. This a multi-year project looking at a wide range of historical items and trends at the property.  (Google Drive:  #5VanSchaickCemetery)

GIS Analysis to Model Paleoindian Pathways
Northeastern United States

Finally, in collaboration with University of Montreal researchers and curator of archaeology, Dr. Jonathan Lothrop, Susan’s 2017 NYS GeoCon poster highlighted the use of GIS software in calculating the estimated Least Cost Path (LCP) of Paleoindian Pathways throughout the Northeast in search of and harvesting  Normanskill chert as part of toolstone acquisition. This is an awesome hardcopy cartographic product.  (Google Drive: #6NYS2017GeoCon)

Contact Susan @ susan.winchell-sweeney@nysed.gov for more information on the use of geospatial technology in archaeology at the State Museum.

Uses of Lidar

Advancements and use of lidar technology is having a profound impact on mapping and research by scientists in the Museum.  Bare earth models allow staff to visualize the landscape in unprecedented resolution and provide the ability to identify previously unrecognized glacial landforms which is useful in both surficial and bedrock mapping as well as for archeological exploration.   Early elevation models were constructed from grids that used 30 meter by 30 meter cells and then  later models used 10 meter by 10 meter cells. In comparison state of the art LIDAR produces much finer resolution grid cells.  Such resolution enables researchers to target certain glacial landforms or specific archeological sites for further investigation.

Examples of bare earth comparisons between LIDAR images at A) 30M, B) 10M, and C) 2M resolution.

Lidar is also useful for museum archaeologists who are sometimes called upon to investigate “discoveries” of historic sites by well-meaning members of the public  By example, there was a request  by a local conservation group in the Catskills to answer a question about “monumental and extraordinary stone structures built by an ancient race for ceremonial purposes – celestial alignment, etc.”.  And having access to good lidar data for the particular area in question helped staff to determine that the features in fact were ordinary stone walls marking property boundaries – older yes, but not ancient or mysterious.

Area reported to contain “monumental and extraordinary stone structures in celestial alignment – perhaps built by an ancient race for ceremonial purposes.”

Lidar data reveals “unique features” are really no more than normal stone walls marking former property boundaries.

Coincidentally, during the preparation of this article, lidar was highlighted in what’s being hailed as a “major breakthrough” in Maya archaeology.   Researchers, which included Thomas Garrison, assistant professor of anthropology at Ithaca College, have recently identified the ruins of more than 60,000 houses, palaces, elevated highways, and other human-made features that have been hidden for centuries under the jungles of northern Guatemala.  The Lidar survey of 2,100-square kilometers encompassed several major Maya sites, including the largest at Tikal, and El Zotz, where Garrison focuses his research.

Laser scans revealed more than 60,000 previously unknown Maya structures that were part of a vast network of cities, fortifications, farms, and highways.

Summary

The above language and maps only begin to highlight the broad use of geospatial technology in the New York State Museum.  While presentations by Museum staff are occasionally made at the state conferences, their work and products are often published in technical and scientific publications as well.   It’s a well seasoned group of GIS professionals.  In addition to the geospatial programs reviewed as part of this article, the State Museum also is home to the State Committee on Geographic Names which advises the United States Board on Geographic Names on issues relating to place names in New York and the Empire State Organized Geologic Information System (ESOGIS) which provides information all of New York’s 42,000+ deep wells and thousands of shallow wells.

For more detailed information, visit the Research and Collections on the State Museum website.

The author acknowledges contributions from State Museum staff Susan Winchell-Sweeney, Heather Clark, and David Gerhard for their contributions to this article.