Background
The Institute for Children, Poverty, and Homelessness (ICPH) is a New York City-based policy research organization focused on family homelessness in New York City and throughout the United States.
Formerly known as the Institute for Children and Poverty, ICPH was founded in 1990 as federal and state governments looked for ways to address growing rates of family homelessness. Through the examination of empirical, quantifiable data, ICPH seeks to inform and enhance public policy related to homeless families, with an emphasis on the impact on children. The New York City numbers are staggering with over 12,000 families—including 25,000 children—calling a city shelter their home. A small city in itself.
And unfortunately, the experience of housing instability and homelessness in New York City’s neighborhoods goes far beyond what shelter numbers alone show. In school year (SY) 2015–16, City schools identified four times as many homeless students as there were children living in shelter, and the current structure of the City’s shelter system is ill-equipped to meet the long-term stability needs of homeless children and families living both in and outside of the City’s family shelters.
ICPH examines the demographics of this growing population, the challenges these families face in becoming self-sufficient, and the programs that are most effective in helping them transition out of homelessness in their reports, research-based books, and policy research commentary. ICPH’s publications inform government officials, policymakers, other research organizations, advocates, academics, and service providers from across the metropolitan region to promote a robust, evidence-based dialogue. Central to ICPH’s core work is the intersection of statistical analysis, data visualization, and mapping technologies resulting in a wide range of geospatial-related products and applications.
ICPH Geospatial
ICPH utilizes several mapping, desktop publishing, and statistical software packages in support of publishing online and hardcopy products. While ICPH actively promotes the use of traditional interactive maps, the increasing use of hybrid products i.e. maps/charts/tables/graphics (a.k.a. Inforgraphics) are widely used as part of delivering the organization’s message. Inforgraphics are increasingly being used across the GIS community to provide graphic visual representations of information, data or knowledge intended to present information quickly and clearly.
Managing geospatial applications and development at ICPH is Bronx-native Kristen MacFarlane. She arrived at ICPH in December 2016 after a stop at the New York Botanical Gardens. She received her undergraduate degree in Natural Resources from Cornell University and her masters in Geographic Information Science (GISc) from CUNY Lehman College in the Bronx. Kristen oversees an organizational geospatial tool box which includes a several software packages including Tableau and ESRI. While most ICPH projects are NYC focused, the reach of the organization’s research and work covers other areas of the country as well. Projects are funded by foundations, grants, and other contributions and initiated by ICPH professional staff and industry colleagues. MacFarlane notes that data used in the studies is mostly gathered from open data portals or through Freedom of Information Law (FOIL) requests. As a primer on her involvement with ICPH, see her November 17, 2017 GIS Day blog post GIS Day: Discovering Family Homelessness Through GIS.
ICPH Geospatial and Data Visualization Applications
Suspension Hubs Interactive Map
In New York City, there are 102 Suspension Hub schools serving nearly 3,500 homeless middle schoolers. These schools suspended more than 6.6% of their students overall in SY 2015–16—nearly three times the city’s rate of 2.5%—and their rate of suspension among homeless middle school students actually increased during the years since SY 2010–11. Understanding where Suspension Hubs are located represents an opportunity to offer these schools more support and resources so that they, too, can turn the tide like the 83% of other schools with declining suspension rates. The Suspension Hubs Interactive Map was developed in Tableau using data generated and analyzed with Stata. Project data is from NYC Department of Education for SY 2015-2016.
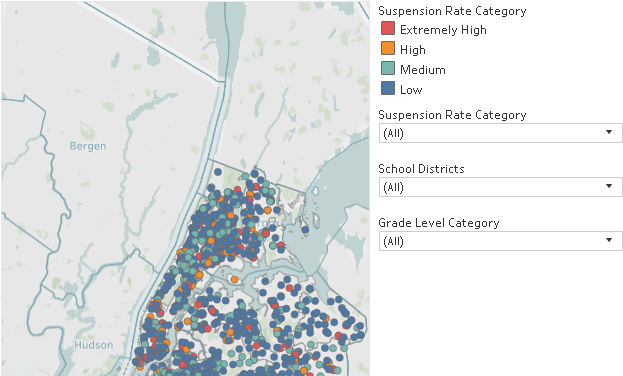
In New York City, there are 102 suspension hub middle schools where students are disciplined at extremely high rates.
Interactive Map and Atlas of Student Homelessness
Unless current trends change, one in seven New York City public school students will be homeless during elementary school. More than 140,000 children attending New York City public schools have experienced homelessness within the past six years. Visualizing the magnitude of this issue is the updated ICPH application New York City Interactive Map of Student Homelessness as well as On the Map: The Atlas of Student Homelessness in New York City 2018. Both products provide a wide range of data to allow people from different fields to tailor and engage with data on student homelessness in a way that is meaningful to them and the unique needs of their organizations and locales in the city. The Atlas documentation is from Section 1 only of the report which is available for download from this link. The August 2018 update is more similar to ones that ICPH presents as static publications. The full report contains maps generated with the ArcGIS client which are exported for inclusion in online and hardcopy publications. On a larger scale, ICPH created a similar interactive nationwide map – The United States of Homelessness – scale using data from the U.S. Department of Education.
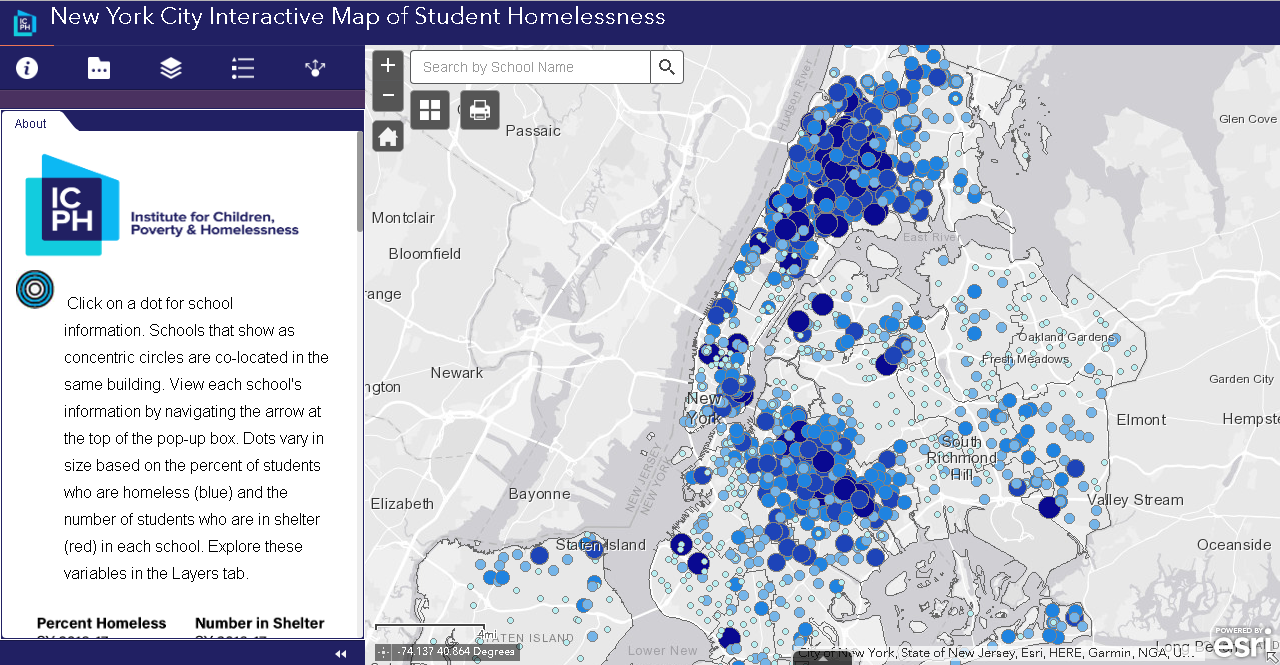
This interactive map provides users with the ability to see what student homelessness looks like in every NYC neighborhood.
Neighborhood Look at Domestic Violence as a Driver of Homelessness in NYC
Family homelessness has many different causes and drivers. One of the more common drivers in NYC are families being pushed into homelessness because of experience with domestic violence. This map demonstrates the rates at which domestic violence is driving family homelessness in neighborhoods across NYC.
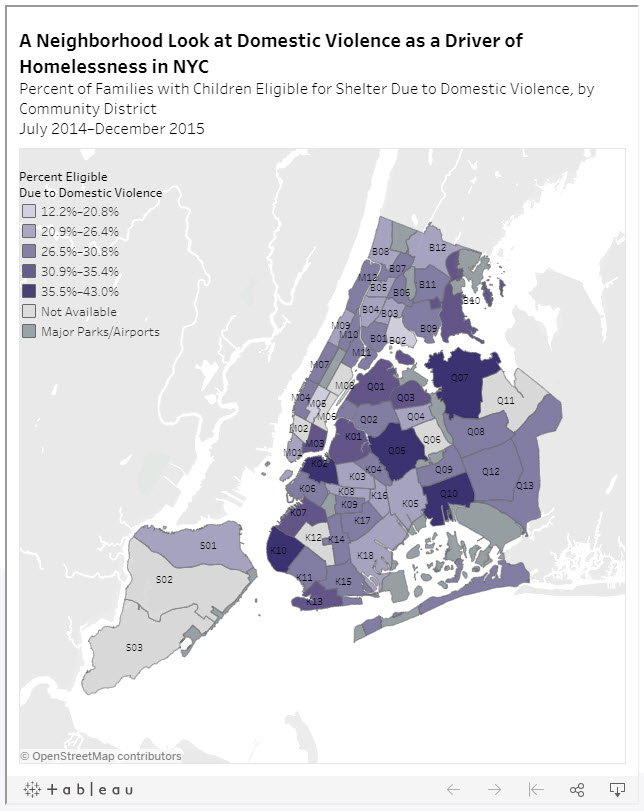
Percent of families with children eligible for shelter due to domestic violence by Community District July 2014 – December 2015. Data source: NYC Department of Homeless Services.
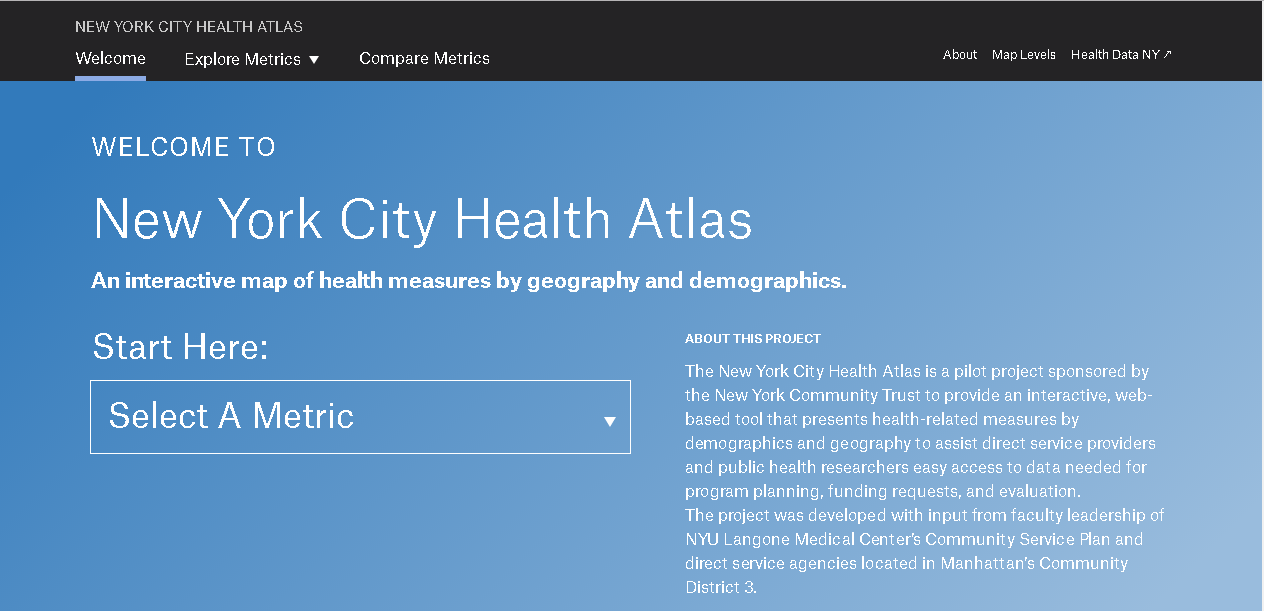
Food Insecurity & NYC’s Homeless Children
A household is considered food insecure if there is a lack of access to adequate, healthy food for all household members. In NYC, students are eligible for free or reduced-price lunches if their family income is 185% of the Federal Poverty Level or less. Other programs such as the federal Supplemental Nutrition Assistance Program (SNAP) provides food stamps or SNAP benefits to households with incomes 130% of the Federal Poverty Level or less, in addition to employment requirements. This ICPH interactive map enables users to access localized data on school lunch programs, food insecurity by community district and SNAP benefits. An excellent User Manual is provided as well.
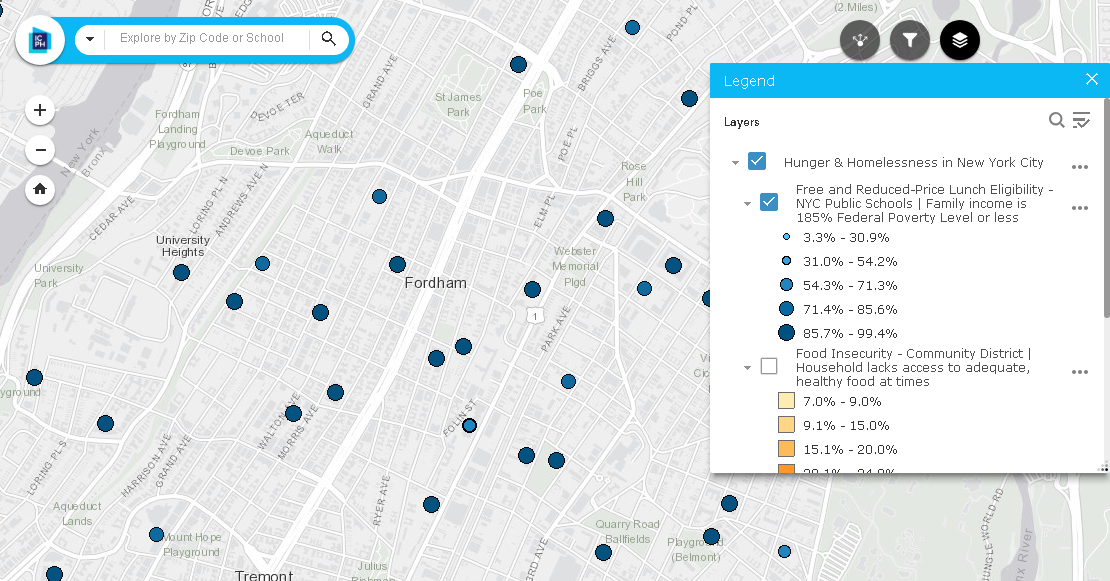
Data sources for this interactive map include NYC Dept. of Education, Food Bank for NYC, Feeding American, Data2Go.nyc, and U.S. Census Bureau, 2012-2016 American Community Survey estimates.
Summary
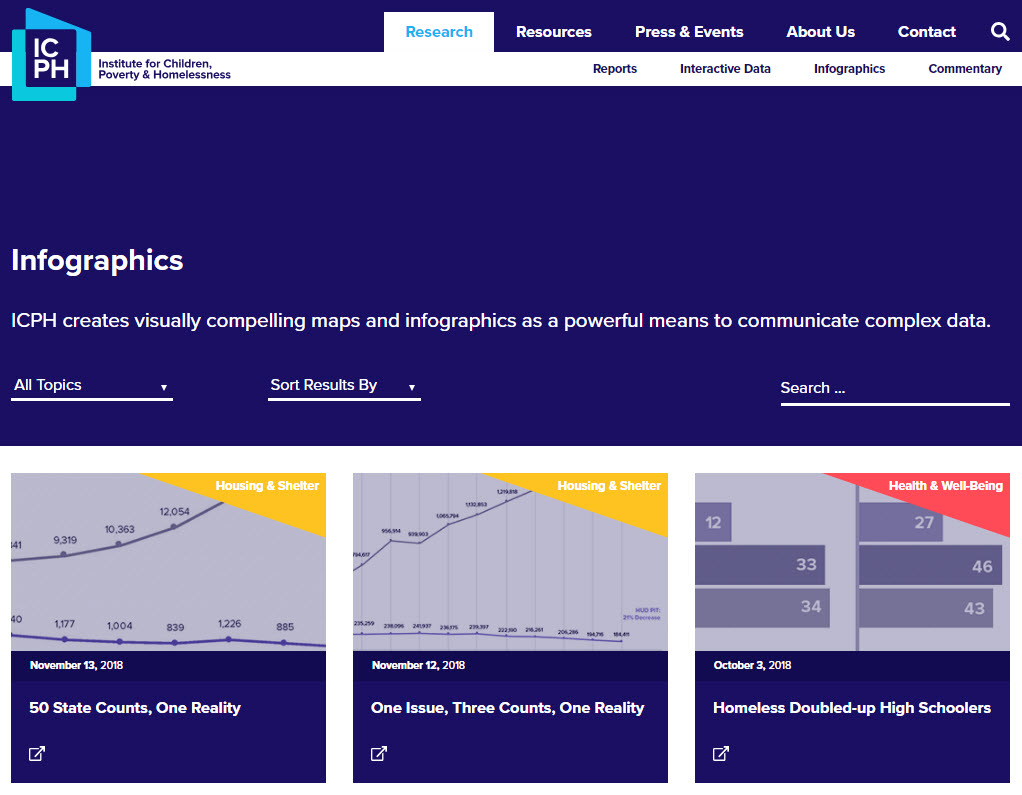
While the core focus of ICPH’s research and advocacy continues to be in the New York City region, its work covers the entire United States. Detailed homelessness related studies have been done in specific metropolitan areas. Similar the nationwide scope of the United States of Homelessness study referenced above, ICPH released the Student Homelessness and Food Deserts interactive map during Hunger and Homelessness Awareness Week, November 12-16, 2018. Other student-focused homelessness studies have been conducted in California, Georgia, Seattle, and New Jersey. A wide range of publications and reports compiled by ICPH staff and collaborating organizations focusing on homelessness-related topics such as education, health and well being, housing, and community issues can be accessed by clicking on the image below and then using the Research tab to browse Reports and Interactive Data.
“Geospatial tools are essential for our organization as we work to give the public a clearer, more informed picture of what child and family homelessness looks like in their community and across the country,” said Kristen MacFarlane, Senior GIS Analyst at ICPH. “Homelessness is a national crisis but a local issue and the specific ways that homelessness varies between localities and even neighborhoods are important to understand in order to develop policy solutions for those experiencing it. GIS software helps ICPH convey the complexities and the scope of this growing crisis.”
Contact:
Kristen MacFarlane
Senior GIS Analyst
Institute for Children, Poverty, and Homelessness
36 Cooper Square, 2nd Floor
New York, New York 10003
KMacFarlane@icphusa.org