GPS Telematics for Fleet and Mobile Workforce Management

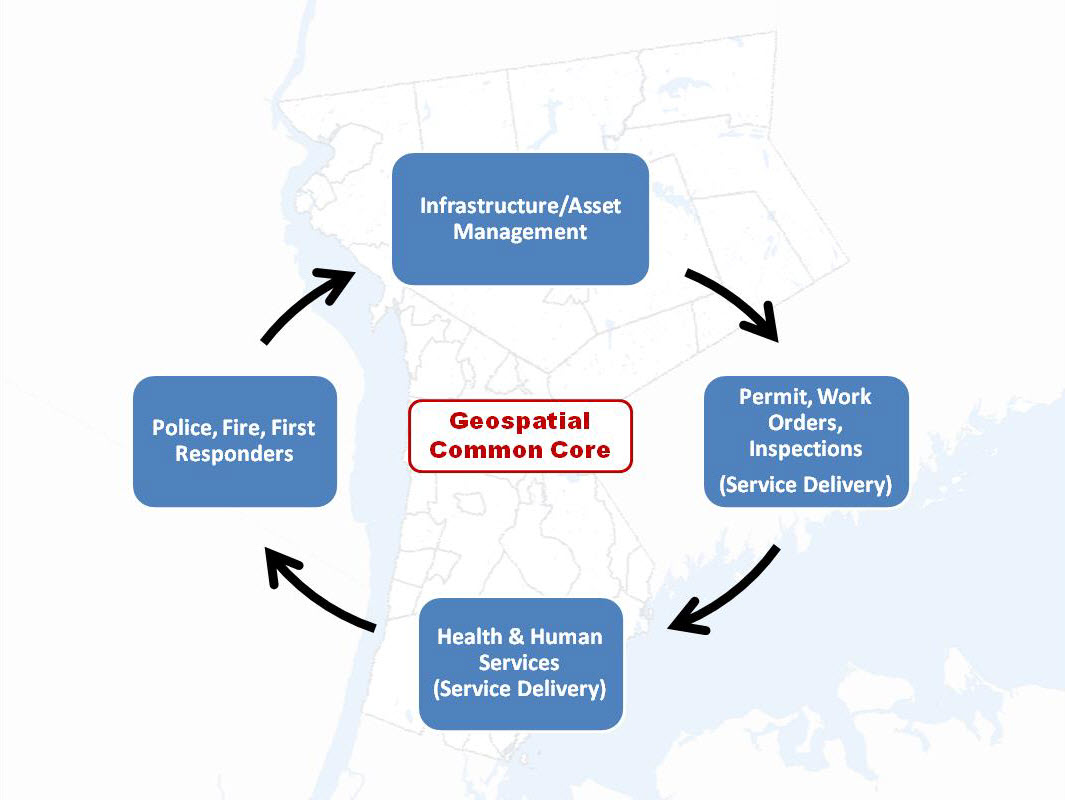
Several of my posts over past 18 months have focused on a core set of applications which I have seen evolve over the past three decades that serve as the cornerstones for many New York State local and county government geospatial programs.  Increasingly and central to many of these geospatial program areas is the “mobile” component albeit much of the attention to date has been on “field/handheld” hardware and software components for both spatial data collection and updates.

Increasingly  it is becoming recognized  another mobile collection technology can add value to  an organization’s work force and business systems productivity.  Originally referred to as Automated Vehicle Locator (AVL) systems, this technology got its start decades ago focusing on the capture (mapping) of a vehicle’s location and display in a GIS or similar digital mapping system. These early systems were expensive and not widely used outside of business and industry.

Over the last five or more years,  fleet managers have increasingly adopted “AVL” technology to assist in the management of  fleet assets especially with availability of lower cost hardware components which connect  to vehicle On Board Diagnostic (OBD) ports.  This capability supports fleet managers with a wide range of metrics  providing  odometer/mileage readings, engine idling, vehicle usage and a variety of other vehicle related information.  Now recognized as “GPS Telematics”, this technology has become more affordable and accessible to a larger range of government agencies and organizations.  This modern use of the technology centers around the use of M2M (machine to machine) and telematics technologies.

Benefits of GPS Telematics

To date, much of the work focusing on capturing and analyzing data associated with field resources has been done the “old way”, i.e., capturing and recording the data by human fingers.  Historically, this method is fraught with inconsistencies. Machine-to-machine (M2M) data capture on average is far more accurate and consistent.

Fleet telematics monitor the location, movement, status and behavior of a vehicle and associated field resources.  This is achieved through a combination of the  GPS telematics device which is installed in each vehicle transmitting  location based data via wireless networks to web servers for near real time availability.  Users access location, movement and status information and metrics of vehicles via special web-based software applications or through existing in-house “vehicle tracking enabled”  business applications.  In essence, GPS telematics systems become platforms to collection and transport valuable mobile resource field information and activities.  In addition to locational data,  fleet telematics solutions provide the status of each vehicle and by extension the corresponding crew an inference of  ongoing work accomplishments and assignments to field resources.  Managers know how each vehicle is being used as well as mileage, idling status, location and speed.  Such systems can be extended to be connected to onboard systems and sensors which log activities such as street sweeping, plowing, spreading, and spraying – workflows which are particularly challenging to capture and document by hand during the normal course of business.  While Return-on-Investments (ROI) can and will vary greatly, calculating the benefits of investing in fleet telematics technology can now be  based on factual metrics such as improved routing and dispatching, reducing labor costs, improved fuel and vehicle usage, and newer more cost-effective system architecture (Cloud). Continue reading

Orbitist: Storytelling on the Western Front

It’s always refreshing discovering new startups and firms mixing geospatial concepts with other technology and media platforms.  Not necessarily true geospatial firms which we’ve come to label as such, but clearly operating on the fringe and providing selected products and services mainstream geospatial consultants market and provide.  One such relatively new firm is Orbitist based out of Fredonia, New York.

Orbitist is led by Nick Gunner who has been filming and directing video productions since 2007 when he began pursuing his Bachelor of Science Degree in TV/Digital Film, Audio/Radio production, and Earth Science at the State University of New York at Fredonia. During that time, Nick started building content management systems and digital mapping technology which he continued while serving four years as the university’s New Media Manager.   On the side, he continued to pursue freelance work as a public radio producer, freelance documentary filmmaker, and web developer. In the Summer of 2015, Nick launched Orbitist LLC as part of the Fredonia Technology Incubator with the idea of using digital storytelling and technology to make important information as accessible as possible.

Initial Work

The Roger Tory Peterson Institute (RTPI) of Natural History was Orbitist’s first client.   In the Summer of 2015 they commissioned a short documentary on the Chadakoin River in Jamestown, as well as map three tours about various natural history topics.  Representative examples of RTPI products can be viewed on YouTube and the bottom three links on this Orbitist web page.  During this same time period – and ongoing today – Orbitist also performed work for the Chautauqua County Visitors Bureau.

Other recent products and services include:

A Story Map documenting the Winter 1929 Tewksbury boat and bridge crash on the Buffalo River resulting in the flooding of a 18 neighborhood blocks in South Buffalo.

This Story Map uses a variety of multimedia which pinpoints cultural and historical features from different Spanish-speaking countries, including architectural feats, traditional dances, and tipping customs, among others. Each map utilizes Spanish phrases with English translations to bridge the gap between languages.

Software Suite

Relying on the experience he gained building systems for the last 10 years, software products used at Orbitist reflects Nick’s commitment to combining content management with interactive mapping – much of which is accomplished by integrating and combining leading Open Source components.   Currently the Orbitist mapping platform is a simple content management system which associates posts (internally called “points”) with latitude/longitude values.  The Orbitist team often uses Mapbox GL as a primary front-end mapping library but behind that everything in their system is API-driven, meaning story maps are created top of products such as Leaflet and Google Maps.  They also use Carto as a stand-alone product for building real-time analytics maps.  All combined, the Orbitist “system” also manages images and a variety of data (icon type, time of day, external links, etc.) and provides access to YouTube, Vimeo, and even Facebook for video hosting. GitHub is leveraged to host static web projects. Continue reading

GIS Common Core Part 3: Health and Human Services (HHS)

Through a sequence of articles posted in eSpatiallyNewYork, I have proposed a series of GIS applications which provide a framework for establishing and maintaining  GIS/geospatial programs in local  governments (villages, towns, cities, and counties) across  New York State.  These applications areas are referred to as the Geospatial Common Core, many of which are integrated with local government office and administrative business systems.  Others are utilized in the support of regulatory reporting programs.    Together, the Geospatial Common Core contribute towards building sustainable geospatial capacity for local governments.   This is the third installment of the series.

“GIS Common Core” application areas in New York State local governments

The first article entitled Part 1:  Infrastructure and Asset Management focused on the growing and critical role local government GIS geospatial programs continue to serve in rehabilitating and maintaining the decaying and outdated New York State – and national – public infrastructure.  The second article Part 2:  Work Orders, Permitting, and Inspections (WOPI) published in March 2016 focused on geocentric software packages which are ubiquitous in government programs supporting work flows in areas such public works, health, planning, clerk, assessment, buildings/code enforcement and inspections.  Organizations investing and integrating WOPI systems with GIS will continue to help build long-term sustainable geospatial programs in local governments.

Part 3:  Health and Human Services (HHS)

Health and human services can often be broadly defined from one location to another but for the purposes of this article it includes a wide-range of government programs including, but limited to, public health services, social services, public assistance, youth and veterans programs, disability programs, housing and homeless services, child protection services, as well as the important network of contracted service providers governments rely upon in providing counseling and related support services.  I have long been an advocate of building geospatial capacity in these local government program areas.

Why?

Statewide local government HHS budgets typically dwarf other local government operational program areas with regard to annual appropriations.  While I am not a budget analyst and admittedly it’s sometimes difficult to follow the money trail of appropriations vs. revenues vs. actual tax payer costs in county budgets, here are a few examples to illustrate the size and magnitude of HHS programs in a selected 2017 NYS county budgets (Data/information from County webpages as noted):

  1. Stuben County 2017 Budget. (Page 3).  Pie chart indicates nearly 47% of the appropriated budget dedicated to Health and  Economic Assistance/Opportunity (includes Social Service disciplines) program areas
  2. Ulster County 2017 Budget. (Pages 1 & 2). Table and pie chart indicate nearly 42% of the appropriated budget dedicated to Public Health and Economic Assistance/Opportunity program areas
  3. Erie County 2017 Budget. (Pages 93, 159, and 174). Appropriations (rounded in millions) in Health ($86M), Mental Health ($47M) and Social Services ($591M) account for almost 50% of the $1,455,000,000 recommended general fund budget.  (Note:  There are other references to the 2017 budget being closer to $1.7B). Either way, HHS budgets are a significant portion of the overall county budget
  4. Albany County 2017 Budget. (Page 34). Employee Count table lists 657 of 2,535 County employees (26%) are in the Child, Youth, and Family Services (170), Social Services (308), Mental Health (90), and Dept. of Health (89)
  5. Suffolk County 2017 Budget. (Pages 101 and 366).   Appropriations (rounded in millions) in Health Services ($249M) and Social Services ($628M) account for nearly 30% of a recommended $2.9B budget
  6. Monroe County 2017 Budget. (Pages 157 and 275).  Appropriations (rounded in millions) in Human Services ($536M) and Public Health ($62M) account for nearly 50% of an adopted $1.2B budget
  7. Continue reading

2017 GeoCon Wish List: Part 1

I first wanted to publish this article initially as a wish list to the GIS Santa Claus in early December, but the holidays came and went so I am now submitting it as a New Year’s wish list (Part 1) for the 2017 GeoCon  in Lake Placid.  There will  be other suggestions over the next several months and I’ll remain cognizant  what I wish for as I may be submitting an abstract to present myself.  Maybe.

So to start the discussion, here is an initial list of  ten geospatial mapping applications and program areas I’d like to send a speaker invite to for the 2017 GeoCon – and why.

NYS Office of the Attorney General:  New York Crime Gun Analysis https://targettrafficking.ag.ny.gov/tool/

While mapping continues to be one of the primary end products of GIS analysis, geospatial data is increasingly being used in a wide range of data visualization platforms such as Tableau.    I’d welcome the opportunity to attend a presentation by the Office of the Attorney on the Crime Gun Analysis report outlining data collection, data analysis, and the rendering of the data through maps, tables, and charts.  Not the normal GIS menu.

New York State Regional Economic Development Councils (REDC) http://regionalcouncils.ny.gov/

In context of geospatial, this program reference isn’t so much about “what it is”, as opposed to more about “what it isn’t”.  Or at least I think.  From my level, the REDC framework has always been somewhat of a mystery since current state administration created the 10 Regional Councils in 2011.  And even more confusing that the geography of the REDCs do not coincide with the statewide Regional Planning Commission boundaries. That said, there is an incredible amount of geospatial information and analysis in the Council’s underlying mission.  Everything happens somewhere.  And there is a ton of money coming through the Consolidated Funding Application (CFA) process which I believe the GIS community should be more engaged and recipients of to some degree. Uber opportunities for web mapping applications, Story Maps, and GIS-produced maps for publications though one would be hard pressed to see any real evidence of a professional GIS touch in any of the Council products and services.   I looked through four regional 2016 “progress” reports (Hudson Valley, Finger Lakes, Capital Region and Southern Tier and found very limited reference to GIS/geospatial technologies.   Some kind of presentation by one of the REDCs and/or regional GIS personnel involved in this program would be most informative for the statewide GIS community.  Otherwise I doubt we’re going to hear anything through the state GIS program office on this.

511NY
https://www.511ny.org/

This is more of a selfish request than anything because I really don’t fully understand the makings and how 511NY operates in context of GIS/geospatial data collection, sources, work flows, or even development of their applications including the online mapping stuff.  I do know it’s big, visible, seemingly growing in functionality, supported by a mess of New York State transportation agencies -even though it has its own .org web address.  It also creates a lot of data which would be useful to consume and use in local government web mapping applications.   I’d be the first one to sign up to hear how it all comes together, funding, sources of the data (including what is being taken from and/or generated at the local level), opportunities for collaboration with local GIS programs, and what’s next.  How long before we see an Uber icon on the 511NY homepage to help support trip planning?

Continue reading