10 Questions: Peter Carlo

From my level, it’s a rare occurrence any more running into someone in the geospatial field when I can make reference to Arc/INFO and AML (ARC Macro Language) without him or her giving me a big blank stare. A testament to how long we have both been around.    One of those individuals is Peter Carlo, who works for the New York City Department of Parks and Recreation in the forestry division having worked in the geospatial field for over thirty years.  Yes, learning the ropes at the dawn of GIS with command line Arc/INFO and one of the most senior GIS professionals in the vast New York City government GIS user community.  I was fortunate to catch up with him recently to discuss some of the highlights of his long career in the Big Apple.

eSpatiallyNewYork: Maybe a little of your background and where you are originally from?

Carlo:  I was born in the northern Bronx.  In my early years, the family moved to southern Vermont.  After graduating high school I briefly attended Castleton College in Rutland, VT, though eventually returned to New York City to attend Lehman College in the early 1990’s and enrolled in the geography department.  Since then I’ve lived in a couple places in the metro-NYC area but now live with my family on Long Island.

eSpatiallyNewYork:  What is your current responsibility(s) with NYC Parks Department?

Carlo: I am currently the GIS Supervisor at NYC Parks I.T. division.  Our team is made up of  six GIS specialist and our primary goal is to administer the Parks GIS central geodatabase and to support geospatial projects throughout the Agency.  These projects range from configuring Survey123 mobile data efforts to writing data ETL’s (extract/transfer/load) to our central data warehouse.

eSpatiallyNewYork: So geography at Lehman College in the early 1990s.  Where did it go from there?

Carlo: Yes, I really found the passion for GIS technology at Lehman College.  In 1991 or so I had the opportunity to build an ESRI “enterprise” GIS at the GIS lab at Lehman.  Everything from backend data to an ARC/INFO front end access.  I found a passion in setting up hardware and software solutions while configuring components like digitizing tables and then spending hours digitizing contour maps of the Bronx geology.

Soon after graduation from Lehman, I was hired by the NYC Parks Department Forestry Division and started working on the (first) 1995 street tree survey dataset, which was done by associating a tree location with an street address.  At that time, the Parks Departments Forestry offices where located in each of the five boroughs and were managing their own tree data in a disk operating system (DOS) program called Tree Manager.  I also worked with the Parks I.T. Division to setup the our first central geodatabase using SQL Server and ArcSDE.  Working with Lehman College interns we were able to map out all park athletic facilities, playgrounds and comfort stations.  This data still serves as the foundation for the Parks geodatabase.  (Editor Note:  An entirely different read on its own is the effort behind the New York City Street Survey program.  The most recent 2015 tree survey, which is coordinated by NYC Parks,  inventoried nearly 700,000 trees in the five boroughs.  Read here for more details.) 

eSpatiallyNewYork: In this capacity what are some of your current projects?

Carlo: We are currently working with our Forestry division to deploy an interagency Survey123 application that will be used during storm events.  It will be the second version of this solution.  The application will stream 311 hazardous tree request (like tree downs and limb downs) to potentially over 300 field inspectors made up of Parks, FDNY and DSNY staff to name a few. A large part of our work is making our GIS data interoperable with legacy software/data solutions.  We also participate in integrating spatial data and functions into new business and software solutions.

eSpatiallyNewYork:  Do you have a “favorite” GIS project you’ve worked on while in the NYC Parks department?

Carlo:  I would say working (about 10 years ago) on Forestry’s first mobile storm response application.  It was called Storm Mobile.  It worked on the thick IBM Toughbook tablets utilizing wireless and GPS technology, 311 integration and data from the 2005 Tree Census. That was all new stuff for us and everything worked just fine.  I made some lifelong friends during that experience and learned so much.  A majority of our mobile application use smart phones and tablets with AGPS.  However, there are some teams that use Trimble units when needed.

eSpatiallyNewYork: NYC Parks Department is an ESRI shop – what about other software programs, hardware components in your office?

Carlo:  We are using Infor EAM (Enterprise Asset Management) for a work order management software.  This is highly integrated with our central GIS database.  We also have a new group of data scientists who are utilizing open source GIS tools at a high level. Currently the Agency has over 200 ArcGIS Desktop Pro installation, Multiple SQL/SDE central data repositories and an internal data warehouse that serves as a point of access.  A lot of our ArcGIS Desktop/Pro users utilize extensions such as Spatial Analysis, Workflow Manager and Geostatistical Analyst.  We are also using Cyclomedia Street Smart and Pictometry oblique photos.

Parks is currently on a path to migrate over to a more web GIS approach to spatial data access.  We’ve been moving over to Enterprise ArcGIS 10.8 by utilizing ArcGIS Server and ArcGIS portal to build web apps, Survey123 and Collector solutions.  Around the ArcGIS Online (AGOL) framework.  This has allowed us to streamline workflows and make GIS data more accessible to non-GIS specialists.  Overall, spatial data has increasingly become more integrated throughout the Department data footprint – it is just going to continue to grow.

eSpatiallyNewYork: What other NYC departments do you work the most closely with in GIS/geospatial efforts?

Carlo: The Parks Department works closely with many of the other City Agency GIS units.  We often share data with NYPD, FDNY, OEM and DoITT.  I think interagency data and resource sharing is the next big thing for all NYC Government GIS units.  I finally imagine a central GIS data portal coming together, where all city agencies can upload standardized data that could serve as a central data store for Agencies System of records. It’s kind of the next step from the Open Data portal.  Beyond the geospatial perspective the Parks Department maintains an impressive list of partners in doing work with throughout the city system..

eSpatiallyNewYork: What’s the next big “geospatial thing” in NYC Parks?

Carlo:  I would say that it is data interoperability, web GIS and the move to cloud solutions.  For my team it’s going to be about quickly standing up “no code” data collection and analytical tools that will empower end users (subject matter experts) without them having to be GIS experts.

eSpatiallyNewYork:  Are you involved on any level contributing to the NYC Open Data portal?

Carlo: My specific unit isn’t directly involved in publishing to the portal but NYC Parks as a whole contributes significantly.  Right now I believe there are close to 100 NYC Parks datasets available.

eSpatiallyNewYork: Yankees or Mets?

Carlo:  BIG TIME YANKEE FAN!  I remember watching the Yankees during the Bronx Zoo era!

Contact:

Peter Carlo
GIS Supervisor
NYC Parks I.T. division
peter.carlo@parks.nyc.gov
https://www.nycgovparks.org/services/forestry

The Geography of Homelessness

Background

The Institute for Children, Poverty, and Homelessness (ICPH) is a New York City-based policy research organization focused on family homelessness in New York City and throughout the United States.

Formerly known as the Institute for Children and Poverty, ICPH was founded in 1990 as federal and state governments looked for ways to address growing rates of family homelessness. Through the examination of empirical, quantifiable data, ICPH seeks to inform and enhance public policy related to homeless families, with an emphasis on the impact on children.  The New York City numbers are staggering with over 12,000 families—including 25,000 children—calling a city shelter their home.  A small city in itself.

And unfortunately, the experience of housing instability and homelessness in New York City’s neighborhoods goes far beyond what shelter numbers alone show. In school year (SY) 2015–16, City schools identified four times as many homeless students as there were children living in shelter, and the current structure of the City’s shelter system is ill-equipped to meet the long-term stability needs of homeless children and families living both in and outside of the City’s family shelters.

ICPH examines the demographics of this growing population, the challenges these families face in becoming self-sufficient, and the programs that are most effective in helping them transition out of homelessness in their reports, research-based books, and policy research commentary.   ICPH’s publications inform government officials, policymakers, other research organizations, advocates, academics, and service providers from across the metropolitan region to promote a robust, evidence-based dialogue.  Central to ICPH’s core work is the intersection of statistical analysis, data visualization, and mapping technologies resulting in a wide range of geospatial-related products and applications.

ICPH Geospatial

ICPH utilizes several mapping, desktop publishing, and statistical software packages in support of publishing online and hardcopy products.  While ICPH actively promotes the use of traditional interactive maps, the increasing use of hybrid products i.e.  maps/charts/tables/graphics (a.k.a. Inforgraphics) are widely used as part of delivering the organization’s message.   Inforgraphics are increasingly being used across the GIS community to provide graphic visual representations of information, data or knowledge intended to present information quickly and clearly.

Managing geospatial applications and development at ICPH is Bronx-native Kristen MacFarlane.  She arrived at ICPH in December 2016 after a stop at the New York Botanical Gardens.   She received her undergraduate degree in Natural Resources from Cornell University and her masters in Geographic Information Science (GISc) from CUNY Lehman College in the Bronx.  Kristen oversees an organizational geospatial tool box which includes a several software packages including Tableau and ESRI.  While most ICPH projects are NYC focused, the reach of the organization’s research and work covers other areas of the country as well.  Projects are funded by foundations, grants, and other contributions and initiated by ICPH professional staff and industry colleagues.  MacFarlane notes that data used in the studies is mostly gathered from open data portals or through Freedom of Information Law (FOIL) requests.  As a primer on her involvement with ICPH, see her November 17, 2017 GIS Day blog post GIS Day: Discovering Family Homelessness Through GIS.

ICPH Geospatial and Data Visualization Applications

Suspension Hubs Interactive Map

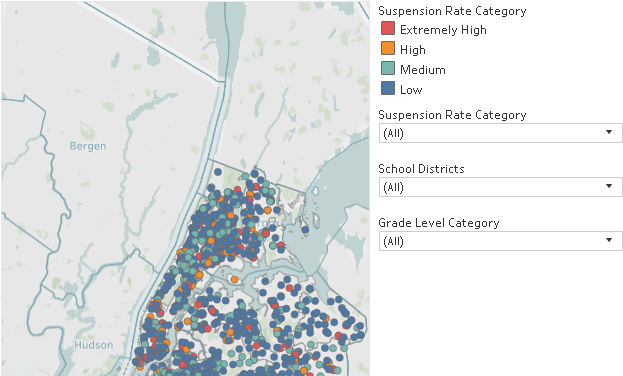
In New York City, there are 102 Suspension Hub schools serving nearly 3,500 homeless middle schoolers. These schools suspended more than 6.6% of their students overall in SY 2015–16—nearly three times the city’s rate of 2.5%—and their rate of suspension among homeless middle school students actually increased during the years since SY 2010–11. Understanding where Suspension Hubs are located represents an opportunity to offer these schools more support and resources so that they, too, can turn the tide like the 83% of other schools with declining suspension rates. The Suspension Hubs Interactive Map was developed in Tableau using data generated and analyzed with Stata.  Project data is from NYC Department of Education for SY 2015-2016.

In New York City, there are 102 suspension hub middle schools where students are disciplined at extremely high rates.

Interactive Map and Atlas of Student Homelessness

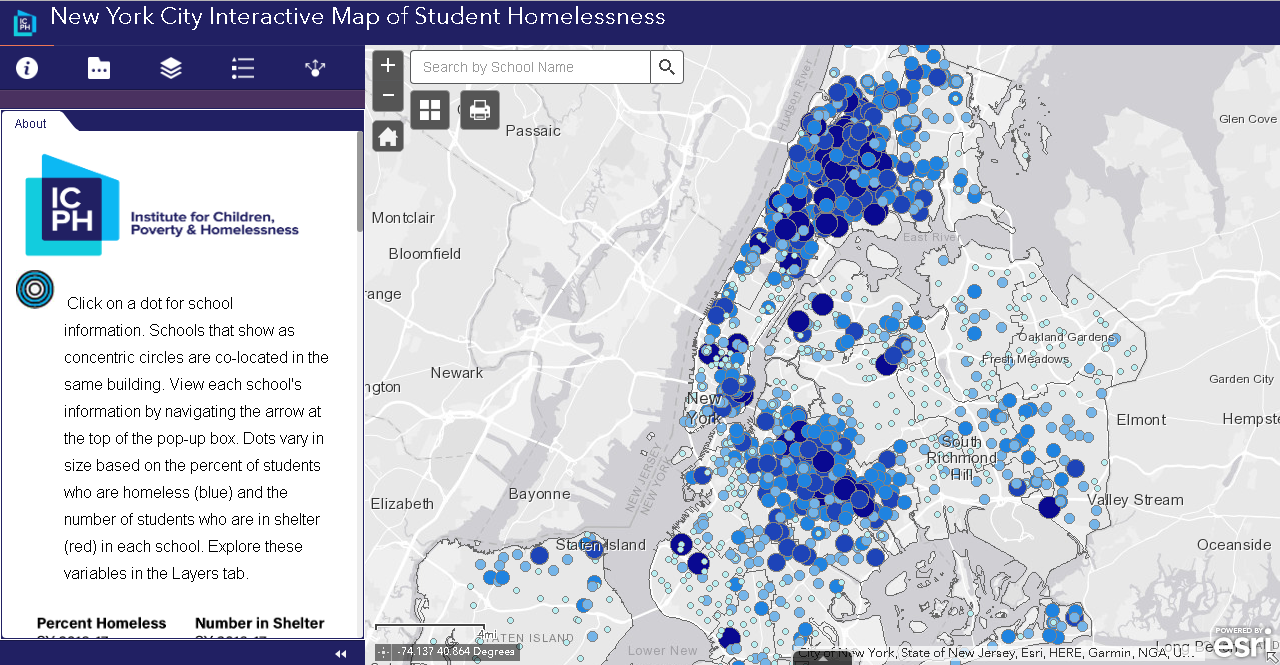
Unless current trends change, one in seven New York City public school students will be homeless during elementary school. More than 140,000 children attending New York City public schools have experienced homelessness within the past six years.  Visualizing the magnitude of this issue is the updated ICPH application New York City Interactive Map of Student Homelessness as well as On the Map:  The Atlas of Student Homelessness in New York City 2018.  Both products provide a wide range of  data to allow people from different fields to tailor and engage with data on student homelessness in a way that is meaningful to them and the unique needs of their organizations and locales in the city. The Atlas documentation is from Section 1 only of the report which is available for download from this link.  The August 2018 update is more similar to ones that ICPH presents as static publications.  The full report contains maps generated with the ArcGIS client which are exported for inclusion in online and hardcopy publications.  On a larger scale, ICPH created a similar interactive nationwide map – The United States of Homelessness – scale using data from the U.S. Department of Education.

This interactive map provides users with the ability to see what student homelessness looks like in every NYC neighborhood.

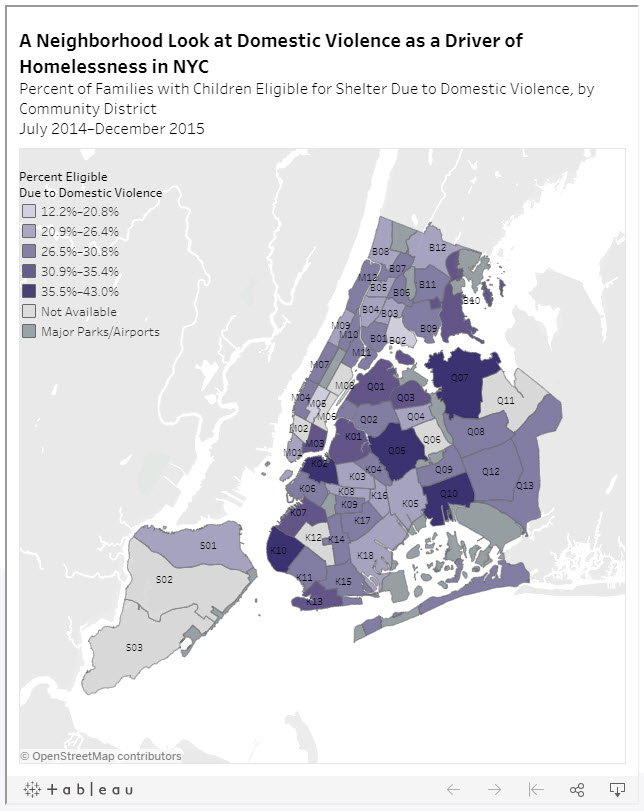
Neighborhood Look at Domestic Violence as a Driver of Homelessness in NYC

Family homelessness has many different causes and drivers. One of the more common drivers in NYC are families being pushed into homelessness because of experience with domestic violence. This map demonstrates the rates at which domestic violence is driving family homelessness in neighborhoods across NYC.

Percent of families with children eligible for shelter due to domestic violence by Community District July 2014 – December 2015. Data source: NYC Department of Homeless Services.

Food Insecurity & NYC’s Homeless Children

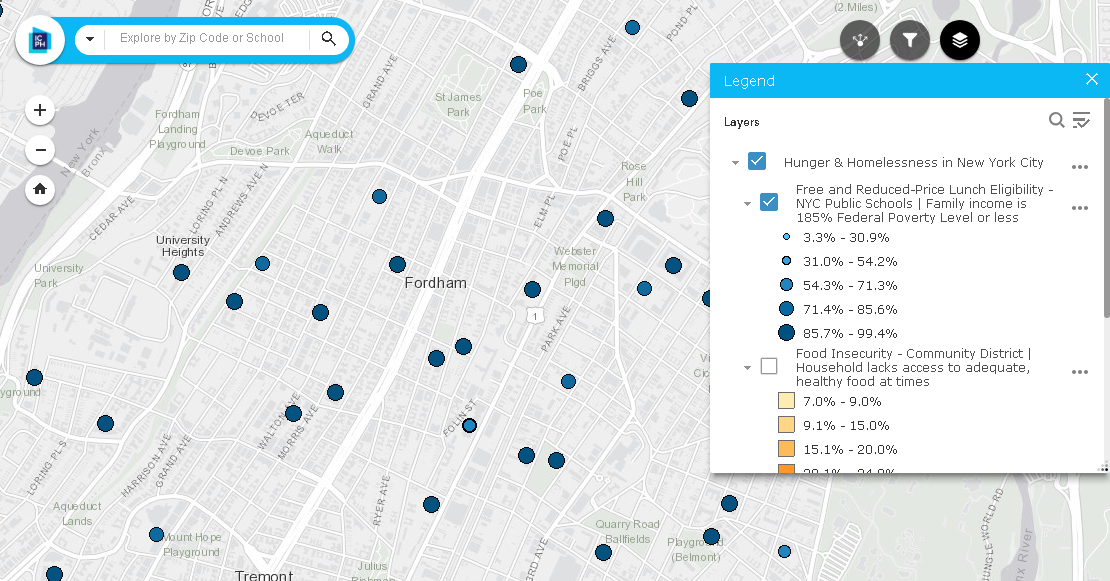
A household is considered food insecure if there is a lack of access to adequate, healthy food for all household members.    In NYC, students are eligible for free or reduced-price lunches  if their family income is 185% of the Federal Poverty Level or less. Other programs such as the federal Supplemental Nutrition Assistance Program (SNAP) provides food stamps or SNAP benefits to households with incomes 130% of the Federal Poverty Level or less, in addition to employment requirements.  This ICPH interactive map enables users to access localized data on school lunch programs, food insecurity by community district and SNAP benefits.  An excellent User Manual is provided as well.

Data sources for this interactive map include NYC Dept. of Education, Food Bank for NYC, Feeding American, Data2Go.nyc, and U.S. Census Bureau, 2012-2016 American Community Survey estimates.

Summary

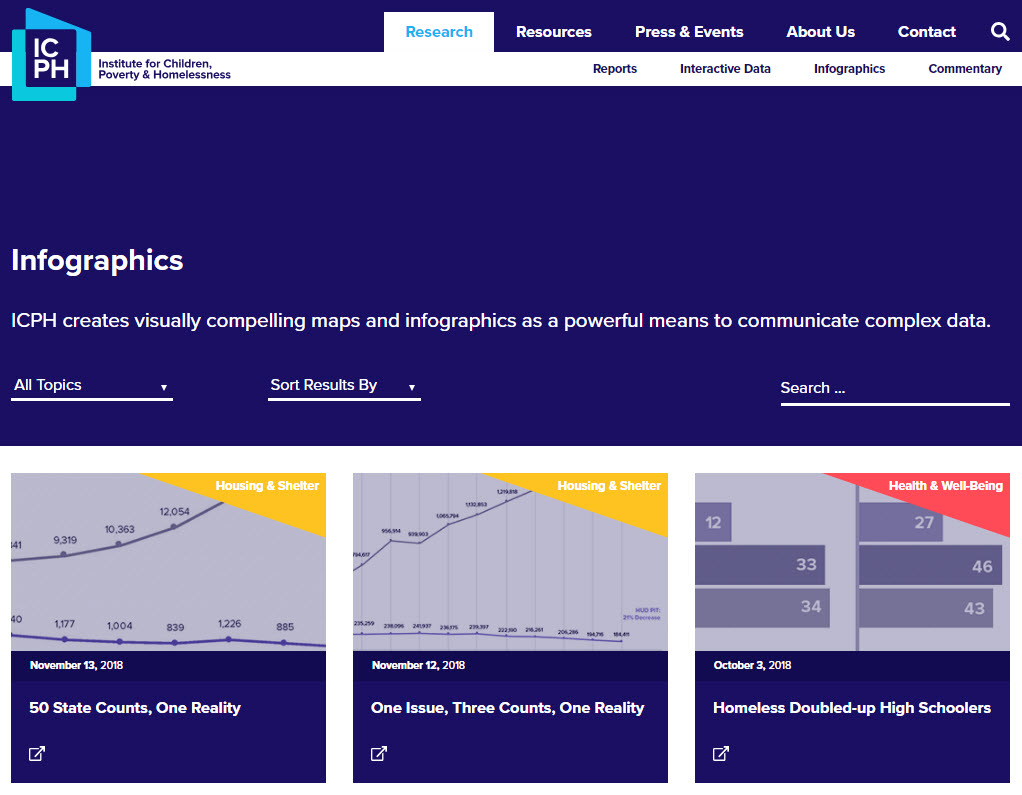
While the core focus of ICPH’s research and advocacy continues to be in the New York City region, its work covers the entire United States.  Detailed homelessness related studies have been done in specific metropolitan areas.  Similar the nationwide scope of the United States of Homelessness study referenced above, ICPH released the Student Homelessness and Food Deserts interactive map during Hunger and Homelessness Awareness Week, November 12-16, 2018. Other student-focused homelessness studies have been conducted in California, Georgia, Seattle, and New Jersey.  A wide range of publications and reports compiled by ICPH staff and collaborating organizations focusing on homelessness-related topics such as education, health and well being, housing, and community issues can be accessed  by clicking on the image below and then using the Research tab to browse Reports and Interactive Data.

“Geospatial tools are essential for our organization as we work to give the public a clearer, more informed picture of what child and family homelessness looks like in their community and across the country,” said Kristen MacFarlane, Senior GIS Analyst at ICPH. “Homelessness is a national crisis but a local issue and the specific ways that homelessness varies between localities and even neighborhoods are important to understand in order to develop policy solutions for those experiencing it. GIS software helps ICPH convey the complexities and the scope of this growing crisis.”

Contact:

Kristen MacFarlane
Senior GIS Analyst
Institute for Children, Poverty, and Homelessness
36 Cooper Square, 2nd Floor
New York, New York  10003
KMacFarlane@icphusa.org

URBAN-X: Supporting New York Geospatial Startups

Curious to know about technology accelerators in New York State which are supporting  geospatial startups?  Look no further than Brooklyn-based URBAN-X built by MINI and Urban Us and operating since 2016 offering customer development, product development, and fundraising support to get selected startups off the ground into production and operation.   Geospatial is not the only type of startup  URBAN–X supports  (its actually much more)  with an existing resume of 37 firms in its portfolio covering technology solutions in the areas of real estate, transportation, energy, infrastructure, public health, and government among others.  The URBAN-X startup focuses on the urban tech environment developing hardware and software solutions which address key needs of city systems, as well as businesses and individuals.   The accelerator’s current cohort consists of seven  startups which each received $100,000 and five months of immersive mentorship.  This cohort was selected from over 500  applications this past November.

Every six months Urban-X selects up to 10 startups and invest $100,000 per company. The 20-week accelerator program also includes six on-site “experts-in-residence”.

Illustrative of the geospatial startups which have come through the accelerator is Citiesense.

Citiesense creates data-driven maps and dashboards that layers information about new permits, recent sales and property changes in urban areas, guiding real estate investors and other local stakeholders to support more informed business decisions.  Using interactive mapping and data visualization techniques, the company continues to focus on helping business districts better understand market demand and dynamics.   Citiesense uses Carto software to support their mapping applications and leverages data available in the NYC Open Data Portal.  Examples of their mapping apps are at the Downtown Brooklyn website and the Long Island City Partnership.  Citiesense is also referenced in a 816 New York article “3 map-based tech tools perfect for neighborhoods and housing authorities”.

I quickly developed an account on the Citiesense website and immediately started mapping various features around 347 East 105th Street. Out-of-the-box the application provides access to dozens of variables and features. This image shows recent 311 Reports, the NYC Street Tree Inventory, and the Commercial Overlay Districts layer.

Starting a tech company is never easy” notes Citiesense CEO Starling Childs. “I think this is particularly true of ‘Urban Tech’ startups. Joining URBAN-X was like adding the perfect final cofounder to our team right when we needed to begin testing our idea in the market. The people behind URBAN-X know the challenges urban tech companies face when thinking about solutions that consider some level of government and private sector collaboration. They understand the value of things like open data; how it supports public private sector collaboration and accelerates innovation in cities.”

Other URBAN-X supported startups in the location and navigation space include Revmax, Rentlogic, WearWorks and Swiftera.

Revmax:  Revmax develops fleet management and routing software for ride-hail vehicles. Its technology maximizes vehicle utilization by proactively forecasting rider demand based on historical data and future events. Revmax ensures that vehicles are in the optimal location to find rides quickly — increasing fleet revenue while reducing pollution and congestion.  According to  CEO Jonathan Weekley and chief operating officer Briggs Fraser,  cabs and Uber cars are empty some 50 percent of the time — highly inefficient for drivers trying to make the most of their time on the road. But the real target market for Revmax, Weekley says, is auto manufacturers such as GM and Ford, who are looking to get into ride-hailing. “They see declining car ownership, and they need to figure out a way to keep building cars and use that fleet more efficiently,” he said. Those manufacturers will have extra incentive to optimize routes, since they, not the drivers, will own the cars that are out on the road.

Rentlogic:  Rentlogic is a standards organization that measures and letter-grade rates the quality of multi-family residential buildings. Rentlogic ratings recognize building owners that invest time and energy in to operating great buildings, and helps connect them with residents trying to navigate a difficult marketplace.  Data underneath the application is harvested from the city’s 311 system.    Every week, roughly 4,000 complaints are initiated by renters about their landlords via calls to the #311 system. These complaints can include mold, heat and hot water issues, infestations, structural problems and more – all of which are used in the application.  It is Rentlogic’s aim to bring transparency and standardization to the residential real estate market.

WearWorks:  WearWorks is a New York-based haptics design company using sensory feedback systems to communicate information entirely via touch. Using vibration-based language, their product augments the senses of blind and visually impaired users through a non-visual interface, helping them to easily and effectively navigate to any destination.  Btw – WearWorks technology was worn/used by Simon Wheatcroft, a blind runner, in the 2017 New York City Marathon.

Swiftera: Swiftera’s business plan is to support citizens, businesses and municipalities in mobility, leisure and urban planning decisions. By providing access to fresh and actionable geospatial data at a competitive cost, the company leverages its novel urban-imagery technology to help customers analyze the past, explore the present and be the first to see the future.  While still in development, Swiftera anticipates delivering unprecedented urban imagery: available all-the-time, in real time.  For more information visit their website or contact them at info@swiftera.co. 

Summary:

URBAN-X provides an excellent opportunity for startups – including those in the geospatial space – to get started in a way which would otherwise be financially and logistically very difficult.    URBAN-X is itemized in a 2017 Dreamit article as one of the leading voices in the New York City “nascent urban tech movement”.  In the broader statewide context, the Empire State Development corporation supports several regional certified business incubators.  The New York State geospatial community is fortunate to have both the access and ability to work with companies such as URBAN-X.

Contact:

Micah Kotch
Managing Director
URBAN-X
Micah.Kotch@urban-x.com
Mobile: +1.646.645.0459
www.urban-x.com