Game Time: Mapping Moose in New York State

Introduction

A rare treat in eastern upstate New York, mostly in the Adirondacks, although sometimes in the Taconic Highlands along the Massachusetts and Vermont borders and within the Catskills, is to see moose in the wild.  Moose (Alces alces) are the largest member of the deer family (Cervidae) and the largest land mammal in New York State. Having been absent from the Empire State since the 1860s, the species began to reenter the state on a continuous basis in the 1980s.   While re-establishment of the moose population in New York has been viewed and supported as a positive sign of a healthier, more complete natural ecosystem,  it does not come without a range of potential problems associated with their return and the need for proactive management and monitoring by New York State Department of Environmental Conservation (DEC) wildlife biologists and researchers.

So in 2020 it should come as no surprise that wildlife biologists in New York State – and around the world – are using geospatial technologies to support their work.  In addition to estimating moose population size, New York’s wildlife biologists and scientists also focus on improving moose survival and reproductive rates and to assess their diet and health.  Assisting the DEC’s work towards researching moose habitat and resource requirements is David W. Kramer, Research Scientist, in the Division of Fish and Wildlife.  The toolkit which augments his moose research includes a mixture of GPS, remote sensing imagery, a variety of GIS data layers, and  both ESRI and “R” software.  R being a free, open source software package for statistical computing and graphics commonly used in the research community.

Population Counts and Observations

To date, Mr. Kramer and colleagues have been observing the locations of 26 moose which were collared with either a  Lotek or Telonics GPS unit which can store data “on board” the collar that can then be retrieved by getting the collar back or by getting close enough to the moose to download the data to a receiver. “Uplink” collars can store data on the collar as a backup, but also send daily data uploads via satellite and are then stored online.  Moose are captured (to put the collar on) by a crew which “net-gun” the animal from a helicopter. For their research, DEC staff focuses on female moose (cows) for two reasons:  (1) wanting to track of how many offspring each cow has; the collars facilitate the “following” of the females in the summer to count calves, and (2) male moose (bulls) go through physiological and body changes during the same period that do not make the collaring of males practical or even unsafe.  Data associated with the collars are important in analyzing survival and calving success as well as the geography associated with habitat selection.

Continue reading

On the Water: Protecting New York Waterbodies from Invasive Species

Background

Since 2007, the New York Natural Heritage Program (NYNHP), through a contract with the NYS Department of Environmental Conservation, has been managing the statewide administration of the iMapInvasives program. The program is a GIS-based, online, all-taxa invasive species database and mapping tool which is used across the state for the collection, distribution, and analysis of invasive species observation, survey, assessment, and treatment data.  Use of the program by individuals and partnering organizations helps coordinate the early detection of invasive species and rapid response efforts though email alerts and other outreach efforts. The application facilitates communication among individuals, partners, and organizations working to protect the natural and agricultural resources of NY state from the impacts of invasive species.

Statewide invasive species management is implemented through eight PRISMs (Partnerships for Regional Invasive Species Management). The PRISMs have many responsibilities, such as to plan regional management, develop early detection and intervention plans, coordinate control and eradication projects, educate, coordinate with partners and other PRISMS, recruit and train volunteers, and support research efforts.

Watercraft Inspection Steward Programs (aka Boat Launch Stewards Program)

Recreational boating has been identified as a key pathway in the spread of aquatic invasive species (AIS) across New York State. The Aquatic Invasive Species Management Plan  was adopted by New York State DEC in July 2015 to clearly outline the AIS strategies utilized throughout the state. New York is particularly vulnerable to AIS due to the easy access that ocean-going vessels have to the Great Lakes and the ease by which these species can spread via the state’s canal system. Aquatic invasive species can also find their way into New York State through the live animal, nursery, and landscape trades. Once in New York State, AIS are primarily spread by humans, either purposely though their direct release, or incidentally through recreational boating and angling. Note that aquatic invasives can be transported via “other” recreational watercraft such as windsurfers, kayaks, and canoes, too.

Watercraft inspection and associated steward programs are critical components in protecting aquatic ecosystems and water quality by preventing and limiting the spread of aquatic invasive species among waterbodies in New York State and neighboring states and provinces. Many organizations across NY have had boat launch stewards positioned at boat launches for years. The boat launch stewards gather information about boater’s knowledge of invasive species and check watercraft for fragments of invasive organisms. Tracking reports of different species and how frequently different locations are used by water recreationists is important for prioritizing outreach and control efforts and for choosing boat launches that allow stewards to reach the most recreationists and reduce risk of introduction at high use launches.

Continue reading

2017 GeoCon Wish List: Part II

In January of this year, I published my first 2017 GeoCon wish list relative to geospatial mapping applications and topics I’d like to see as part of the Lake Placid October 17-19 conference.  Since January, writing and publishing eSpatiallyNewYork has enabled me to communicate with a wide range of individuals and organizations involved in geospatial programs across the state  – some of which are included in the list below.  Others itemized on the list are new business start-ups,  government and nonprofit initiatives, and programs involved in the emerging drone technology.

So without any further adieu, here is Part II itemizing geospatial topics and program areas I’m advocating for 2017 GeoCon in Lake Placid.  Speakers, presentations, and ideas to mix things up and start some new discussion – and why.

Opioid Crisis Mapping

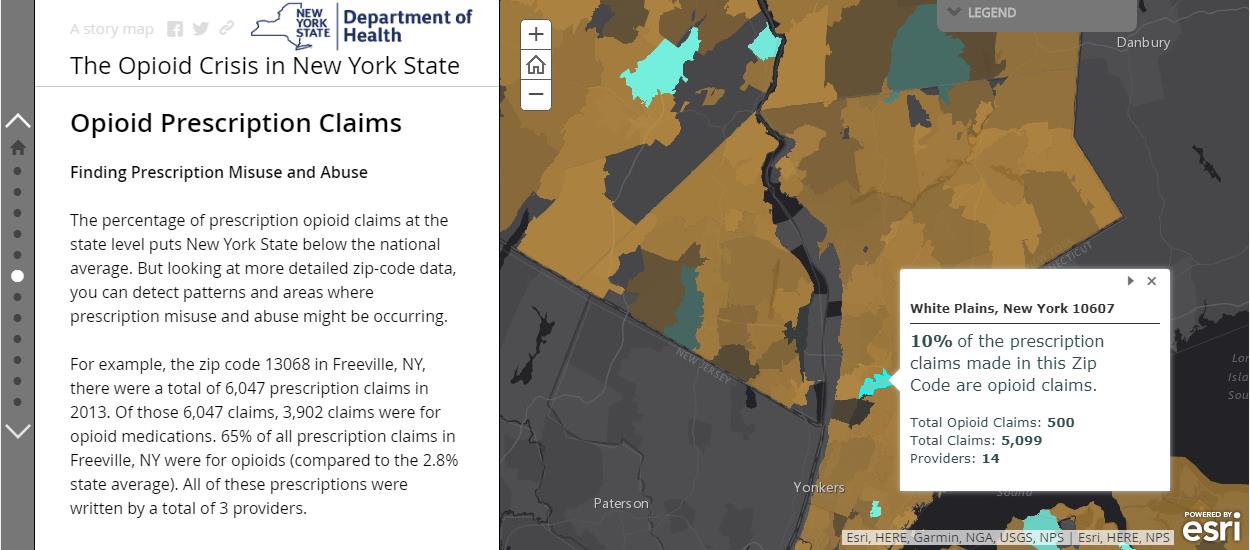
With the opioid crisis well documented in New York State, Story Mapping and data visualization help further detail the magnitude of this public health issue to a much wider audience.  Story Maps also enable authors with much greater flexibility in developing a narrative to accompany the data which might be otherwise be difficult to interpret or understand with just a map by itself.  Here in New York, it’s the hope to see greater use of Story Mapping (not just ESRI’s solution – all platforms) by agencies and organizations which historically have been reluctant to publish maps due to concerns of data which might be sensitive or misinterpreted.  This Opioid Story Map provides a powerful message and can prove to be a catalyst in seeing other statewide public health data being published in a similar geographic format.  It would be interesting to hear more from this Story Map author(s) about the datasets used (availability, sensitive/non-sensitive, sources, etc.) and possible collaboration with other GIS programs and agencies at the federal, state, and local level.  See also the Northern Kentucky Story Map:  The GEOStory of Opioid Addiction and The Urban Observatory: The Opioid Epidemic.

Story Maps provide an easy and powerful framework to combine narrative and maps which is often very helpful when publishing sensitive or “difficult” to interpret data. Publishing agencies have can better help how data is interpreted and read.

New York State Wildland Fire Mapping

Nothing special or cutting edge here geospatial, but I’ve always had a soft spot for wildland fire maps having served on U.S. Forest Service interregional fire crews back in the day in both Idaho and Montana.   Though in context of publishing fire data, it’s unfortunate how little capacity New York State Department of Environmental Conservation (DEC) has built in context of publishing their data and products as services. Not that statewide wildland fire data and map services would be a top seller for DEC, but the image below (scrapped from the DEC website) speaks to the continued reliance on static maps and other enterprise map applications  which cannot be consumed by other viewers.  The map is actually interesting in showing how there are more fires per square mile closer to urban areas (red) than in the more forested areas such as the Adirondacks – where most would think wildland fires occur and with more frequency.   Publishing this type of data as some type of map service would Continue reading