The Definitive Map for New York State Media Arts

New Online Application Shows Locations and Services for Organizations and Artists Across the State

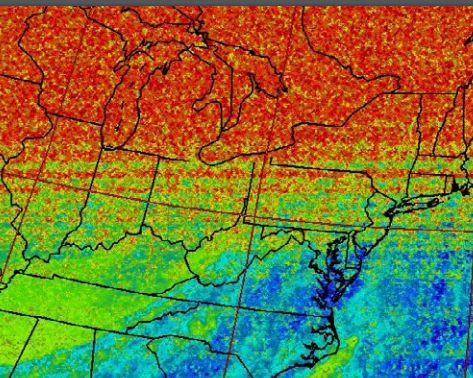
Image from Heidi Neilson’s Southern Florida Beachball Antenna Archive (2017)

While the Empire State geospatial community is accustomed to seeing terms such as Google Maps JavaScript API, GeoJSON, and HTML as part of the conversation in building online mapping applications for government and business, we increasingly see the use of these same online mapping development tools in the nonprofit sector as well.  One such example is the newly updated New York Media Arts Map which is a project of of the New York State Council on the Arts (NYSCA) Electronic Media and Film program, managed by Wave Farm.  Though Wave Farm is more commonly recognized as an arts organization dedicated to transmission arts with FM and online radio stations, it is their regrant partnership through NYSCA which ultimately led to its stewardship of the online Media Arts Map. Serving in this capacity, Wave Farm assists in administering and distributing grant funds, ranging from $500 to $10,000, to dozens of New York State individual artists and organizations – all of which are included in the Map.

The Map

At its core, the Map is an extensive online catalogue of Media Artists, whose interdisciplinary work includes a wide range of fields including visual art, film, computer graphics, data visualization, sculpture, architecture, music, photography – even drones – and much more. The Map lists organizations which are recent grantees of the NYSCA Electronic Media and Film program (EMF) and the Media Arts Assistance Fund (MAAF).  In all, there are 198 organizations and 69 artists included in the Map.  First launched in 2009 and originally hosted by Rhizome, the 2014 update is the work of Peter Berry who is a developer affiliated with Supercosm, a Seattle, WA based firm which focuses on work with nonprofits.  In addition to the software components already mentioned, Peter’s work on the back end of the map includes the use of open source pieces CakePHP and Apache bundled with MySQL.

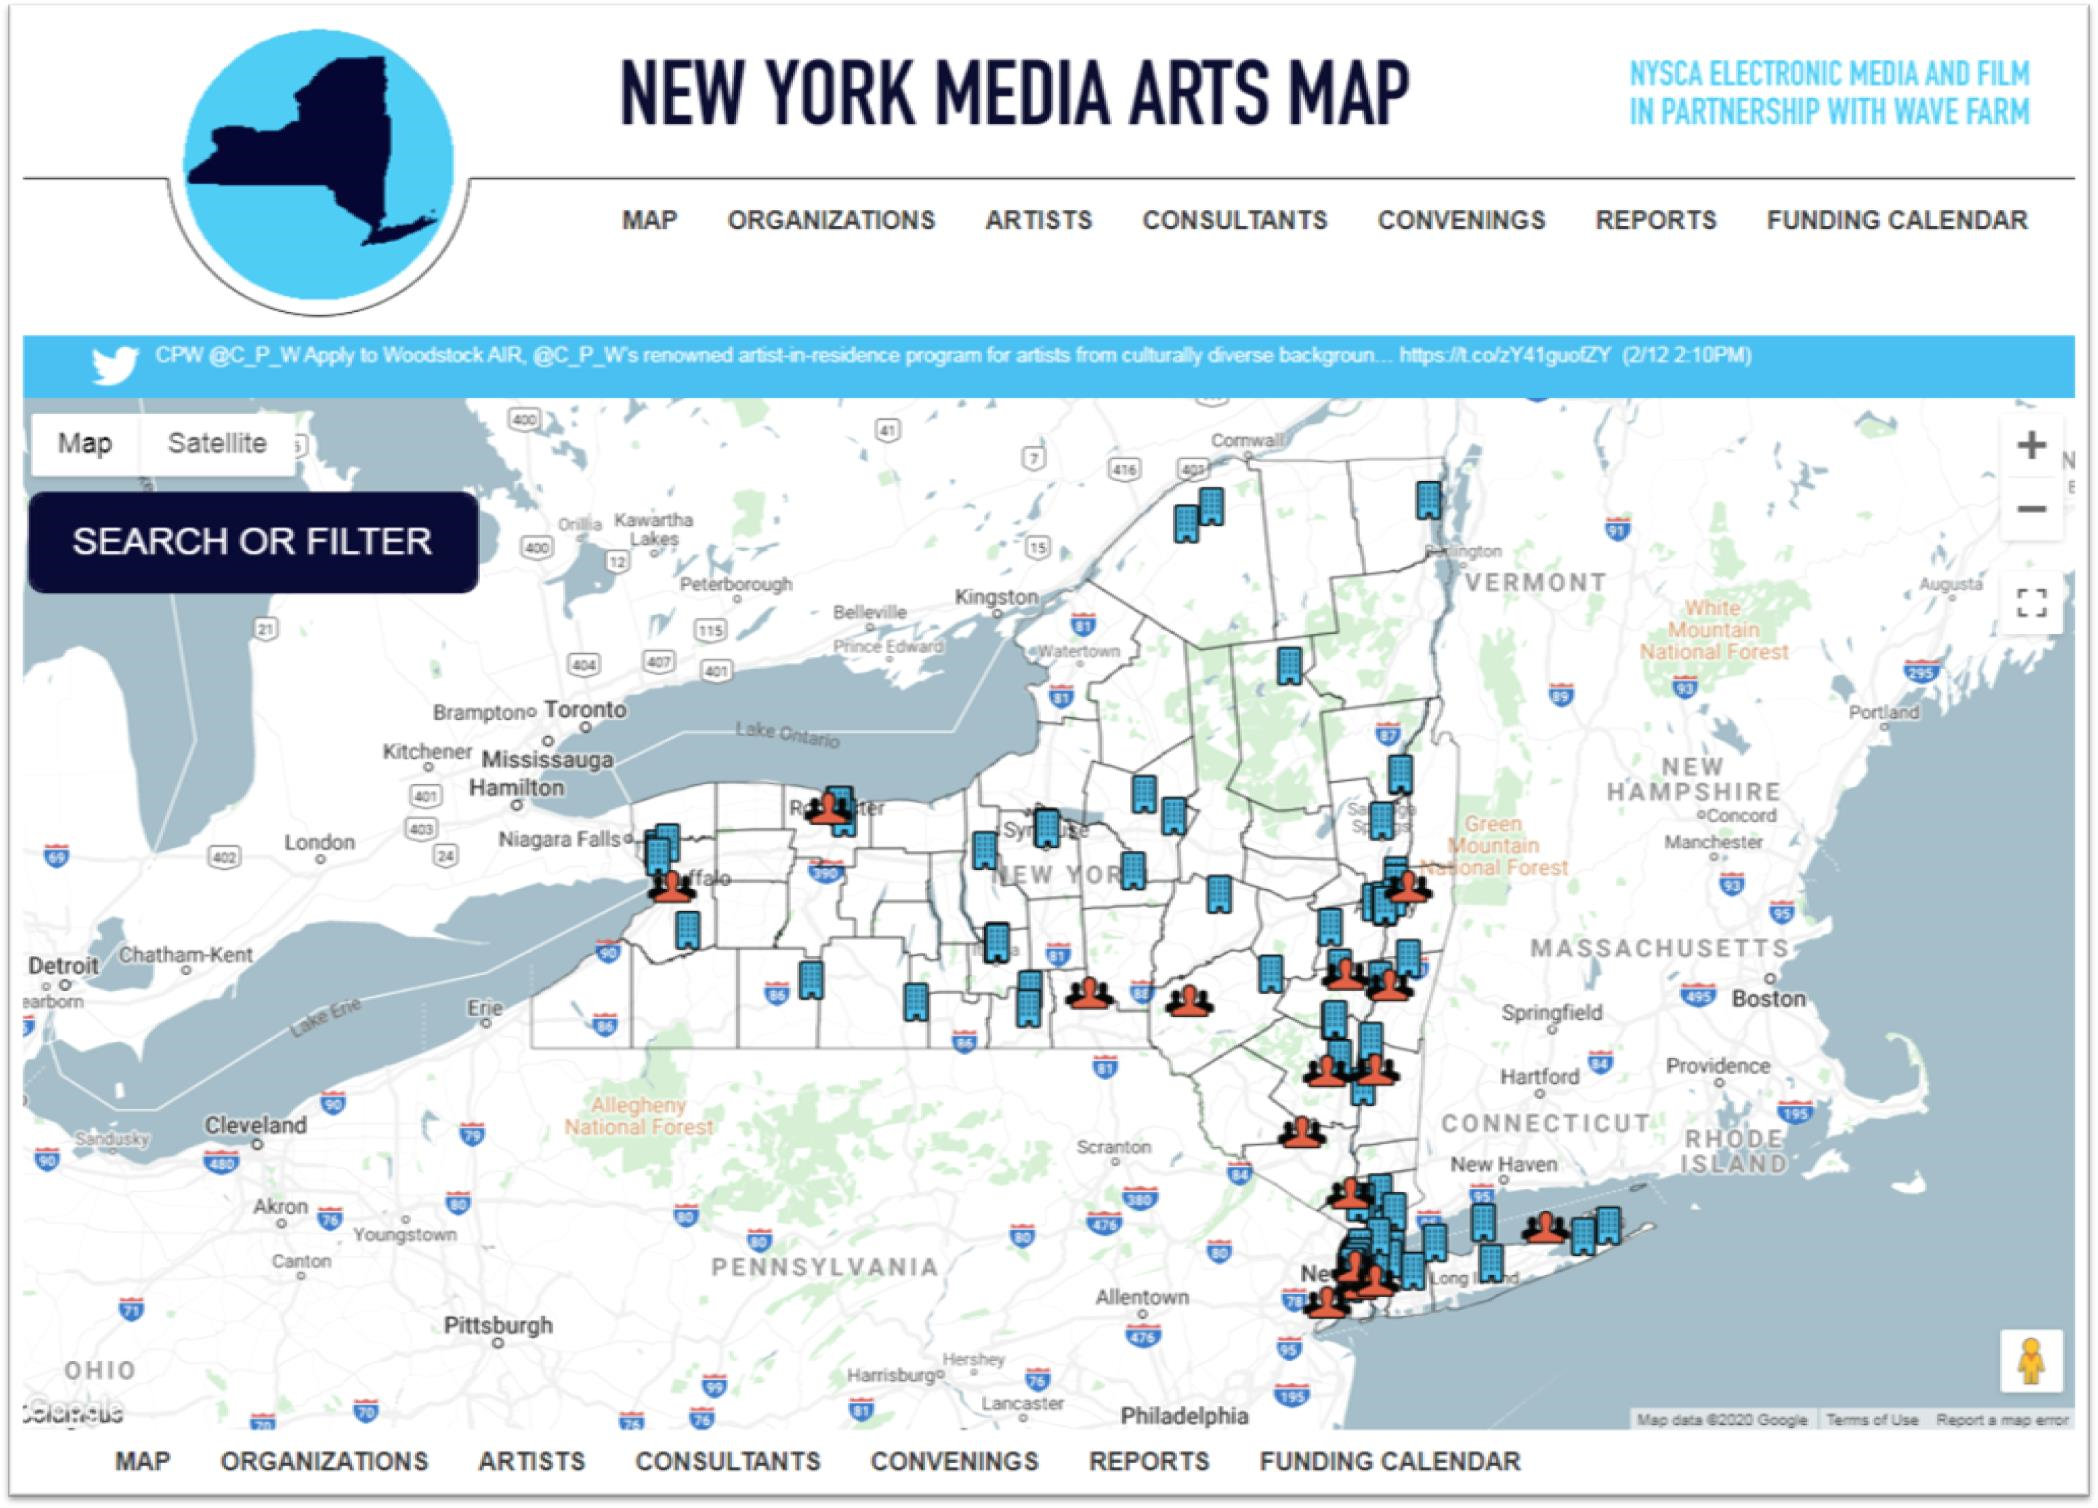
In addition to providing location information on organizations and artists included on the map, pull down menus along the top tool bar include additional statewide media arts information on meetings and workshops, partnership reports, and information on funding opportunities.

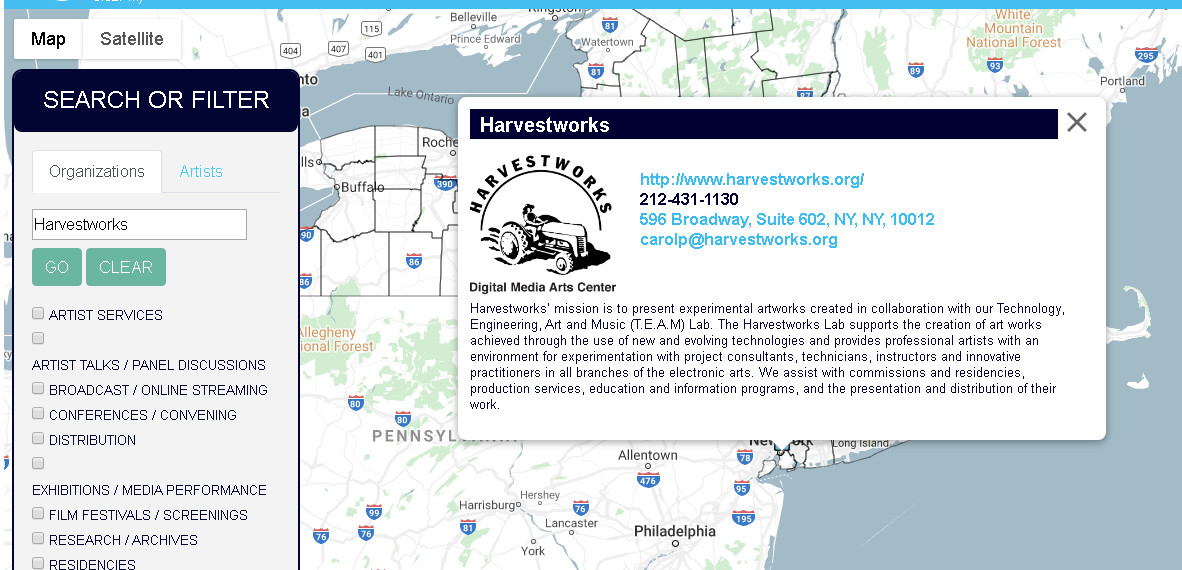
The Search box offers a wide range of options to filter the organization/artist database. Search queries provide a description of the types of work, services, and types of media arts offered as well as online contact information.

Intersection of Media Arts and Technology

It’s interesting to see, albeit even on some small level, how  the media arts world finds itself close to the geospatial space.  For example, take the work of  Harvestworks which supports the creation of art works achieved through the use of new and evolving technologies and provides an environment for experimentation with project consultants, technicians, instructors and innovative practitioners in all branches of the electronic arts.  A recent report by the organization entitled Common Ground provides “an overview of how and where transdisciplinary work is taking place in New York State, and makes recommendations to encourage further opportunities for artists that, when combined with environmental research, can aid engage the public, encourage environmental stewardship, and benefit communities”.

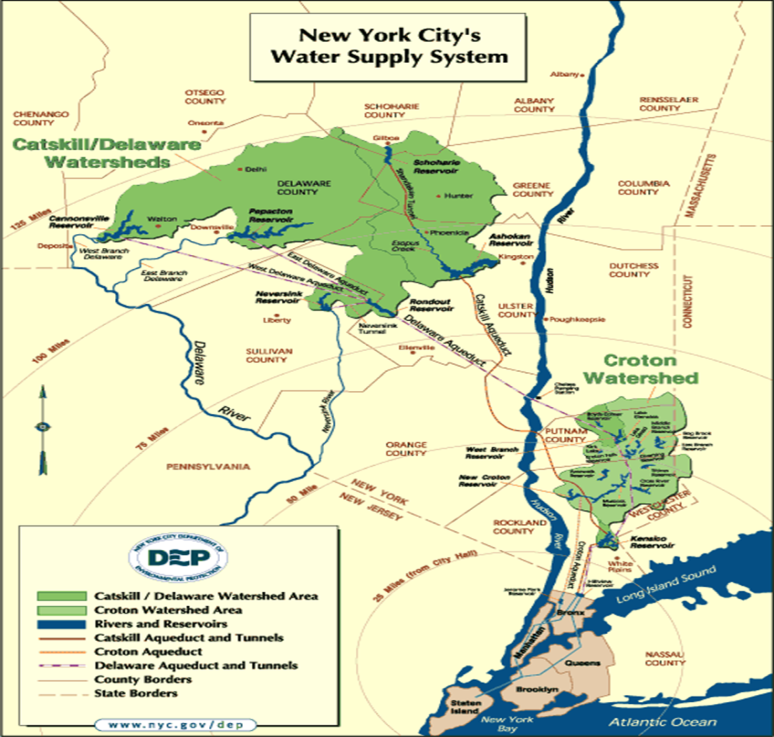
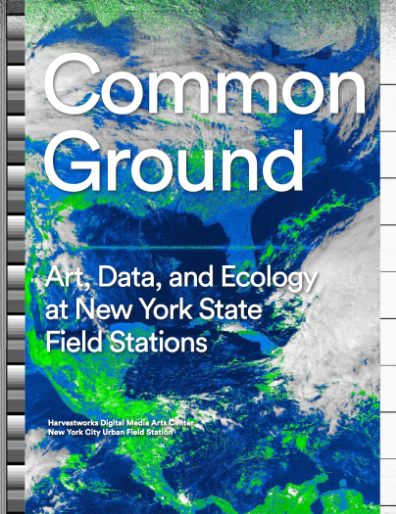
The report was published by the Harvestworks Digital Media Arts Center and The New York City Urban Field Station which is a partnership of the U.S. Forest Service, New York City Department of Parks and Recreation, and the Natural Areas Conservancy. (The Field Station in NYC supports the Arts and Humanities Residency Program. Check out the Summer 2018 Moon Arrow project – a time lapse compilation of the Moon Arrow pointing to the moon on New York City shorelines).  Open data, building code and hackathons in the geospatial space of your interest?  Then take a look the work of the School for Poetic Computation.  And how about drones?  While the technology is evolving incredibly fast, there was the 2018 Art Omi, Wave Farm and eteam live performance of The Aerial Actor which focused on the rising use of drones in science and art.  Actual drones were used as both carriers of messages and actors in the performance.  “The Map is a vital resource identifying art and technology projects and activity throughout New York State supported by NYSCA Electronic Media & Film”, says Galen Joseph-Hunter, Executive Director, Wave Farm. “It is also a useful tool for showing a geographic picture of how support is distributed throughout the state.”

Summary

So stop for a minute, grab a cup of coffee and put down the pen, I mean your mouse, and take a deep drive into the New York Media Arts Map site.  See what’s in your region, maybe even your neighborhood.  Support the statewide media arts community.  Cool stuff – all from the traditional artistic settings to the avant garde and experimental.  And sometimes, just a one-off from the geospatial space we work in.

Enjoy.

Contact:

Galen Joseph-Hunter
Executive Director
Wave Farm
Radio: WGXC 90.7-FM, Transmission Arts, Grants
518-622-2598
galen@wavefarm.org

Spatial Data Science Conference 2019

I had the opportunity to attend the 2019 Spatial Data Science Conference (SDSC) at Columbia University on October 16th.  Hosted by NYC-based Carto, the event was attended by over 500 people from government, nonprofits, industry and business, and academia.  The day-long conference was highlighted by a variety of presentations and lightning talks from data scientists and program managers representing organizations from around the world including Uber, Airbnb, Datarobot, Waze, Instacart, MIT, Sidewalk Labs, Two Sigma, and Facebook among others.  All of the presenters use Carto’s Software as a Service (SaaS) platform which provides GIS functionality, web mapping, and spatial data science tools.

Data Science

Founded in 2017, SDSC  brings together organizations who are pushing the boundaries of spatial data modelling – ranging from large enterprise, to cities and government, as well as thought leaders from academic institutions.  Shown through the use of geospatial applications and organizational project initiatives, there was no doubt the common denominator and focus of those attending:  Data. It was definitely worth the trip.  SDSC is similar, but a very different kind of a “geospatial conference” for those of us who have spent a career running in traditional government geospatial circles.  Attendees and presenters are largely a completely different make-up from those normally attending the annual New York State GIS conferences.  (Of the 500+ preconference registrants, nearly 55% were from the private sector).   The day’s event included high quality presentations on the latest in modelling techniques, data science and analytics, visualization practices, and new data streams.  This later issue an increasingly important and interesting one across the statewide geospatial community as the day’s conversation clearly illustrated both the growing number of online geospatial data sources  (for example, numerous references were made to U.S. Census Bureau American Community Survey) and related data access tools.  Speakers noted both the importance and benefits of open data portals though not without the caveat that it was not uncommon to have to clean and often normalize the data prior to using in applications.  Numerous references to popular sites such as GitHub, Leaflet, OpenStreetMap, and Elastic (which presented at the event) were made with regard to supporting the open source ecosystem.

Mudit Srivastav from Australia-based Origin Energy, presented on the use of spatial data to support the increase sales of residential roof top solar panels. Note the many types of data the company is using to better define growth areas.

Data for the Social Good

Another common theme throughout the day was the use of geospatial data for the social good.  Interesting to hear the point being made not only from nonprofits and academia, but from the private sector as well.  Way far away from the normal Albany GIS crowd, Stuart Lynn made a presentation focusing on how Two Sigma, an investment management firm located in New York City, provides spatial analysis support through the company’s Data Clinic program to nonprofits, academic institutions, and government organizations.  Their focus:  Enabling and promoting social impact through data driven predictive models while funding breakthrough research, education and a wide range of charities and foundations.    The image below identifies some of their recent projects.  Great stuff and I’m already planning on a more in-depth article with Stuart in the future.

Enabling Social Impact Organizations with Spatial Analysis Techniques

Stuart’s talk, as well as others during the day, made reference to the  The Data for Good movement which was a social media movement first started by DataKind to highlight how data science could be used to help address a range of humanitarian issues. DataKind is a collaborative network of organizations that work together with data scientists to leverage the science of data for social impact.  DataKind’s afternoon presentation “Spatial Data Science for Social Good:  Improving Access to Dignified Sanitation in Haiti” was excellent.  The video for this session and all of the day’s presentations are now available online at the Spatial Data Science Conference website.

Arguably, the demand for “data scientists” will increasingly intersect and expand in government geospatial programs in areas such as the health and human services, climate change, public safety, sustainability and resiliency,  and social and environmental justice to name only a few.   As the universe of geospatial data continues to expand and be integrated with both new artificial intelligence (AI) and machine reading technologies, as well as combined with the availability of more powerful GIS software, it is easy to see where the demand for data scientists focusing on locational and predictive analytics is headed.

I asked Javier de la Torre, Carto founder and SDSC organizer, what his impressions were of the day’s presentations and content.  He replied:

“First, moving the data discussion from WHERE to Why. Time to move to analyzing data using maps opposed to just seeing data in maps.  Second, the rise of the Spatial Data Scientist and/or where advance GIS is emerging as a new platform. And third, identifying the need for better data marketplaces which provides interactive solutions resulting in increased performance to users”

Links to the 2017 and 2018 presentations are also available on the SDSC website.

Mobility for All Abilities Hackathon

While I personally did not attend the September 21st Mobility for All Abilities Hackathon at the  Brooklyn Army Terminal, I had originally intended to put together a short summary article to post on the day’s events and activities after gathering information from BetaNYC staff.  But instead, check out BetaNYC’s own detailed summary here – its quite good.

The event coincided with the 2019 National Day of Civic Hacking and was co-hosted by by BetaNYC and MakerSpace NYC which partnered with  NYC Department of Transportation, NYC Mayor’s Office of People with Disabilities, NYC Mayor’s Office of Data Analytics, and other organizations to setup eight challenges for a day-long map-a-thon and civic hacking to improve mobility equity in New York City.  Incredible results!

New York City Council Member Brad Lander provided opening remarks at the Mobility for All Abilities Hackathon. Photograph by Charlie Hartwell / CC BY

I’ve written about BetaNYC before and they have presented at the Westchester GIS User Group meeting in the past. They fill a much needed and recognized space in metro NYC towards facilitating these types of technology/geospatial events which can serve as a model for similar civic focused programs across the state.

For more information on their programs and activities, visit the BetaNYC website.


2019 Westchester GIS User Group Meeting

Making it the largest annual event to date, nearly 200 individuals attended the 2019 Westchester GIS User Group Meeting May 16th at Purchase College. The annual event included a diverse mixture of user presentations and demonstrations for attendees representing local and county government, utilities, nonprofits,  business and industry, and academia (both college and high school programs). Faculty and facility support from the College’s Environmental Studies program and sponsorship from twelve vendors again helped enable the Westchester County GIS community to meet and discuss the countywide geospatial agenda.  And by virtue of the venue, promoting SUNY GIS educational opportunities as well.   It was a great GIS day for all attending and participating.

As the day progressed, nearly 200 registrants assembled as part of the 2019 Westchester GIS User Group Meeting at Purchase College. The main lecture auditorium was filled to capacity with standing room only by mid-morning.

2019 Agenda and Speakers

While the 2018 agenda had a specific theme, this year’s agenda was intended to be more diverse covering a wide range of topics including health and human services, pavement management systems, oblique imagery applications, training workshops, forestry inventories, public safety, mapping and visualizing the human brain, the 2020 Census, and a special presentation by ESRI focusing on accessing the County’s new planimetric datasets via web services.

Session I:  Allison McSpedon and Jeff Worden from the Westchester County Continuum of Care Partnership for the Homeless led the day off with a presentation focusing on the use of mobile technology as part of the annual Homeless Point in Time (PIT) Count taken in January 2019.  This was followed by Nancy Birnbaum, Manager of Software Architecture, Westchester County Dept. of Information Technology who presented the new Westchester County Online Community Mental Health Directory.

Managers from the Continuum of Care Partnership for the Homeless detailed the pros and cons on the use of mobile data collection technology as part of the January 2019 count. They anticipate even better results and ease of use when deployed in the next count.

Andrew Reinmann, Advanced Science Research Center, Graduate Center of CUNY and Department of Geography, Hunter College followed with the use of geospatial tools as part of the Westchester County Forestry Inventory: Mapping and Ecosystem Services Assessment.  The morning session ended with a series of lightning talks highlighting the use of the County’s new oblique imagery.

Session II: After intermission, VHB and staff from Westchester County Dept. of Public Works and Transportation discussed the new Smart Asset Management and Inventory System (SAMIS) application which was followed by an excellent demonstration on the use of Laser Scanning technology by the Westchester County Police Forensic Investigations Unit.  Patrick Gahagan, Technical Analyst at ESRI finished the morning session discussing advancements in civil engineering and surveying integration between the Autodesk and ESRI platforms.

Detectives from the County Police Forensic Unit captivated the audience on the use of laser scanning in crime scene investigations. GIS staff is now working with the Forensic Unit on integrating laser scanning data into the enterprise GIS environment.

Session III:  After lunch – and an audience participation session of GeoJeopardy – Jonathan A. N. Fisher, Ph.D., Director of the nearby Neurosensory Engineering Lab at the  New York Medical College in Valhalla provided an overview of his project called Neurodome which centers on the mapping of the human brain with an assortment of technology and visualization tools.   Daniel Wickens, Solution Engineer from ESRI then gave two overviews on “What’s New with ArcGIS Field Apps and ArcGIS Online.”  Concurrently in separate locations training classes were offered on how to use the new online CONNECTExplorer oblique imagery viewer and the ESRI “Explore Future Climate Change” tutorial.

Session IV:  The last section of the agenda was brief and included an update on mapping efforts association with the 2020 Census by Margaret Baker, Geographer, from the U.S. Census Bureau Manhattan office.  The final presentation by Westchester County GIS staff included the latest developments and anticipated upgrades to the Westchester County GIS website including the scheduled launch of the Westchester GIS Geospatial Gateway

Individual meeting presentations can be accessed and downloaded using this link.

The U.S. Census Bureau is ramping up for the 2020 Census and has a variety of mapping and geospatial products in their toolbox. GIS technology is essential in helping identify areas which have had low counts and responses.

Little Things Make it Work

I’ve written before about the small details which we believe enable the Annual Westchester GIS User Group Meeting to continue to be successful – and we’re the first to admit there is always the element of luck.  Even the weather matters.  To the extent possible, elements such as keeping the content and speakers “Westchester” focused, minimal –  if any –  registration fees, lots of time for interaction with the sponsors on the exhibit floor, and the centrally located venue at Purchase College – all matter. One of the ironies, and downsides, of having the show on a college campus in mid-to-late May is that spring semester is already over and students have fled campus.  However,  there is normally a handful attending looking for summer or full-time work and passing out resumes.    The naturally lighted vendor area in the Natural Sciences Building, albeit small, adds to the personal “feel” of the show.    Easy access and plenty of parking is also essential.  And don’t forget lots of proactive outreach to the professional organizations and societies  we work with on a day-to-day basis:  police/fire, engineering, surveying, public works, assessors, nonprofits, and the planning community.   The added message here is to encourage consultants which are supporting local governments across the county – to attend the meeting.  To learn more about accessing and leveraging Westchester County GIS products and services and how this improves service and cost efficiencies to municipalities they serve.   Individually, any of these items listed above may seem trivial,  but they all add up in delivering a show that will bring the same people back next year.

The exhibit floor was busy (and loud!) during breaks with all vendors noting interaction with attendees was good and productive. All attendees can complete a Vendor Bingo Card and be eligible for a raffle prize at the end of the day. This year’s prize was a vendor donated iPad!

Summary

Over the next couple weeks, conference organizers will be sending out a survey to both attendees and vendors to gather more detailed information on the various elements (presentations, speakers, refreshments/breaks, vendor interaction/feedback, facility issues and the like) of the show.  This information will help guide decisions about content and any changes that may need to be made, if any, about the structure of the show.

Staff will take a few months off and begin planning for the 2020 show in the fall of this year.  In doing so, we look forward to the continued relevance and position of the Westchester GIS User Group Meeting in promoting countywide geospatial development and use.

Watershed Agricultural Council: Geospatial in Upstate NYC Watershed Lands

The New York City Watershed is the largest unfiltered surface water supply system in the United States. Every day this region in upstate New York’s Catskill Mountains provides more than a billion gallons of clean drinking water to the more than nine million people residing in New York City and upstate counties. The system includes 19 reservoirs, three controlled lakes, and a watershed that spans more than a million acres. In some cases, water travels more than a hundred miles to reach New York City.  While other large US cities typically own the land that drains into their reservoirs – New York City’s lands are unique:  Nearly 75 percent of the watershed lands are privately owned with NYC and the State of New York owning a mixture of the remaining lands.  Consequently, New York’s water quality depends in large part on the actions of the 30,000 landowners who live, work, and recreate on watershed lands.  Overall, nearly 70% of the watersheds are forested with the remaining lands in predominately agricultural use.

The Watershed Agricultural Council (WAC) is one of two primary watershed partners (Catskill Watershed Corporation being the other) locally-based not-for-profit corporations specifically created to assist New York City Department of Environmental Protection (NYCDEP) with the administration and implementation of watershed protection and economic development programs in its water supply lands. The WAC is involved primarily with natural resource and land conservation programs, whereas the Catskill Watershed Corporation primarily oversees community infrastructure and economic development programs. Many other watershed partners serve in various capacities, such as oversight, advice, public education, and communication.

WAC Geospatial

WAC GIS and geospatial applications are built to support four major program areas within the NYC watershed lands:  Forestry, Agriculture, Conservation Easements, and Economic Viability.    Managing these applications and infrastructure in their three offices [(Walton,  Hamden , and Yorktown (East of Hudson)]  is the responsibility of Nadine Trahan who joined WAC three years ago after having attended both undergraduate and graduate school in New Zealand.  Nadine developed and maintains a ESRI Geodatabase to support enterprise geospatial applications.  She notes wireless connectivity and high speed internet connectivity can be a “challenge” in the rural Catskills which plays into the deployment of the enterprise applications.  Given the connectivity issues, Nadine uses ArcGIS Portal to design and download applications to mobile devices for in-field deployment:  Data collected remotely is synchronized with the enterprise geodatabase when field devices are connected to the network upon return to the office.  She currently supports approximately 40 users involving everything from high-end client software apps to browser-based applications for the more casual user.  This later category of user being staff which use an internal web map to edit point locations of Pure Catskills members as part of the Economic Viability focus.
Continue reading

2018 Westchester GIS User Group Meeting

Westchester County GIS has been fortunate to build a broad and diverse community of GIS users and followers over the past two plus decades which is embodied at the our annual GIS User Group Meeting each May.  Similar to many first generation GIS government programs which were created in the late 1980s/early 1990s, most of the first decade worth of geospatial programs and applications Westchester County GIS developed were government focused.  But as geospatial technology grew at warp speed in industry and business and combining the development and availability of a high accuracy countywide Westchester County digital base map,  the visibility of the program quickly expanded.  Interest from public safety, nonprofit, academic and civic groups soon followed.   And not to minimize the importance of the continued political support the program has maintained over the past two decades at both the county and municipal level.   Illustrative of this year’s May 17th meeting held at Purchase College, nearly 170 representatives from  government, industry and business, utilities, academia, nonprofits,  community groups, and the military convened for the sharing of presentations, geospatial solutions, and best practices to move the countywide and regional geospatial agenda forward.

2018 Agenda

In years past there had always been an effort to keep the presentations and agenda diverse – a little bit of everything.   While this has generally served us well over the years, this was the first year we had a specific theme:  GIS for Resiliency and Sustainability.   This was in response to recent work our GIS program had completed in context of investigating potential impacts of projected sea level rise on county-owned assets as well as administrative changes in the Westchester County Executive  office as a result of the November 2017 elections.  In the process of bringing these two issues together and including the Office of Sustainability at Purchase College, we were able to add Westchester County Executive George Latimer and Purchase College President Thomas Schwarz to our agenda.  Both mentioned and acknowledged the importance and relevance of technology and geospatial in supporting the regional sustainability agenda.

Westchester County Executive George Latimer talking with 2018 User Group meeting attendees. He made reference to the use of geospatial technologies in confronting Climate Change issues.

2018 Speakers

Working with the theme of GIS for Resiliency and Sustainability, we were able to include two well recognized state government speakers in Mark Lowery, Climate Change Analyst with New York State Department of Environmental Conservation, and Amanda Stevens, Project Manager with New York State Energy Research and Development Authority (NYSERDA) Environmental Research Program.  With the County’s work in this space increasingly including nonprofit groups, representatives from both  Abundant Efficiency and the Westchester Community Foundation were also on the agenda.  In the mix were talks by SUEZ North American (water utility) and BetaNYC – an open data advocacy organization based in New York Ctiy.   Additionally, we continued to feature our ongoing relationship with the U.S. Military Academy at West Point with a noon presentation by Lieutenant Colonel Jared Ware.  Our afternoon session of Lightning Talks and panel discussion featured Sustainable Westchester and representatives from five local governments.

In the morning session, Amanda Stevens provides an overview on NYSERDA’s work and research efforts in the area of climate change – which includes programs in the Lower Hudson River region

Bringing it Together

Admittedly there is always a little luck in hosting conferences such as this and it only takes a day of bad weather for attendance to bottom out (been there).  Of course, nothing beats an agenda based on current and cutting-edge geospatial topics backed with recognized speakers, but there are a couple other factors worth noting that seem to help make all of this work for us, including the following:

All Things Local:    For all the benefits and advantages of the larger shows, localizing the day’s content and message for local/regional like-minded individuals goes a long way.  Geospatial business needs and problems – and often the solutions – are conceptually very similar.  Familiar faces with familiar issues.  The organic approach.

Affordability:   Offering such events at a discount, like free as in our model, makes the event more attractive to more people.   However,  if its free, it is easy to not show.  Nothing paid nothing lost. And we have the historical numbers to show as such.  Over the past six-seven years we’ve seen a 25%-30% no show rate from the actual number of pre-conference registration numbers.    That said, we’ve learned to factor this variable in the printing of conference materials and sizing break refreshments and lunch.  We’ve also learned over the years that other groups and professional societies we’ve tried to partner with in hosting the show may be hesitant to collaborate because they (other organizations) do not want to send a message to their memberships that meetings, and certainly ones that offer Professional Development Units (PDU), are available for free. The bottom line for us is that we continue to make the show free based on vendor fees and affordable food services from the venue location.  And besides, there is no capacity to collect money online and/or to deal with bank accounts.  What little money management needs we have are handled graciously through the college.  Getting pass the bouncer at the door for free works for us.

Vendor Interaction:  I can’t say enough about how important this is.  We put a lot effort into making sure our sponsors have ample time for interaction with the attendees. Information gathered by attendees in the exhibitor area only adds to the overall value of their day.  Food and refreshments are close by so everything (and everybody) is in reaching distance of the vendors.  We also have vendor “Vendor Bingo Card” game that encourages attendees to visit each vendor table to qualify for a prize drawing.  Pretty nice incentive as this year the prize was a vendor donated iPad.   All sponsoring vendors are entitled to 5-minute “Vendor Spotlight” presentation over the course of the day.  Without vendor support the day doesn’t happen so we make it worth their while.


Everything is nearby at the Westchester GIS User Group Meeting. Vendors, refreshments, and the main auditorium are all intertwined and close. Making the experience interactive and personal on many levels. It’s a win-win for everyone in attendance. Who are those folks in pink?

The Venue:   For the past seven years, Purchase College has graciously made their facilities available to us to host the show.  Prior to that we bounced around the County at other locations, but given our relationship with the faculty in the Environmental Studies Program this became a logical spot. Centrally located in mid-Westchester.  Easy access.

A naturally lighted vendor area, albeit small, adds to the personal “feel” of the show.  One of the main reasons we originally went to Purchase during the third week in May was that the Student Union cafeteria was still open we could make lunch “on your own”.  Avoiding all the overhead and cost of providing lunch.  We’ve since been able to work with campus caterers to provide us with an affordable lunch menu which is vendor sponsored.   This “grab lunch and go” format enables users to eat where and how they want –  attending special lunch time presentations, continued discussions with vendors, or simply going outside to eat on the campus plaza.  The entire agenda is plenary format held in a cathedral style 150-seat auditorium.    We once tried a concurrent sessions format but it just didn’t work and feel right so we went back to the basics.  Post-meeting training sessions have proven to be hit or miss.  Just seems that just come 3PM after a long day of presentations, networking, and interacting with vendors, most folks are running to the exits.  Or the no-host reception down the street.

One of the ironies – and downsides – of having the show on a college campus in mid-to-late May is that spring semester is already over and students have fled campus, though  there is normally a handful attending looking for summer or full-time work and passing out resumes.    But we clearly do not have the college student attendance that is seen at comparable conferences such as GIS-SIG.

Engage the Professions:  We make a significant outreach to the “aligned” professions including engineering, public works, surveying, police and fire departments, government administrators, the planning community and increasingly nonprofits.  I wish there was an easier entry point into the 41 school districts here in Westchester County – and particularly their uber large budget bus transportation systems – but we’ve never been able to find it.     We  focus our efforts to reach the professions with individuals and technical staff that use geospatial technology.  Day-to-day work flows that has geospatial intertwined –  but is not the only focus of their business day.  Truth be told, there simply aren’t a lot of individuals locally who only do GIS work during the course of their business day.  The carrot that we offer across the board – and the common denominator – is the geospatial content we publish from our program via our data warehouse or map services.

Summary

Declining government budgets and  travel restrictions positions the Annual Westchester GIS User Group meeting as the primarily, if not only, major GIS event many of our government attendees get to each year.   It enables us to craft a geospatial message in context of local needs and applications as illustrated in this year’s theme “GIS for Resiliency and Sustainability”.  And keeping in mind the importance of their support, the event provides a great framework for industry and business to showcase their product and services.  And none of it possible without the support of the great folks at Purchase College.

Cognizant of the many differences and capabilities within the regional GIS communities,  it is often difficult to host such events on a reoccurring basis.  Perhaps some of the elements of our event can be used in helping build capacity for creating similar events for other regional GIS user communities across the Empire State.


2017 NYS Spring GIS Conference Specials

The last couple weeks I’ve been engaged in the following cutting-edge enterprise geospatial issues:  (1) staring at the sky on a daily basis,  (2) monitoring the temperature, and (3)  hoping the remaining snow to melt and the leaves to hold off in budding – both at the same time.  After nearly 33 years in County government and its boiled down to this! Why?  So we can get our aerial photography flown over the next 10-days to support our 2017 countywide base map update.  The heavy snow March 14th really set us back and the window to capture the photography is closing quickly.

So at any rate, its been easy to lose track of upcoming Spring 2017 regional one-day GIS conferences and meetings over the next 4-6 weeks.  Most of the Spring 2017 shows are held in locations accessible via a maximum 2-4 hour drive from furthermost parts of the Empire State, offer a wide range of geospatial topics and presentations, provide excellent networking opportunities among colleagues and industry representatives, and are generally light on the wallet.    For those unable to make or justify the big lift of getting to the uber ESRI conference in San Diego later on in the summer and/or chasing GISP certification credits these venues are for you.

Sounds sweet, right? So consider the following and get your travel approvals in order:

GIS-SIG 26rd Annual Conference, April 11th, Burgundy Basin, Pittsford, NY.  Unfortunately I cannot make GIS-SIG this year as it is one of my most favorite statewide one-day shows.  GIS/SIG provides the premier geospatial professional forum in the Rochester/Genesee Finger Lakes/Western New York region for GIS practitioners focusing on trends and policies relating to new geospatial technologies and current projects.  With a loyal following, the size and content of the GIS/SIG conference is broad enough to often substitute as an annual state conference for many GIS practitioners in the western half of the state. This year’s conference again includes vendor displays and an agenda covering topics such as mobile data collection, drones, 3D GIS, and ESRI software updates, as well as a keynote address from Dr. John R. Schott, founder of the Digital Imaging and Remote Sensing Lab at the Rochester Institute of Technology (RIT).  Corporate sponsorship keeps the price tag of an individual registration at under $100 for the day which also includes lunch. Online registration is still available and while you are at the GIS/SIG website you can also see the many resources and links GIS/SIG provides to its user community.  This is a great show and if you have the opportunity to attend. Highly recommended.

Long Island GIS (LIGIS)  2017 Spring User Conference, April 26th, SUNY Farmingdale, Farmingdale, NY.  LIGIS meetings and conferences have grown in structure and content over the last few years and this spring’s April 26th meeting will continue to illustrate the improvement among the Long Island GIS stakeholder user community.  Scheduled presentations from government, academia, and industry are on the agenda including topics covering mobile applications, MS4 data collection, 2020 Census Bureau update, and GIS & hydrofracking among others. Located in central Long Island on the SUNY Farmingdale campus, this is a not-to-miss conference on “the Island” for those with limited travel budgets.  Make plans to attend.  Those interested in attending can monitor conference specifics at the LIGIS homepage.

Northeast Arc User Group (NEARC) Meeting, May 15th, University of Massachusetts, Amherst, MA.  Spring NEARC meetings are conveniently located in Amherst, MA which is easily accessible to the Albany Capital District and GIS professionals in eastern New York State.  Unlike GIS – SIG, which is software vendor independent, this show is very much ESRI centric and packed with high quality user presentations. Even though only one day, the show has grown to be so popular that it now competes with the larger multi-day GIS shows and conferences across New England.   Price tag for attending:  $65 which includes lunch.  If you can afford an overnight, activities the evening before downtown Amherst and a hotel room at the UMass conference center make it even more worth your while. (As of the day of this blog post 4/4 the May 15th agenda was still in development; I did submit an abstract!).  Registration will open mid-April.  If your organization is an ESRI shop – this is a Spring show not to miss.

Westchester GIS User Group Meeting, May 11th, Purchase College, Purchase New York. As one of the largest geospatial meetings in New York State, the Westchester GIS User Group Meeting is a free one-day conference held at Purchase College. Made possible by financial support from exhibiting vendors and conference facilities provided by the college, the draft 2017 agenda  features user presentations from County government,  Westchester County municipalities, nonprofits including the Goodlands Project, and ESRI. There is also free conference training: At lunch “Leveraging Suvey123 for Mobile Data Collection” with instructor Larry Spraker and post-conference “Getting Started with How to Build Great Web Apps” with ESRI’s Mark Scott.   Also, sponsors get to present 5-minute “Lightning” talks over the course of the day.  The Purchase College location provides easy one-day access across the metropolitan NYC area, as well as the broader lower Hudson River Valley and southeastern Connecticut. Agenda and other meeting  specifics – including registration – are available from the Westchester County GIS website.

Other Venues:  If you are in the Metro NYC area don’t forget to check the GeoNYC Meetup calendar for ongoing meetings across the city. Subject matter and participation is pretty amazing.  And/or the many other geospatial related Meetups in the region covering big data, data visualization, agriculture mapping, and everything inbetween including drones. A little further removed geographically from the Empire State is the Northeast Geographic Information Society (NEGIS) conference on April 27th in Ashland, MA. You can follow and learn more about NEGIS via their blog.

The entire Empire State GIS community is fortunate enough to be close enough to a range of regional geospatial meetings and conferences which are accessible from most areas of the state and provide many of the same benefits of larger shows and not nearly as expensive.

Safe travels!

Finger Lakes Trail Conference: The Reach of Digital Mapping

As a hiker myself, I first visited the Finger Lakes Trail Conference (FLTC) website in search of information about the trail system with little knowledge of the incredible structure the organization has in place for creating and publishing hardcopy and digital maps. Thus, the genesis of this article and an overview of how FLTC makes all of the digital content come together.

Background

Established in 1962, the Finger Lakes Trail Conference (FLTC) mission is to “… to build, protect, enhance, and promote a continuous footpath across New York State. Forever!”  With administrative offices near the Mt. Morris Dam Visitor Center in Mt. Morris, New York, FLTC is a 501(c)3 non-profit organization which works in cooperation with its members and various organizations to develop and maintain the premier hiking trail system in New York.   The Finger Lakes Trail System includes the main Finger Lakes Trail (FLT) from the Pennsylvania-New York border in Allegany State Park to the Long Path in the Catskill Forest Preserve. The main FLT is 580 miles long. There are six branch trails and 29 loop trails and spur trails that extend from the main FLT. These branch, loop and spur trails currently total 412 miles. Including the Main Trail and all branch, loop, and side trails, the Finger Lakes Trail System offers 1,000 miles of hiking.    Today, more than 1,400 individual and family memberships currently support the FLTC  of which approximately one fourth actively volunteer to operate the organization and its programs.  The sale of maps and GPS track data help  build and maintain the trail system.

FLTC also recognizes Sponsors which are individuals or organizations which formally accept responsibility for maintaining a length of trail in the FLT System and Affiliates which are hiking clubs and Scout troops that operate their own local hiking program and sponsor (maintain) their section of the trail system. The FLTC is a Partner of the North Country Trail Association (NCTA) and cooperates with that organization and the National Park Service in maintaining and promoting that portion of the FLT that carries the North Country National Scenic Trail.  The FLTC is also a member of the Great Eastern Trail Association (GETA) and is constructing a branch trail of the FLT system (the Crystal Hills Trail) that will carry the New York portion of the Great Eastern Trail.

The Finger Lakes Trail System main trail from its eastern terminus in the Catskills to Allegany State Park in western New York State. From their interactive web application this image also show outlines of section maps which provide detail at larger scales.

Mapping and Cartography

Since the early 2000s with advancements in GPS technology and digital data collection, trail mapping responsibilities within the FLTC have been increasingly assigned to the Trail System Management program within the organization.   Within this structure, the mapping of new and/or changes to trails fall on the responsibilities of volunteers trained in use of  GPS devices – either their own Garmin device or an FLTC-owned Garmin Montana.  FLTC maintains  detailed specifications on what GPS devices are acceptable and how they are to be configured.  The GPX file from the walk is emailed to the mapping team which is currently under the direction of Greg Farnham and Jo Taylor).    Following a very detailed process document, the mapping team uses Garmin Basecamp to edit the official, unfiltered GPX track, which is referred to as the “trail centerline”.    There is adequate iteration with the person who walked the trail and the  Regional Trail Coordinator (RTC) overseeing that section of the trail where the data is being collected to ensure an accurate rendition of the (trail) data has been collected.  Regional Trail Coordinators and other FLTC administrative positions are highlighted on the organizational chart on their website. Continue reading

2017 GeoCon Wish List: Part 1

I first wanted to publish this article initially as a wish list to the GIS Santa Claus in early December, but the holidays came and went so I am now submitting it as a New Year’s wish list (Part 1) for the 2017 GeoCon  in Lake Placid.  There will  be other suggestions over the next several months and I’ll remain cognizant  what I wish for as I may be submitting an abstract to present myself.  Maybe.

So to start the discussion, here is an initial list of  ten geospatial mapping applications and program areas I’d like to send a speaker invite to for the 2017 GeoCon – and why.

NYS Office of the Attorney General:  New York Crime Gun Analysis https://targettrafficking.ag.ny.gov/tool/

While mapping continues to be one of the primary end products of GIS analysis, geospatial data is increasingly being used in a wide range of data visualization platforms such as Tableau.    I’d welcome the opportunity to attend a presentation by the Office of the Attorney on the Crime Gun Analysis report outlining data collection, data analysis, and the rendering of the data through maps, tables, and charts.  Not the normal GIS menu.

New York State Regional Economic Development Councils (REDC) http://regionalcouncils.ny.gov/

In context of geospatial, this program reference isn’t so much about “what it is”, as opposed to more about “what it isn’t”.  Or at least I think.  From my level, the REDC framework has always been somewhat of a mystery since current state administration created the 10 Regional Councils in 2011.  And even more confusing that the geography of the REDCs do not coincide with the statewide Regional Planning Commission boundaries. That said, there is an incredible amount of geospatial information and analysis in the Council’s underlying mission.  Everything happens somewhere.  And there is a ton of money coming through the Consolidated Funding Application (CFA) process which I believe the GIS community should be more engaged and recipients of to some degree. Uber opportunities for web mapping applications, Story Maps, and GIS-produced maps for publications though one would be hard pressed to see any real evidence of a professional GIS touch in any of the Council products and services.   I looked through four regional 2016 “progress” reports (Hudson Valley, Finger Lakes, Capital Region and Southern Tier and found very limited reference to GIS/geospatial technologies.   Some kind of presentation by one of the REDCs and/or regional GIS personnel involved in this program would be most informative for the statewide GIS community.  Otherwise I doubt we’re going to hear anything through the state GIS program office on this.

511NY
https://www.511ny.org/

This is more of a selfish request than anything because I really don’t fully understand the makings and how 511NY operates in context of GIS/geospatial data collection, sources, work flows, or even development of their applications including the online mapping stuff.  I do know it’s big, visible, seemingly growing in functionality, supported by a mess of New York State transportation agencies -even though it has its own .org web address.  It also creates a lot of data which would be useful to consume and use in local government web mapping applications.   I’d be the first one to sign up to hear how it all comes together, funding, sources of the data (including what is being taken from and/or generated at the local level), opportunities for collaboration with local GIS programs, and what’s next.  How long before we see an Uber icon on the 511NY homepage to help support trip planning?

Continue reading

10 Questions: Steve Romalewski

Steven Romalewski is currently director of the Mapping Service at the Center for Urban Research at The Graduate Center / CUNY.  During his 32-year career he has helped hundreds of nonprofit groups across the country leverage the power of GIS; helped develop more than two-dozen online mapping services analyzing environmental issues, social services, transit routing, demographic trends, voting behavior, and legislative representation.  He has also coordinated the work of community groups and others across New York to advocate for sensible environmental policies at the local, state, and federal levels.  For the past 10 years, he has taught students at Pratt Institute how to use GIS in their urban planning careers, and helped educate many others through presentations about the value of GIS.  He lives in Manhattan.

eSpatiallynewyork:  How did you end up in your current position at Center for Urban Research?  

Romalewski:  Before joining CUNY I ran the Community Mapping Assistance Project (CMAP) at NYPIRG for about eight years, providing mapping services to nonprofit organizations across the country.  (Before that I was an environmental researcher and advocate at NYPIRG.)  By 2004 or so, CMAP’s work had started to outgrow our advocacy-oriented parent organization. Internally we discussed options of spinning off CMAP as a social business venture, merging it with another organization, or launching it as its own nonprofit.

At the same time we were going through a strategic planning effort for the OASIS project, and one of the key findings was that OASIS would benefit from an institutional setting such as academia where the OASIS website would be able to leverage more stable technology resources and organizational support.

One of the academic programs we talked with was the Center for Urban Research (CUR) at the CUNY Graduate Center.  I had worked on projects over the years with CUR’s director John Mollenkopf, and he was a big fan of our work. It seemed like a great fit, and in January 2006  I moved to CUNY.

eSpatiallynewyork:  How do CUR projects come to be or developed?

Romalewski:  We’re fortunate to have a good amount of leeway in deciding on projects.  Generally CUR engages in applied research projects in the areas of neighborhood change, immigration, and urban development broadly speaking. Within those areas, we look for mapping projects where we can have an impact, where we can leverage CUR’s mapping skills and expertise in analyzing urban trends, and that come with funding support so we can cover staff time and related expenses.

We’re especially interested in working with our colleagues throughout CUNY, as well as within city government (since CUNY has a close relationship with New York City agencies), but we also take on projects with a wide array of partners.

If the project involves an online mapping component we try to structure it so we can incorporate the latest and greatest interactive web and mapping techniques and technologies. Continue reading