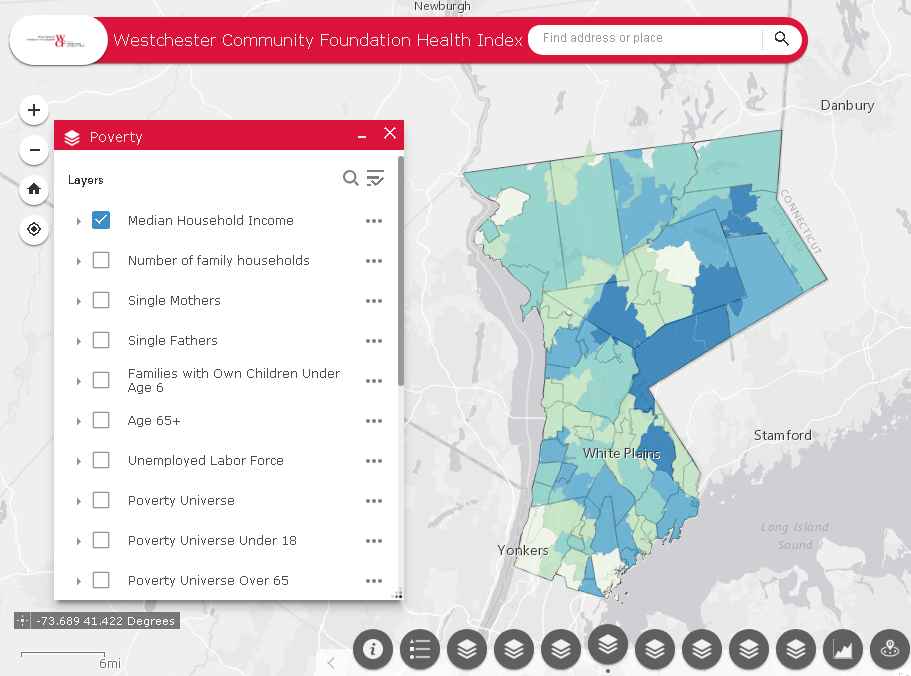
“R”-based software application is used by public health researchers and data analysts
While often much of the Empire State GIS software discussion evolves around the use of the ESRI platform, there continues to be a steady dose and discussion of alternative geospatial client and web-based products. For example, staff at the New York State Department of Health (NYSDOH) use ArcGIS, but also other GIS programs including MapInfo, Map Marker, SatScan, and QGIS, as well as statistical programs like SAS, SPSS and Tableau for research and surveillance projects.
Supported by funding from the Centers for Disease Control and Prevention (CDC), staff from the NYSDOH Environmental Public Health Tracking (EPHT) Program – also known as “Tracking” – has leveraged the free and open-source software program “R” to develop and maintain the Geographic Aggregation Tool (GAT). R has grown primarily out of the statistics and data analysis space which is very popular and used extensively in public health research.
GAT is currently maintained by Abigail Stamm at NYSDOH who supports a GAT webpage on GitHub containing an extensive listing of documentation, developer tools, metadata, tutorials and more. According to Stamm, EPHT staff like using R for a couple of reasons including:
- R is free, easily accessible to the public, and enables staff to share the GAT package with agencies that do not have an ArcGIS license or the training and resources to use any of the other geographical software. (Legacy versions of GAT, including a SAS version, are archived on GitHub.)
- The GAT package automates everything. This is particularly valuable especially if users include scripting options which bypass the Graphic User Interface (series of pop-up windows) and reduces likelihood of mistakes and makes recording and reproducing workflows and updating much easier.
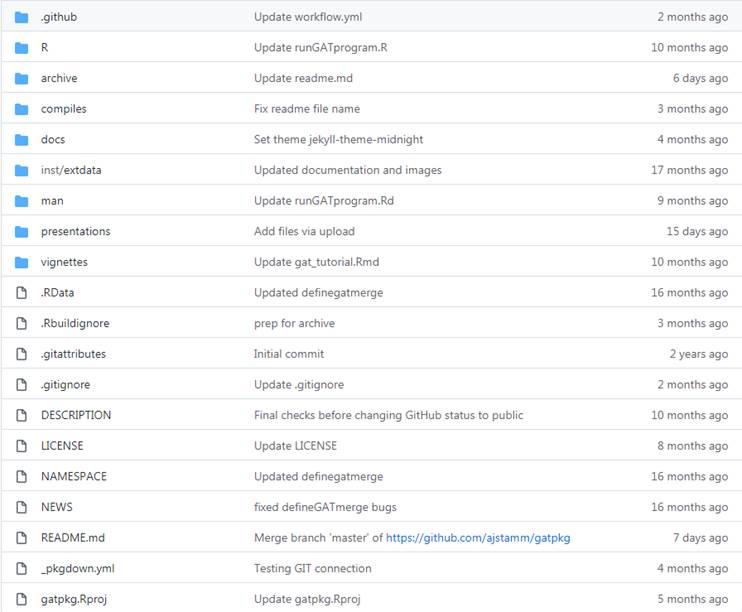
GAT documentation and content on GitHub.
At its core, GAT aggregates, or dissolves, geographic areas (most commonly used is census tract geography) based on numeric values for each area, such as case or population numbers, as well as other demographic values such as median income. Health researchers often want subject data at a higher granularity than the county-level, which can conceal or mask variation, especially in counties with a mix of urban and rural populations. Also, showing data at town level won’t work because many rural towns have very small populations. Areas with small populations are likely to have few cases, resulting in unstable rates and also putting confidentiality of cases at risk.
To overcome these limitations NYSDOH developed GAT to join neighboring geographic areas together until a user defined population and/or number of cases is reached to support the statistical analysis desired. This allows local health departments and others to use rates to identify hot spots for targeted interventions. GAT can also be used to produce maps at varying geographic resolutions required by the user.
How GAT Works
GAT requests user inputs through a series of dialogs, including menus, checkboxes, and text boxes, so no programming knowledge is necessary. GAT reads in a polygon shapefile which must contain, at minimum, a character variable that uniquely identifies areas and a numeric variable to sum for aggregation. A series of dialog boxes allows the user to select:
- A variable to uniquely identify areas
- One or two aggregation variables
- Optionally, a variable of areas within which merging will be preferred (ex. county)
- The value (sum) to which the selected aggregation variable(s) should be aggregated
- The preferred aggregation method: closest geographic or population-weighted centroid, least value, or ratio of two values
Depending on the specifics of the data and the type of analysis of interest to the user, GAT offers four types of aggregation methods:
- Closest geographic centroid
- Closest population – weighted centroid
- Neighbor with the lowest count
- Most similar neighbor
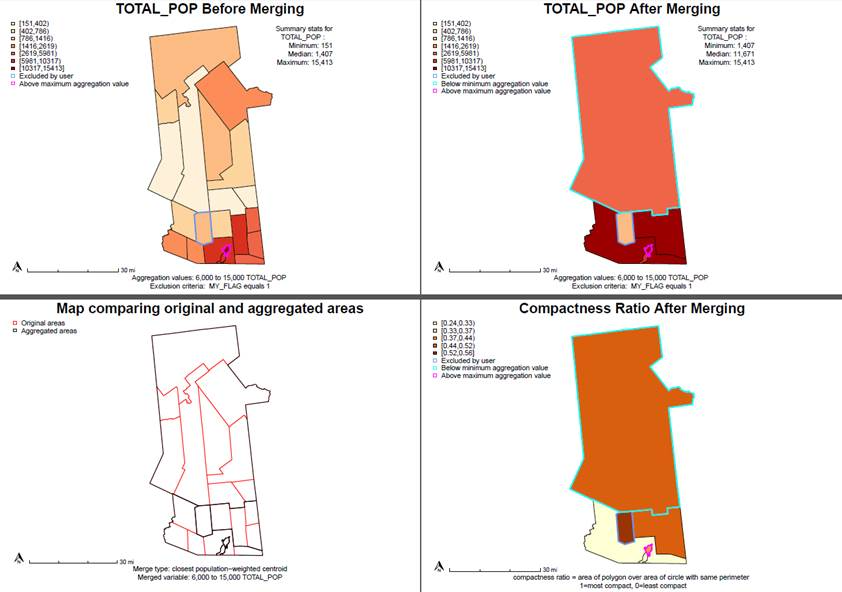
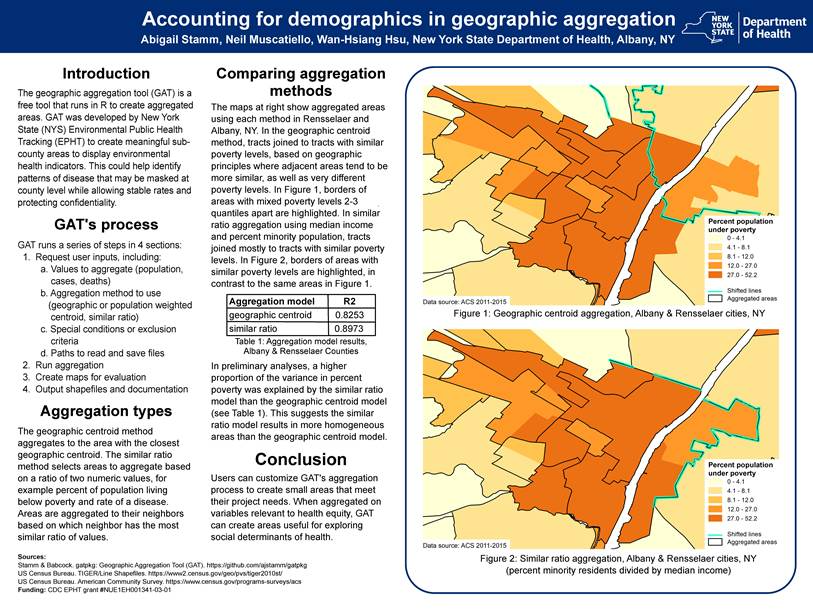
Applying different rules or criteria to the different GAT aggregation results produce contrasting results. These are samples of the GAT aggregation tool when applied to total population numbers in towns in Hamilton and Fulton (NY) Counties. Sample code for producing these maps can be accessed here.
GAT produces two shapefiles, an aggregated file and a crosswalk. GAT also produces a PDF of maps and a log of the entire process, including user settings, any warnings, and a brief data dictionary. (The PDF and log provide much more information than being shown in this article). These files are designed to help evaluate and report aggregation results and standardize user process. NYSDOH staff developed GAT to standardize and automate how to aggregate New York’s 4900 census tracts.
Using the different aggregation methods may affect the values of resulting aggregated areas in different ways. For example, it was found when testing GAT that in cases where a small corner of a census tract contained most of its population, aggregating by geographic versus population weighted centroid could provide very different results. Also, when developing aggregated areas for the Tracking portal, it was recognized the portal would be displaying disease rates. NYSDOH staff felt the most suitable aggregation method for these population-based measures would be to aggregate to the closest population weighted centroid. To check for areas with smaller populations and unusually large numbers of cases, users have the option to aggregate by case count rather than population (or in addition to population).
While access to health data and resolution of data varies across the NYSDOH (point/address, census tract, zip code, or municipal level), staff in the Tracking program receive hospitalization and emergency room visit data at point level (resident address) from the Statewide Planning and Research Cooperative System (SPARCS). Staff geocode these datasets using multiple programs including MapMarker, SAM in ArcGIS, and NYCGBAT and assign the encompassing census tract to the point data. Methods to assign to tract based on zip code or town and to impute tracts for records that cannot be geocoded due to incomplete address have also been developed.
Other Applications of GAT
Public Use in New York State
Working towards NYSDOH’s goal of making sub-county data more accessible, NYS EPHT is developing a platform which will display environmental health outcomes and exposures in an interactive mapping application. The current EPHT data portal displays county-level indicators but EPHT staff are redesigning it to include subcounty data using the sub-county aggregated areas created by GAT. This will assist local agencies with targeting interventions while maintaining privacy and confidentiality.
Tracking is also working with Health Data NY (HDNY) to display the sub-county data. The HDNY platform will serve as a data repository displaying data for environmental health outcomes including asthma, chronic obstructive pulmonary disease (COPD), and myocardial infarction (MI; heart attacks), since these are the health outcomes local agencies are most interested in when planning extreme weather-related mitigation and resource allocation. The data will be available for public download along with the shapefile and a brief description of how the shapefile was developed.
The CDC is also using GAT to develop sub-county areas for various health outcome indicators having piloted it for data from other EPHT grantee states for health outcomes including asthma, MI, and COPD.
Sampling Design
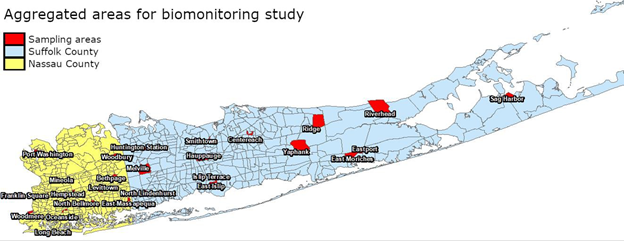
GAT is also being used in the development and selection of sampling areas as part of Biomonitoring NY, a statewide biomonitoring project. In the first year of sampling this effort has focused on the sampling of households on Long Island. To this end, the group aggregated 2010 census block groups within census tracts so that each aggregated area had at least 440 households. In the next step, remaining tracts that were too small to meet the household minimum were aggregated to neighboring tracts. After completing the final aggregation, study staff randomly selected 25 aggregated areas and mailed postcards and invitation packets soliciting participants in households in the block groups within the selected aggregated areas. Read more about the project.
Biomonitoring is a way of measuring the amount of environmental chemicals found in the human body. It is an important part of New York statewide epidemiological research that seeks to determine levels of chemical exposure in the human body and help better understand whether chemical exposures are associated with health effects in humans.
Informing Policy
In 2019, NYS passed the nation-leading Climate Leadership and Community Protection Act (CLCPA; aka “Climate Act”) to empower New York residents to fight climate change at home, at work, and in their communities. NYSDOH, along with several other state agencies, is providing support and assisting in the implementation of the Climate Act. One effort includes identifying disadvantaged communities (DAC) that could benefit from mitigation efforts and allocation of investments. GAT was used to create sub-county areas for several climate-impacted health indicators that will be analyzed with multiple other variables to define DACs.
Learn More About GAT
A variety of documentation is available on the use and development of GAT. Slides (pdf) from a 2020 and National Association of Health Data Organizations (NAHDO) presentation by NYSDOH staff are available here including a YouTube video. GAT slides and a video from the 2021 useR Conference are also available. Most recently staff presented at the 2021 Place and Health Conference in November which included epidemiologists, health geographers, social and behavioral scientists, statisticians, data scientists, and public health professionals from all levels of government.
GAT poster that was presented at the 2021 Place and Health Conference (download here). A lightning talk is also available.
Contact:
Abigail Stamm, Research Scientist
Bureau of Environmental and Occupational Epidemiology
New York State Department of Health
abigail.stamm@health.ny.gov
GAT was written in R-2.9.2 under Windows XP and was revised and converted to a package in R-3.4.3 under Windows 10 using RStudio-1.4.1103 and devtools-2.3.2. The latest version of GAT was compiled in R-3.6.1 and runs in R-3.5.3 through R-4.1.1.
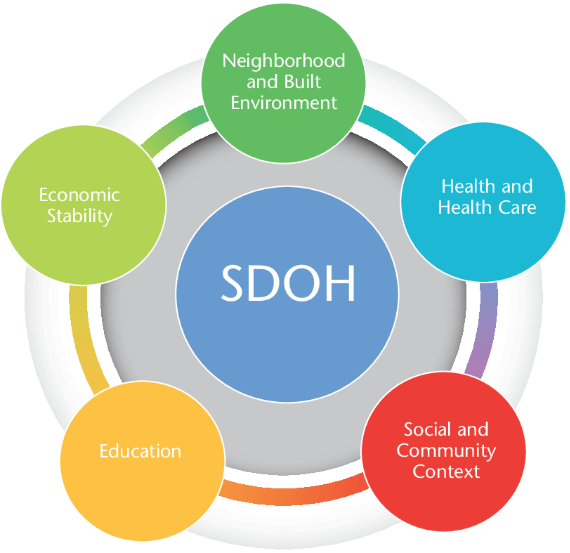 and tracking of social determinants of health. Universities, governmental and non-profit organizations now routinely collect such data and utilize GIS to help inform analysis and better decision-making, leading to stronger policies. The Healthy People 2020 Approach to Social Determinants of Health employs a